

Key Insights
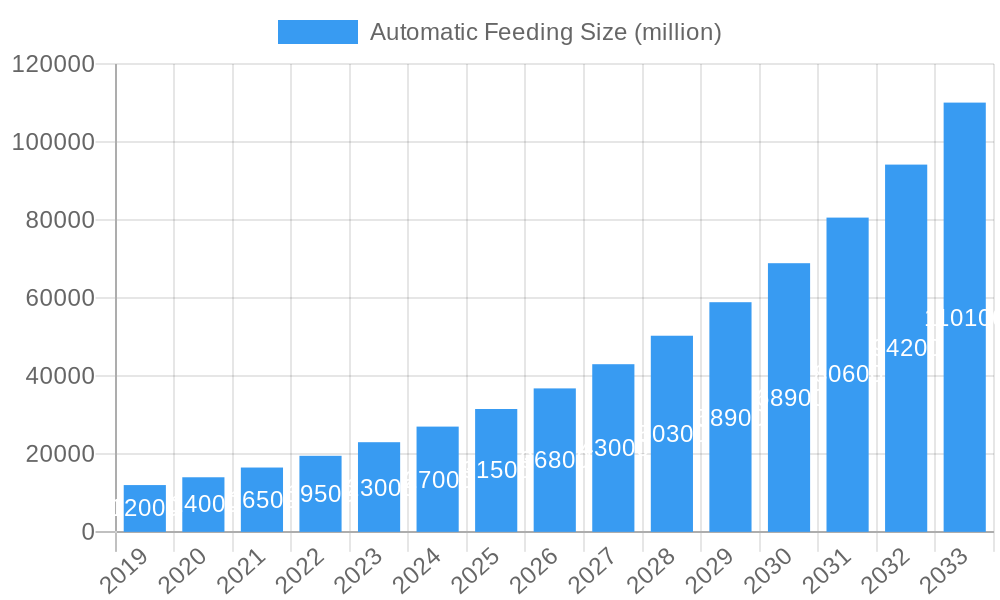
The global automatic feeding systems market is experiencing robust expansion, projected to reach a significant 36,560 million by the end of the study period. This impressive growth is fueled by a substantial Compound Annual Growth Rate (CAGR) of 17.2% throughout the forecast period. This surge is primarily driven by increasing global demand for animal protein, necessitating more efficient and sustainable livestock management practices. The adoption of advanced technologies like IoT and AI in feeding systems is a key trend, enabling precise nutrient delivery, reduced waste, and improved animal health monitoring. Furthermore, the growing awareness among farmers regarding the economic benefits of automation, including labor cost reduction and enhanced productivity, is a major catalyst for market penetration. The market is segmented by application into Poultry, Swine, Fish, Ruminants, Equine, and Others, with Poultry and Swine applications leading in adoption due to intensive farming operations. The Type segmentation includes Basic Systems and Complete Systems, with a growing preference for integrated, complete systems that offer end-to-end automation.

Automatic Feeding Market Size (In Billion)
The market's trajectory is further supported by escalating concerns around food security and the need to optimize resource utilization in animal agriculture. Innovations in sensor technology, automated dispensing, and data analytics are transforming traditional feeding methods into sophisticated, data-driven operations. While the market exhibits strong growth, potential restraints such as the high initial investment cost for advanced systems in developing regions and the need for skilled labor to operate and maintain sophisticated equipment could pose challenges. However, government initiatives promoting sustainable agriculture and technological adoption, alongside the persistent need for increased efficiency in livestock production, are expected to outweigh these restraints, propelling the automatic feeding systems market to new heights. Leading companies are actively investing in research and development to offer more intelligent, cost-effective, and scalable solutions, further stimulating market expansion across diverse geographical regions.
Automatic Feeding Company Market Share
Automatic Feeding Market Research Report: Unlocking Global Livestock Efficiency
This comprehensive Automatic Feeding Market report delves into a dynamic and rapidly evolving sector, critical for optimizing livestock production worldwide. Leveraging an extensive study period from 2019 to 2033, with a base year of 2025, this analysis provides unparalleled insights into market size, growth trajectories, and competitive strategies. We meticulously examine the global landscape, forecast future trends, and identify key opportunities for stakeholders across the entire value chain. With an estimated market valuation reaching over 10 million million in the forecast period, this report is an indispensable resource for understanding the forces shaping the future of automated animal husbandry.
Automatic Feeding Market Structure & Competitive Landscape
The global automatic feeding market, projected to reach over 10 million million by 2033, exhibits a moderately concentrated structure. Leading players like AGCO Corporation, GEA, Delaval Holding, Big Dutchman, Kuhn, TAD, Trioliet, Lely Holding, Boumatic LLC, Afimilk, Davisway, and Fullwood Packo are actively shaping the competitive arena. Innovation drivers are paramount, with significant investments in AI-driven feeding schedules, precision nutrient delivery, and data analytics for herd management. Regulatory impacts, though varied by region, increasingly focus on animal welfare and environmental sustainability, pushing for more efficient and less wasteful feeding practices. Product substitutes, such as manual feeding systems, are steadily losing ground due to the undeniable ROI of automation. End-user segmentation reveals a strong demand across Poultry, Swine, and Ruminants, each with specific needs and adoption rates. Mergers and acquisitions (M&A) are a notable trend, with an estimated over 5 million million in transaction values observed historically, as companies seek to expand their product portfolios, technological capabilities, and geographic reach.
Automatic Feeding Market Trends & Opportunities
The automatic feeding market is experiencing robust growth, driven by an escalating global demand for animal protein and a growing imperative for sustainable and efficient livestock farming. The market size, estimated to be in the range of several million million in the base year 2025, is projected to witness a compound annual growth rate (CAGR) of approximately 10% over the forecast period from 2025 to 2033. This remarkable expansion is fueled by several interconnected trends. Technological advancements are at the forefront, with the integration of the Internet of Things (IoT), Artificial Intelligence (AI), and advanced robotics revolutionizing feeding systems. These innovations enable real-time monitoring of animal health, precise feed formulation based on individual animal needs, and optimized feed delivery schedules, leading to significant improvements in feed conversion ratios and overall animal productivity. The increasing adoption of precision agriculture principles within livestock management further accelerates the demand for sophisticated automatic feeding solutions.
Consumer preferences are also playing a pivotal role. Growing awareness regarding animal welfare, food safety, and the environmental footprint of livestock farming is compelling producers to adopt technologies that enhance transparency, reduce stress on animals, and minimize waste. Automatic feeding systems contribute directly to these objectives by ensuring consistent and balanced nutrition, reducing competition for feed, and facilitating better hygiene in feeding areas. Furthermore, government initiatives and subsidies promoting modern agricultural practices and technology adoption in various key regions are creating a fertile ground for market expansion.
The competitive landscape is characterized by both established global players and emerging regional innovators. Companies are increasingly focusing on developing integrated solutions that encompass not only feeding but also data management, herd health monitoring, and farm automation. This shift towards holistic farm management systems presents significant opportunities for value-added services and recurring revenue streams. Market penetration rates are steadily increasing, particularly in developed economies, while emerging markets are poised for substantial growth as their agricultural sectors modernize and embrace technological solutions. The potential for smart feeding systems, capable of predictive maintenance and optimizing resource allocation, represents a significant future growth avenue. The growing focus on specialized feeding solutions for different animal types and life stages further diversifies the market and creates niche opportunities for specialized providers.
Dominant Markets & Segments in Automatic Feeding
The global automatic feeding market is characterized by distinct regional dominance and segment preferences, driven by varying agricultural practices, economic conditions, and policy landscapes. Among the Application segments, Ruminants represent a particularly dominant market, accounting for an estimated over 30% of the market share in 2025. This is driven by the substantial scale of dairy and beef farming operations globally, where precision feeding is crucial for maximizing milk production and optimizing meat yield. Key growth drivers in this segment include the need for increased efficiency in large-scale dairy operations and the demand for specialized nutrition to enhance herd health and productivity. Policies supporting dairy modernization and sustainability initiatives further bolster this segment.
Following closely, the Poultry segment commands a significant market share, estimated at over 25%. The intensive nature of poultry farming, coupled with rapid growth cycles, necessitates highly automated and precise feeding to ensure optimal growth rates and minimize feed waste. Growth drivers here include the ever-increasing global demand for poultry meat and eggs, the focus on biosecurity, and the adoption of advanced technologies for feed control and monitoring in large commercial farms. Government support for modernizing the poultry industry and stringent quality control measures also contribute to its dominance.
The Swine segment is another major contributor, holding an estimated over 20% market share. Similar to poultry, efficient feed management is paramount for profitability in hog farming. Factors driving growth include the need to optimize feed conversion ratios, reduce disease transmission through controlled feeding environments, and comply with environmental regulations concerning waste management. Technological advancements in individualized feeding for sows and piglets are also gaining traction.
The Type segmentation reveals a strong preference for Complete Systems, which account for an estimated over 60% of the market. These comprehensive solutions offer integrated feeding, management, and data tracking capabilities, providing a one-stop shop for farmers seeking to modernize their operations. The demand for complete systems is driven by their ability to deliver higher ROI through enhanced efficiency, reduced labor costs, and improved farm management insights. Basic Systems, while still relevant, represent a smaller but growing segment, catering to smaller farms or those looking for modular upgrades.
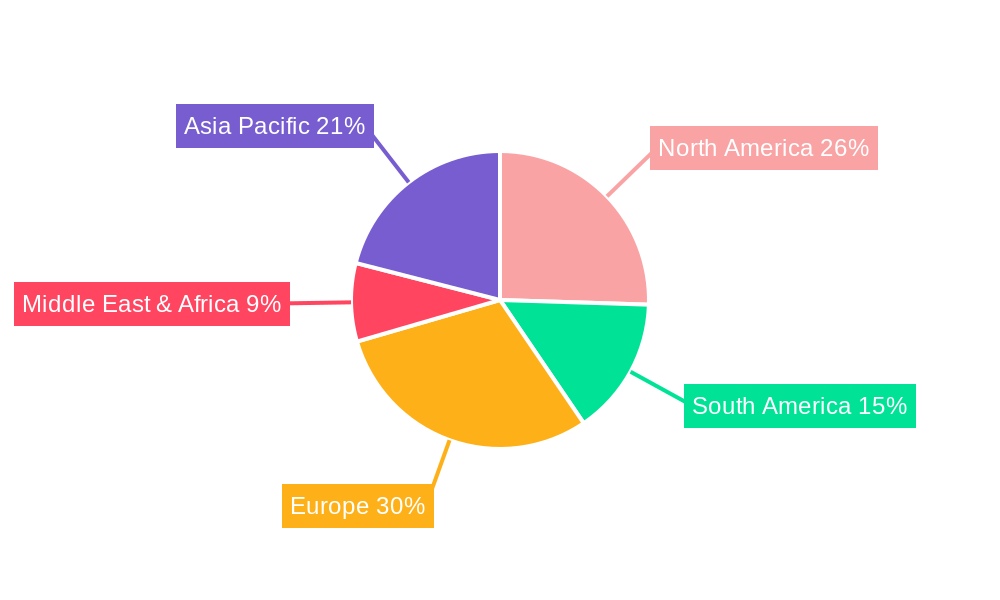
Geographically, North America and Europe currently dominate the market due to their mature agricultural sectors, high adoption rates of advanced technologies, and supportive regulatory frameworks. However, the Asia-Pacific region is exhibiting the fastest growth, driven by rapid agricultural modernization, increasing disposable incomes leading to higher meat consumption, and government investments in improving food security and agricultural productivity.
Automatic Feeding Product Analysis
Automatic feeding products are increasingly characterized by sophisticated technological integrations aimed at enhancing precision, efficiency, and animal welfare. Innovations focus on AI-powered algorithms for real-time feed adjustment based on individual animal data, the use of advanced sensors for monitoring feed intake and nutrient levels, and the integration of robotics for automated feed distribution. Key applications span the entire livestock spectrum, from advanced multi-component ration mixers for ruminants to highly accurate pellet dispensers for poultry and swine. Competitive advantages lie in the ability of these systems to provide granular data on feed consumption, optimize nutrient delivery for improved animal health and performance, reduce labor costs, and minimize feed waste, ultimately contributing to a more sustainable and profitable agricultural output.
Key Drivers, Barriers & Challenges in Automatic Feeding
Key Drivers:
- Technological Advancements: AI, IoT, and robotics enable precision feeding, real-time monitoring, and data-driven decision-making, leading to enhanced efficiency and productivity.
- Growing Global Demand for Animal Protein: Increasing population and rising disposable incomes globally necessitate higher livestock output, driving the adoption of efficient feeding solutions.
- Focus on Animal Welfare and Sustainability: Automation reduces stress, improves hygiene, and minimizes feed waste, aligning with consumer demands and regulatory pressures for responsible farming.
- Labor Shortages and Rising Labor Costs: Automatic systems offer a viable solution to mitigate the impact of a shrinking agricultural workforce and escalating labor expenses.
- Government Support and Subsidies: Many governments are promoting the adoption of modern agricultural technologies through financial incentives and policy support.
Barriers & Challenges:
- High Initial Investment Costs: The upfront capital expenditure for advanced automatic feeding systems can be a significant barrier for smaller farms or those in developing economies.
- Technical Expertise and Training: Operating and maintaining complex automated systems requires a skilled workforce, posing a challenge in regions with limited technical training infrastructure.
- Connectivity and Infrastructure Limitations: Reliable internet access and stable power supply are crucial for IoT-enabled systems, which can be lacking in remote agricultural areas.
- Interoperability and Standardization Issues: The lack of universal standards across different manufacturers can lead to integration challenges between various farm management technologies.
- Regulatory Hurdles and Compliance: Navigating diverse and evolving regulations related to animal welfare, food safety, and environmental impact can be complex.
Growth Drivers in the Automatic Feeding Market
The automatic feeding market's growth is primarily propelled by significant technological advancements, including the integration of Artificial Intelligence for predictive feeding strategies and the widespread adoption of the Internet of Things (IoT) for real-time data collection. Economically, the escalating global demand for animal protein, driven by population growth and rising incomes, creates an urgent need for efficient and scalable livestock production. Regulatory frameworks are also playing a crucial role, with increasing emphasis on animal welfare standards and environmental sustainability pushing farmers towards automated solutions that minimize waste and improve animal living conditions. For instance, in the European Union, stringent regulations on manure management indirectly encourage feeding systems that optimize nutrient utilization, reducing environmental impact.
Challenges Impacting Automatic Feeding Growth
Significant challenges impacting automatic feeding growth include the substantial initial capital investment required for advanced systems, which can be prohibitive for many smaller-scale producers. Supply chain disruptions, as witnessed in recent years, can also impact the availability and cost of critical components. Furthermore, the need for skilled labor to operate and maintain these sophisticated technologies presents a barrier in regions with limited technical training infrastructure. Competitive pressures from both established global players and emerging local manufacturers also necessitate continuous innovation and cost optimization. Regulatory complexities, particularly concerning data privacy and standardization across different platforms, add another layer of challenge for market expansion.
Key Players Shaping the Automatic Feeding Market
- AGCO Corporation
- GEA
- Delaval Holding
- Big Dutchman
- Kuhn
- TAD
- Trioliet
- Lely Holding
- Boumatic LLC
- Afimilk
- Davisway
- Fullwood Packo
Significant Automatic Feeding Industry Milestones
- 2019: Introduction of AI-powered feed formulation algorithms for enhanced nutrient precision.
- 2020: Increased investment in IoT integration for remote monitoring and control of feeding systems.
- 2021: Launch of robotic feeding solutions for greater automation and reduced labor dependency.
- 2022: Growing emphasis on data analytics platforms to optimize herd health and feeding efficiency.
- 2023: Expansion of integrated farm management systems combining feeding with other automation technologies.
- 2024: Rise in the adoption of specialized feeding solutions for niche animal segments and specific life stages.
Future Outlook for Automatic Feeding Market
The future outlook for the automatic feeding market is exceptionally bright, driven by ongoing technological innovation and the persistent global need for efficient livestock production. Strategic opportunities lie in the further integration of AI and machine learning for predictive analytics, enabling farms to anticipate and address potential issues before they impact productivity. The expansion of smart farm ecosystems, where feeding systems seamlessly communicate with other automated farm components, will be a key growth catalyst. Furthermore, the increasing focus on sustainability and traceability in the food supply chain will continue to fuel demand for automated solutions that ensure resource optimization and transparency. Market potential is immense, particularly in emerging economies as they modernize their agricultural sectors and embrace advanced technologies to meet growing food demands.
Automatic Feeding Segmentation
-
1. Application
- 1.1. Poultry
- 1.2. Swine
- 1.3. Fish
- 1.4. Ruminants
- 1.5. Equine
- 1.6. Others
-
2. Type
- 2.1. Basic Systems
- 2.2. Complete System
Automatic Feeding Segmentation By Geography
-
1. North America
- 1.1. United States
- 1.2. Canada
- 1.3. Mexico
-
2. South America
- 2.1. Brazil
- 2.2. Argentina
- 2.3. Rest of South America
-
3. Europe
- 3.1. United Kingdom
- 3.2. Germany
- 3.3. France
- 3.4. Italy
- 3.5. Spain
- 3.6. Russia
- 3.7. Benelux
- 3.8. Nordics
- 3.9. Rest of Europe
-
4. Middle East & Africa
- 4.1. Turkey
- 4.2. Israel
- 4.3. GCC
- 4.4. North Africa
- 4.5. South Africa
- 4.6. Rest of Middle East & Africa
-
5. Asia Pacific
- 5.1. China
- 5.2. India
- 5.3. Japan
- 5.4. South Korea
- 5.5. ASEAN
- 5.6. Oceania
- 5.7. Rest of Asia Pacific
Automatic Feeding Regional Market Share
Geographic Coverage of Automatic Feeding
Automatic Feeding REPORT HIGHLIGHTS
| Aspects | Details |
|---|---|
| Study Period | 2020-2034 |
| Base Year | 2025 |
| Estimated Year | 2026 |
| Forecast Period | 2026-2034 |
| Historical Period | 2020-2025 |
| Growth Rate | CAGR of 17.2% from 2020-2034 |
| Segmentation |
|
Table of Contents
- 1. Introduction
- 1.1. Research Scope
- 1.2. Market Segmentation
- 1.3. Research Methodology
- 1.4. Definitions and Assumptions
- 2. Executive Summary
- 2.1. Introduction
- 3. Market Dynamics
- 3.1. Introduction
- 3.2. Market Drivers
- 3.3. Market Restrains
- 3.4. Market Trends
- 4. Market Factor Analysis
- 4.1. Porters Five Forces
- 4.2. Supply/Value Chain
- 4.3. PESTEL analysis
- 4.4. Market Entropy
- 4.5. Patent/Trademark Analysis
- 5. Global Automatic Feeding Analysis, Insights and Forecast, 2020-2032
- 5.1. Market Analysis, Insights and Forecast - by Application
- 5.1.1. Poultry
- 5.1.2. Swine
- 5.1.3. Fish
- 5.1.4. Ruminants
- 5.1.5. Equine
- 5.1.6. Others
- 5.2. Market Analysis, Insights and Forecast - by Type
- 5.2.1. Basic Systems
- 5.2.2. Complete System
- 5.3. Market Analysis, Insights and Forecast - by Region
- 5.3.1. North America
- 5.3.2. South America
- 5.3.3. Europe
- 5.3.4. Middle East & Africa
- 5.3.5. Asia Pacific
- 5.1. Market Analysis, Insights and Forecast - by Application
- 6. North America Automatic Feeding Analysis, Insights and Forecast, 2020-2032
- 6.1. Market Analysis, Insights and Forecast - by Application
- 6.1.1. Poultry
- 6.1.2. Swine
- 6.1.3. Fish
- 6.1.4. Ruminants
- 6.1.5. Equine
- 6.1.6. Others
- 6.2. Market Analysis, Insights and Forecast - by Type
- 6.2.1. Basic Systems
- 6.2.2. Complete System
- 6.1. Market Analysis, Insights and Forecast - by Application
- 7. South America Automatic Feeding Analysis, Insights and Forecast, 2020-2032
- 7.1. Market Analysis, Insights and Forecast - by Application
- 7.1.1. Poultry
- 7.1.2. Swine
- 7.1.3. Fish
- 7.1.4. Ruminants
- 7.1.5. Equine
- 7.1.6. Others
- 7.2. Market Analysis, Insights and Forecast - by Type
- 7.2.1. Basic Systems
- 7.2.2. Complete System
- 7.1. Market Analysis, Insights and Forecast - by Application
- 8. Europe Automatic Feeding Analysis, Insights and Forecast, 2020-2032
- 8.1. Market Analysis, Insights and Forecast - by Application
- 8.1.1. Poultry
- 8.1.2. Swine
- 8.1.3. Fish
- 8.1.4. Ruminants
- 8.1.5. Equine
- 8.1.6. Others
- 8.2. Market Analysis, Insights and Forecast - by Type
- 8.2.1. Basic Systems
- 8.2.2. Complete System
- 8.1. Market Analysis, Insights and Forecast - by Application
- 9. Middle East & Africa Automatic Feeding Analysis, Insights and Forecast, 2020-2032
- 9.1. Market Analysis, Insights and Forecast - by Application
- 9.1.1. Poultry
- 9.1.2. Swine
- 9.1.3. Fish
- 9.1.4. Ruminants
- 9.1.5. Equine
- 9.1.6. Others
- 9.2. Market Analysis, Insights and Forecast - by Type
- 9.2.1. Basic Systems
- 9.2.2. Complete System
- 9.1. Market Analysis, Insights and Forecast - by Application
- 10. Asia Pacific Automatic Feeding Analysis, Insights and Forecast, 2020-2032
- 10.1. Market Analysis, Insights and Forecast - by Application
- 10.1.1. Poultry
- 10.1.2. Swine
- 10.1.3. Fish
- 10.1.4. Ruminants
- 10.1.5. Equine
- 10.1.6. Others
- 10.2. Market Analysis, Insights and Forecast - by Type
- 10.2.1. Basic Systems
- 10.2.2. Complete System
- 10.1. Market Analysis, Insights and Forecast - by Application
- 11. Competitive Analysis
- 11.1. Global Market Share Analysis 2025
- 11.2. Company Profiles
- 11.2.1 AGCO Corporation
- 11.2.1.1. Overview
- 11.2.1.2. Products
- 11.2.1.3. SWOT Analysis
- 11.2.1.4. Recent Developments
- 11.2.1.5. Financials (Based on Availability)
- 11.2.2 GEA
- 11.2.2.1. Overview
- 11.2.2.2. Products
- 11.2.2.3. SWOT Analysis
- 11.2.2.4. Recent Developments
- 11.2.2.5. Financials (Based on Availability)
- 11.2.3 Delaval Holding
- 11.2.3.1. Overview
- 11.2.3.2. Products
- 11.2.3.3. SWOT Analysis
- 11.2.3.4. Recent Developments
- 11.2.3.5. Financials (Based on Availability)
- 11.2.4 Big Dutchman
- 11.2.4.1. Overview
- 11.2.4.2. Products
- 11.2.4.3. SWOT Analysis
- 11.2.4.4. Recent Developments
- 11.2.4.5. Financials (Based on Availability)
- 11.2.5 Kuhn
- 11.2.5.1. Overview
- 11.2.5.2. Products
- 11.2.5.3. SWOT Analysis
- 11.2.5.4. Recent Developments
- 11.2.5.5. Financials (Based on Availability)
- 11.2.6 TAD
- 11.2.6.1. Overview
- 11.2.6.2. Products
- 11.2.6.3. SWOT Analysis
- 11.2.6.4. Recent Developments
- 11.2.6.5. Financials (Based on Availability)
- 11.2.7 Trioliet
- 11.2.7.1. Overview
- 11.2.7.2. Products
- 11.2.7.3. SWOT Analysis
- 11.2.7.4. Recent Developments
- 11.2.7.5. Financials (Based on Availability)
- 11.2.8 Lely Holding
- 11.2.8.1. Overview
- 11.2.8.2. Products
- 11.2.8.3. SWOT Analysis
- 11.2.8.4. Recent Developments
- 11.2.8.5. Financials (Based on Availability)
- 11.2.9 Boumatic LLC
- 11.2.9.1. Overview
- 11.2.9.2. Products
- 11.2.9.3. SWOT Analysis
- 11.2.9.4. Recent Developments
- 11.2.9.5. Financials (Based on Availability)
- 11.2.10 Afimilk
- 11.2.10.1. Overview
- 11.2.10.2. Products
- 11.2.10.3. SWOT Analysis
- 11.2.10.4. Recent Developments
- 11.2.10.5. Financials (Based on Availability)
- 11.2.11 Davisway
- 11.2.11.1. Overview
- 11.2.11.2. Products
- 11.2.11.3. SWOT Analysis
- 11.2.11.4. Recent Developments
- 11.2.11.5. Financials (Based on Availability)
- 11.2.12 Fullwood Packo
- 11.2.12.1. Overview
- 11.2.12.2. Products
- 11.2.12.3. SWOT Analysis
- 11.2.12.4. Recent Developments
- 11.2.12.5. Financials (Based on Availability)
- 11.2.1 AGCO Corporation
List of Figures
- Figure 1: Global Automatic Feeding Revenue Breakdown (million, %) by Region 2025 & 2033
- Figure 2: Global Automatic Feeding Volume Breakdown (K, %) by Region 2025 & 2033
- Figure 3: North America Automatic Feeding Revenue (million), by Application 2025 & 2033
- Figure 4: North America Automatic Feeding Volume (K), by Application 2025 & 2033
- Figure 5: North America Automatic Feeding Revenue Share (%), by Application 2025 & 2033
- Figure 6: North America Automatic Feeding Volume Share (%), by Application 2025 & 2033
- Figure 7: North America Automatic Feeding Revenue (million), by Type 2025 & 2033
- Figure 8: North America Automatic Feeding Volume (K), by Type 2025 & 2033
- Figure 9: North America Automatic Feeding Revenue Share (%), by Type 2025 & 2033
- Figure 10: North America Automatic Feeding Volume Share (%), by Type 2025 & 2033
- Figure 11: North America Automatic Feeding Revenue (million), by Country 2025 & 2033
- Figure 12: North America Automatic Feeding Volume (K), by Country 2025 & 2033
- Figure 13: North America Automatic Feeding Revenue Share (%), by Country 2025 & 2033
- Figure 14: North America Automatic Feeding Volume Share (%), by Country 2025 & 2033
- Figure 15: South America Automatic Feeding Revenue (million), by Application 2025 & 2033
- Figure 16: South America Automatic Feeding Volume (K), by Application 2025 & 2033
- Figure 17: South America Automatic Feeding Revenue Share (%), by Application 2025 & 2033
- Figure 18: South America Automatic Feeding Volume Share (%), by Application 2025 & 2033
- Figure 19: South America Automatic Feeding Revenue (million), by Type 2025 & 2033
- Figure 20: South America Automatic Feeding Volume (K), by Type 2025 & 2033
- Figure 21: South America Automatic Feeding Revenue Share (%), by Type 2025 & 2033
- Figure 22: South America Automatic Feeding Volume Share (%), by Type 2025 & 2033
- Figure 23: South America Automatic Feeding Revenue (million), by Country 2025 & 2033
- Figure 24: South America Automatic Feeding Volume (K), by Country 2025 & 2033
- Figure 25: South America Automatic Feeding Revenue Share (%), by Country 2025 & 2033
- Figure 26: South America Automatic Feeding Volume Share (%), by Country 2025 & 2033
- Figure 27: Europe Automatic Feeding Revenue (million), by Application 2025 & 2033
- Figure 28: Europe Automatic Feeding Volume (K), by Application 2025 & 2033
- Figure 29: Europe Automatic Feeding Revenue Share (%), by Application 2025 & 2033
- Figure 30: Europe Automatic Feeding Volume Share (%), by Application 2025 & 2033
- Figure 31: Europe Automatic Feeding Revenue (million), by Type 2025 & 2033
- Figure 32: Europe Automatic Feeding Volume (K), by Type 2025 & 2033
- Figure 33: Europe Automatic Feeding Revenue Share (%), by Type 2025 & 2033
- Figure 34: Europe Automatic Feeding Volume Share (%), by Type 2025 & 2033
- Figure 35: Europe Automatic Feeding Revenue (million), by Country 2025 & 2033
- Figure 36: Europe Automatic Feeding Volume (K), by Country 2025 & 2033
- Figure 37: Europe Automatic Feeding Revenue Share (%), by Country 2025 & 2033
- Figure 38: Europe Automatic Feeding Volume Share (%), by Country 2025 & 2033
- Figure 39: Middle East & Africa Automatic Feeding Revenue (million), by Application 2025 & 2033
- Figure 40: Middle East & Africa Automatic Feeding Volume (K), by Application 2025 & 2033
- Figure 41: Middle East & Africa Automatic Feeding Revenue Share (%), by Application 2025 & 2033
- Figure 42: Middle East & Africa Automatic Feeding Volume Share (%), by Application 2025 & 2033
- Figure 43: Middle East & Africa Automatic Feeding Revenue (million), by Type 2025 & 2033
- Figure 44: Middle East & Africa Automatic Feeding Volume (K), by Type 2025 & 2033
- Figure 45: Middle East & Africa Automatic Feeding Revenue Share (%), by Type 2025 & 2033
- Figure 46: Middle East & Africa Automatic Feeding Volume Share (%), by Type 2025 & 2033
- Figure 47: Middle East & Africa Automatic Feeding Revenue (million), by Country 2025 & 2033
- Figure 48: Middle East & Africa Automatic Feeding Volume (K), by Country 2025 & 2033
- Figure 49: Middle East & Africa Automatic Feeding Revenue Share (%), by Country 2025 & 2033
- Figure 50: Middle East & Africa Automatic Feeding Volume Share (%), by Country 2025 & 2033
- Figure 51: Asia Pacific Automatic Feeding Revenue (million), by Application 2025 & 2033
- Figure 52: Asia Pacific Automatic Feeding Volume (K), by Application 2025 & 2033
- Figure 53: Asia Pacific Automatic Feeding Revenue Share (%), by Application 2025 & 2033
- Figure 54: Asia Pacific Automatic Feeding Volume Share (%), by Application 2025 & 2033
- Figure 55: Asia Pacific Automatic Feeding Revenue (million), by Type 2025 & 2033
- Figure 56: Asia Pacific Automatic Feeding Volume (K), by Type 2025 & 2033
- Figure 57: Asia Pacific Automatic Feeding Revenue Share (%), by Type 2025 & 2033
- Figure 58: Asia Pacific Automatic Feeding Volume Share (%), by Type 2025 & 2033
- Figure 59: Asia Pacific Automatic Feeding Revenue (million), by Country 2025 & 2033
- Figure 60: Asia Pacific Automatic Feeding Volume (K), by Country 2025 & 2033
- Figure 61: Asia Pacific Automatic Feeding Revenue Share (%), by Country 2025 & 2033
- Figure 62: Asia Pacific Automatic Feeding Volume Share (%), by Country 2025 & 2033
List of Tables
- Table 1: Global Automatic Feeding Revenue million Forecast, by Application 2020 & 2033
- Table 2: Global Automatic Feeding Volume K Forecast, by Application 2020 & 2033
- Table 3: Global Automatic Feeding Revenue million Forecast, by Type 2020 & 2033
- Table 4: Global Automatic Feeding Volume K Forecast, by Type 2020 & 2033
- Table 5: Global Automatic Feeding Revenue million Forecast, by Region 2020 & 2033
- Table 6: Global Automatic Feeding Volume K Forecast, by Region 2020 & 2033
- Table 7: Global Automatic Feeding Revenue million Forecast, by Application 2020 & 2033
- Table 8: Global Automatic Feeding Volume K Forecast, by Application 2020 & 2033
- Table 9: Global Automatic Feeding Revenue million Forecast, by Type 2020 & 2033
- Table 10: Global Automatic Feeding Volume K Forecast, by Type 2020 & 2033
- Table 11: Global Automatic Feeding Revenue million Forecast, by Country 2020 & 2033
- Table 12: Global Automatic Feeding Volume K Forecast, by Country 2020 & 2033
- Table 13: United States Automatic Feeding Revenue (million) Forecast, by Application 2020 & 2033
- Table 14: United States Automatic Feeding Volume (K) Forecast, by Application 2020 & 2033
- Table 15: Canada Automatic Feeding Revenue (million) Forecast, by Application 2020 & 2033
- Table 16: Canada Automatic Feeding Volume (K) Forecast, by Application 2020 & 2033
- Table 17: Mexico Automatic Feeding Revenue (million) Forecast, by Application 2020 & 2033
- Table 18: Mexico Automatic Feeding Volume (K) Forecast, by Application 2020 & 2033
- Table 19: Global Automatic Feeding Revenue million Forecast, by Application 2020 & 2033
- Table 20: Global Automatic Feeding Volume K Forecast, by Application 2020 & 2033
- Table 21: Global Automatic Feeding Revenue million Forecast, by Type 2020 & 2033
- Table 22: Global Automatic Feeding Volume K Forecast, by Type 2020 & 2033
- Table 23: Global Automatic Feeding Revenue million Forecast, by Country 2020 & 2033
- Table 24: Global Automatic Feeding Volume K Forecast, by Country 2020 & 2033
- Table 25: Brazil Automatic Feeding Revenue (million) Forecast, by Application 2020 & 2033
- Table 26: Brazil Automatic Feeding Volume (K) Forecast, by Application 2020 & 2033
- Table 27: Argentina Automatic Feeding Revenue (million) Forecast, by Application 2020 & 2033
- Table 28: Argentina Automatic Feeding Volume (K) Forecast, by Application 2020 & 2033
- Table 29: Rest of South America Automatic Feeding Revenue (million) Forecast, by Application 2020 & 2033
- Table 30: Rest of South America Automatic Feeding Volume (K) Forecast, by Application 2020 & 2033
- Table 31: Global Automatic Feeding Revenue million Forecast, by Application 2020 & 2033
- Table 32: Global Automatic Feeding Volume K Forecast, by Application 2020 & 2033
- Table 33: Global Automatic Feeding Revenue million Forecast, by Type 2020 & 2033
- Table 34: Global Automatic Feeding Volume K Forecast, by Type 2020 & 2033
- Table 35: Global Automatic Feeding Revenue million Forecast, by Country 2020 & 2033
- Table 36: Global Automatic Feeding Volume K Forecast, by Country 2020 & 2033
- Table 37: United Kingdom Automatic Feeding Revenue (million) Forecast, by Application 2020 & 2033
- Table 38: United Kingdom Automatic Feeding Volume (K) Forecast, by Application 2020 & 2033
- Table 39: Germany Automatic Feeding Revenue (million) Forecast, by Application 2020 & 2033
- Table 40: Germany Automatic Feeding Volume (K) Forecast, by Application 2020 & 2033
- Table 41: France Automatic Feeding Revenue (million) Forecast, by Application 2020 & 2033
- Table 42: France Automatic Feeding Volume (K) Forecast, by Application 2020 & 2033
- Table 43: Italy Automatic Feeding Revenue (million) Forecast, by Application 2020 & 2033
- Table 44: Italy Automatic Feeding Volume (K) Forecast, by Application 2020 & 2033
- Table 45: Spain Automatic Feeding Revenue (million) Forecast, by Application 2020 & 2033
- Table 46: Spain Automatic Feeding Volume (K) Forecast, by Application 2020 & 2033
- Table 47: Russia Automatic Feeding Revenue (million) Forecast, by Application 2020 & 2033
- Table 48: Russia Automatic Feeding Volume (K) Forecast, by Application 2020 & 2033
- Table 49: Benelux Automatic Feeding Revenue (million) Forecast, by Application 2020 & 2033
- Table 50: Benelux Automatic Feeding Volume (K) Forecast, by Application 2020 & 2033
- Table 51: Nordics Automatic Feeding Revenue (million) Forecast, by Application 2020 & 2033
- Table 52: Nordics Automatic Feeding Volume (K) Forecast, by Application 2020 & 2033
- Table 53: Rest of Europe Automatic Feeding Revenue (million) Forecast, by Application 2020 & 2033
- Table 54: Rest of Europe Automatic Feeding Volume (K) Forecast, by Application 2020 & 2033
- Table 55: Global Automatic Feeding Revenue million Forecast, by Application 2020 & 2033
- Table 56: Global Automatic Feeding Volume K Forecast, by Application 2020 & 2033
- Table 57: Global Automatic Feeding Revenue million Forecast, by Type 2020 & 2033
- Table 58: Global Automatic Feeding Volume K Forecast, by Type 2020 & 2033
- Table 59: Global Automatic Feeding Revenue million Forecast, by Country 2020 & 2033
- Table 60: Global Automatic Feeding Volume K Forecast, by Country 2020 & 2033
- Table 61: Turkey Automatic Feeding Revenue (million) Forecast, by Application 2020 & 2033
- Table 62: Turkey Automatic Feeding Volume (K) Forecast, by Application 2020 & 2033
- Table 63: Israel Automatic Feeding Revenue (million) Forecast, by Application 2020 & 2033
- Table 64: Israel Automatic Feeding Volume (K) Forecast, by Application 2020 & 2033
- Table 65: GCC Automatic Feeding Revenue (million) Forecast, by Application 2020 & 2033
- Table 66: GCC Automatic Feeding Volume (K) Forecast, by Application 2020 & 2033
- Table 67: North Africa Automatic Feeding Revenue (million) Forecast, by Application 2020 & 2033
- Table 68: North Africa Automatic Feeding Volume (K) Forecast, by Application 2020 & 2033
- Table 69: South Africa Automatic Feeding Revenue (million) Forecast, by Application 2020 & 2033
- Table 70: South Africa Automatic Feeding Volume (K) Forecast, by Application 2020 & 2033
- Table 71: Rest of Middle East & Africa Automatic Feeding Revenue (million) Forecast, by Application 2020 & 2033
- Table 72: Rest of Middle East & Africa Automatic Feeding Volume (K) Forecast, by Application 2020 & 2033
- Table 73: Global Automatic Feeding Revenue million Forecast, by Application 2020 & 2033
- Table 74: Global Automatic Feeding Volume K Forecast, by Application 2020 & 2033
- Table 75: Global Automatic Feeding Revenue million Forecast, by Type 2020 & 2033
- Table 76: Global Automatic Feeding Volume K Forecast, by Type 2020 & 2033
- Table 77: Global Automatic Feeding Revenue million Forecast, by Country 2020 & 2033
- Table 78: Global Automatic Feeding Volume K Forecast, by Country 2020 & 2033
- Table 79: China Automatic Feeding Revenue (million) Forecast, by Application 2020 & 2033
- Table 80: China Automatic Feeding Volume (K) Forecast, by Application 2020 & 2033
- Table 81: India Automatic Feeding Revenue (million) Forecast, by Application 2020 & 2033
- Table 82: India Automatic Feeding Volume (K) Forecast, by Application 2020 & 2033
- Table 83: Japan Automatic Feeding Revenue (million) Forecast, by Application 2020 & 2033
- Table 84: Japan Automatic Feeding Volume (K) Forecast, by Application 2020 & 2033
- Table 85: South Korea Automatic Feeding Revenue (million) Forecast, by Application 2020 & 2033
- Table 86: South Korea Automatic Feeding Volume (K) Forecast, by Application 2020 & 2033
- Table 87: ASEAN Automatic Feeding Revenue (million) Forecast, by Application 2020 & 2033
- Table 88: ASEAN Automatic Feeding Volume (K) Forecast, by Application 2020 & 2033
- Table 89: Oceania Automatic Feeding Revenue (million) Forecast, by Application 2020 & 2033
- Table 90: Oceania Automatic Feeding Volume (K) Forecast, by Application 2020 & 2033
- Table 91: Rest of Asia Pacific Automatic Feeding Revenue (million) Forecast, by Application 2020 & 2033
- Table 92: Rest of Asia Pacific Automatic Feeding Volume (K) Forecast, by Application 2020 & 2033
Frequently Asked Questions
1. What is the projected Compound Annual Growth Rate (CAGR) of the Automatic Feeding?
The projected CAGR is approximately 17.2%.
2. Which companies are prominent players in the Automatic Feeding?
Key companies in the market include AGCO Corporation, GEA, Delaval Holding, Big Dutchman, Kuhn, TAD, Trioliet, Lely Holding, Boumatic LLC, Afimilk, Davisway, Fullwood Packo.
3. What are the main segments of the Automatic Feeding?
The market segments include Application, Type.
4. Can you provide details about the market size?
The market size is estimated to be USD 36560 million as of 2022.
5. What are some drivers contributing to market growth?
N/A
6. What are the notable trends driving market growth?
N/A
7. Are there any restraints impacting market growth?
N/A
8. Can you provide examples of recent developments in the market?
N/A
9. What pricing options are available for accessing the report?
Pricing options include single-user, multi-user, and enterprise licenses priced at USD 3950.00, USD 5925.00, and USD 7900.00 respectively.
10. Is the market size provided in terms of value or volume?
The market size is provided in terms of value, measured in million and volume, measured in K.
11. Are there any specific market keywords associated with the report?
Yes, the market keyword associated with the report is "Automatic Feeding," which aids in identifying and referencing the specific market segment covered.
12. How do I determine which pricing option suits my needs best?
The pricing options vary based on user requirements and access needs. Individual users may opt for single-user licenses, while businesses requiring broader access may choose multi-user or enterprise licenses for cost-effective access to the report.
13. Are there any additional resources or data provided in the Automatic Feeding report?
While the report offers comprehensive insights, it's advisable to review the specific contents or supplementary materials provided to ascertain if additional resources or data are available.
14. How can I stay updated on further developments or reports in the Automatic Feeding?
To stay informed about further developments, trends, and reports in the Automatic Feeding, consider subscribing to industry newsletters, following relevant companies and organizations, or regularly checking reputable industry news sources and publications.
Methodology
Step 1 - Identification of Relevant Samples Size from Population Database


Step 2 - Approaches for Defining Global Market Size (Value, Volume* & Price*)

Note*: In applicable scenarios
Step 3 - Data Sources
Primary Research
- Web Analytics
- Survey Reports
- Research Institute
- Latest Research Reports
- Opinion Leaders
Secondary Research
- Annual Reports
- White Paper
- Latest Press Release
- Industry Association
- Paid Database
- Investor Presentations

Step 4 - Data Triangulation
Involves using different sources of information in order to increase the validity of a study
These sources are likely to be stakeholders in a program - participants, other researchers, program staff, other community members, and so on.
Then we put all data in single framework & apply various statistical tools to find out the dynamic on the market.
During the analysis stage, feedback from the stakeholder groups would be compared to determine areas of agreement as well as areas of divergence