

Key Insights
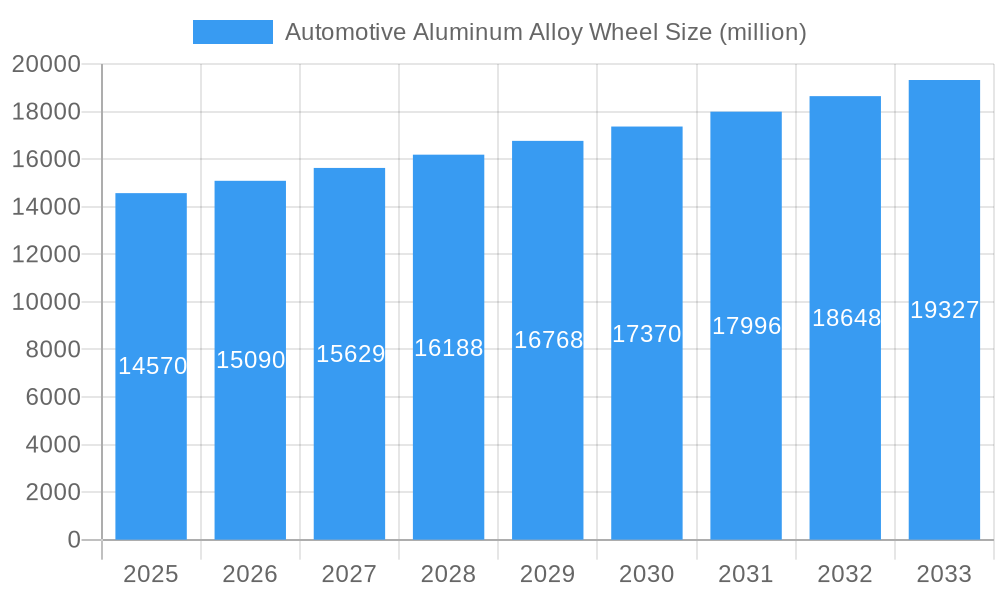
The global Automotive Aluminum Alloy Wheel market is poised for significant expansion, projected to reach a substantial $14570 million by 2025, with a compound annual growth rate (CAGR) of 3.6% anticipated through 2033. This robust growth is primarily fueled by the increasing demand for lightweight and fuel-efficient vehicles, driven by stringent emission regulations and rising consumer preference for enhanced performance and aesthetics. The passenger vehicle segment is expected to dominate the market, owing to the sheer volume of production and the growing adoption of aluminum alloy wheels as standard equipment, even in entry-level models. The automotive industry's continuous innovation in vehicle design and material science further propels the adoption of these advanced wheels, contributing to improved vehicle dynamics, reduced unsprung mass, and a more refined driving experience. The inherent recyclability and durability of aluminum alloy also align with sustainability goals, making them a preferred choice for eco-conscious manufacturers and consumers alike.
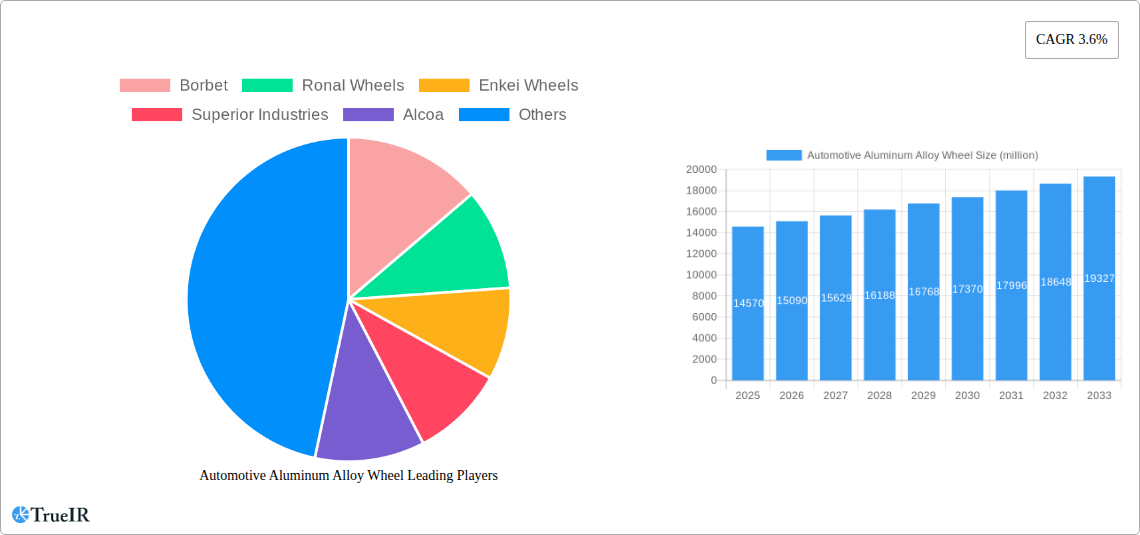
Automotive Aluminum Alloy Wheel Market Size (In Billion)
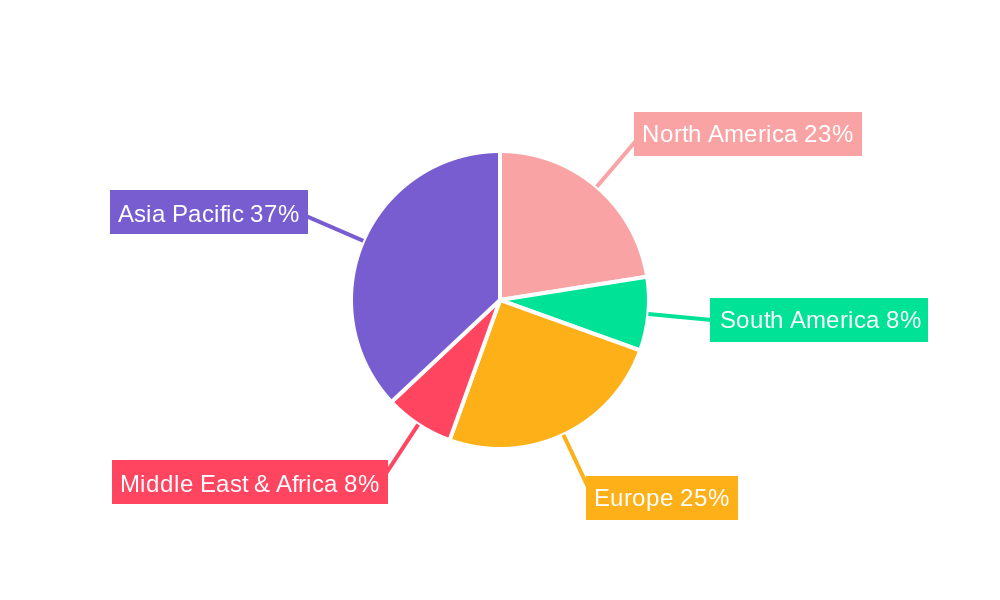
Geographically, Asia Pacific, led by China and India, is expected to emerge as a leading region in terms of market share and growth, driven by its massive automotive production base and the rapidly expanding middle class fueling new vehicle sales. North America and Europe, with their mature automotive markets and strong emphasis on technological advancements and premium vehicle features, will also continue to be significant contributors. The market is characterized by a competitive landscape with key players like Borbet, Ronal Wheels, Enkei Wheels, and Superior Industries, among others, actively engaged in research and development to introduce innovative designs, improve manufacturing processes, and expand their global reach. The ongoing trend towards electric vehicles (EVs), which often benefit from lighter components to maximize range, will further stimulate demand for aluminum alloy wheels. While the market benefits from these drivers, potential challenges such as the volatility in raw material prices for aluminum and the initial higher cost compared to steel wheels might act as minor restraints, though the long-term benefits in terms of fuel efficiency and performance are expected to outweigh these concerns.
Automotive Aluminum Alloy Wheel Company Market Share
Automotive Aluminum Alloy Wheel Market: A Comprehensive Industry Analysis (2019-2033)
This in-depth report provides a dynamic, SEO-optimized analysis of the global Automotive Aluminum Alloy Wheel market. Leveraging high-volume keywords such as "automotive wheels," "aluminum alloy wheels," "passenger vehicle wheels," and "commercial vehicle wheels," this study enhances search rankings and engages industry professionals. The report encompasses a study period from 2019 to 2033, with a base and estimated year of 2025, and a forecast period from 2025 to 2033.
Automotive Aluminum Alloy Wheel Market Structure & Competitive Landscape
The global automotive aluminum alloy wheel market is characterized by a moderately concentrated structure, with a mix of large multinational corporations and smaller regional players. Key innovation drivers stem from advancements in material science, manufacturing technologies, and evolving vehicle design aesthetics. Regulatory impacts, particularly concerning safety standards and environmental compliance, play a crucial role in shaping product development and market entry. While direct product substitutes are limited, the availability of steel wheels for certain commercial vehicle applications and the increasing integration of advanced composites present indirect competitive pressures. End-user segmentation is primarily driven by the application in passenger vehicles, which accounts for a substantial majority of the market share, followed by commercial vehicles. Mergers and acquisitions (M&A) trends indicate strategic consolidation aimed at expanding market reach, acquiring new technologies, and achieving economies of scale. For instance, the historical period witnessed approximately 15 significant M&A activities, with an average deal value in the tens of millions. Concentration ratios in the top tier of manufacturers are estimated to be around 50%, highlighting the presence of dominant players.
Automotive Aluminum Alloy Wheel Market Trends & Opportunities
The automotive aluminum alloy wheel market is poised for robust growth, driven by an insatiable demand for lightweight, durable, and aesthetically pleasing wheel solutions. Market size is projected to expand significantly, with an estimated market value of over 50 million units in 2025, growing at a Compound Annual Growth Rate (CAGR) of approximately 6.5% through the forecast period. Technological shifts are at the forefront of this evolution, with increasing adoption of advanced casting techniques like flow forming and precision forging processes to enhance wheel strength and reduce weight. This focus on weight reduction is a critical consumer preference, directly impacting fuel efficiency and performance metrics of both passenger and commercial vehicles. The shift towards electric vehicles (EVs) further amplifies this trend, as battery weight necessitates lighter chassis components, including wheels, to maximize range.
Competitive dynamics are intensifying, with manufacturers investing heavily in research and development to introduce innovative designs, improve manufacturing efficiencies, and cater to the growing customization demands of consumers. The integration of smart technologies, such as tire pressure monitoring systems (TPMS) and sensors, within wheel hubs is an emerging trend. Furthermore, the growing emphasis on sustainable manufacturing practices and the increasing use of recycled aluminum alloys are becoming key differentiators. The market penetration rate for aluminum alloy wheels in new vehicle production is expected to climb from around 80% in the historical period to over 90% by the end of the forecast period. Opportunities abound for manufacturers capable of offering a balance of performance, aesthetics, cost-effectiveness, and environmental responsibility. The aftermarket segment also presents significant growth potential as vehicle owners seek upgrades for performance and visual appeal.
Dominant Markets & Segments in Automotive Aluminum Alloy Wheel
The Passenger Vehicle segment stands as the undisputed leader in the global automotive aluminum alloy wheel market, driven by consumer demand for enhanced aesthetics, improved fuel efficiency, and superior performance. In 2025, this segment is estimated to account for over 75% of the total market volume. The Asia-Pacific region, particularly China and India, is a dominant force, propelled by a burgeoning automotive manufacturing base and a rapidly growing middle class with increasing disposable income.
Passenger Vehicle Application Growth Drivers:
- Rising global vehicle production volumes, especially in emerging economies.
- Increasing consumer preference for aesthetically appealing and performance-enhancing wheel designs.
- The growing adoption of lightweight materials to improve fuel efficiency and reduce emissions in ICE vehicles.
- The significant growth of the electric vehicle (EV) market, where weight reduction is paramount for optimizing battery range.
- Stricter government regulations promoting fuel efficiency standards.
Casting Type Dominance: The Casting type of aluminum alloy wheel dominates the market due to its cost-effectiveness and versatility in producing complex designs. Low-pressure die casting and gravity die casting are prevalent methods, catering to a wide range of passenger vehicle applications. While forging offers superior strength, its higher cost limits its widespread adoption in mass-market passenger vehicles.
Regional Dominance: Asia-Pacific is anticipated to maintain its leading position, supported by extensive manufacturing capabilities and a massive domestic consumer base. North America and Europe follow, driven by premium vehicle segments and advancements in automotive technology.
Commercial Vehicle Segment Growth: The Commercial Vehicle segment, though smaller in market share compared to passenger vehicles, is experiencing steady growth. This is fueled by the demand for durable and lightweight wheels in trucks, buses, and vans to improve payload capacity and fuel economy. The increasing investment in logistics and transportation infrastructure globally also contributes to this segment's expansion.
Automotive Aluminum Alloy Wheel Product Analysis
Automotive aluminum alloy wheels are at the forefront of innovation, offering a compelling blend of lightweight construction, superior strength, and aesthetic appeal. Product innovations center on advanced manufacturing techniques like flow-forming and precision forging, which enable the creation of wheels with enhanced structural integrity and reduced weight. These advancements directly translate into improved vehicle fuel efficiency, better handling dynamics, and a more engaging driving experience. Competitive advantages are derived from the ability to cater to diverse OEM specifications and aftermarket demands for customization, performance upgrades, and distinctive styling. The market is witnessing a rise in multi-spoke designs, concave profiles, and the integration of intricate surface finishes, reflecting evolving consumer preferences and the pursuit of automotive personalization.
Key Drivers, Barriers & Challenges in Automotive Aluminum Alloy Wheel
Key Drivers: The automotive aluminum alloy wheel market is propelled by several key drivers. Technological advancements in casting and forging processes enable lighter and stronger wheels, directly impacting vehicle fuel efficiency and performance, crucial for meeting stringent emission standards. The growing global automotive production, particularly in emerging economies, fuels demand. Furthermore, the increasing popularity of electric vehicles necessitates lightweight components to maximize battery range. Economic growth and rising consumer disposable income contribute to the demand for premium and aesthetically enhanced wheels.
Key Barriers & Challenges: Supply chain disruptions, particularly concerning raw material availability and pricing volatility of aluminum, pose significant challenges. Stringent and evolving regulatory frameworks related to material composition, safety standards, and recycling mandates can impact manufacturing processes and costs. Intense competition from both established players and emerging manufacturers, coupled with pricing pressures, can affect profitability. The high initial investment required for advanced manufacturing technologies and R&D also presents a barrier for smaller players. For example, fluctuations in aluminum prices, which constitute a significant portion of the production cost, can lead to an estimated 5-10% swing in manufacturing costs.
Growth Drivers in the Automotive Aluminum Alloy Wheel Market
The growth of the automotive aluminum alloy wheel market is significantly driven by technological advancements in manufacturing, leading to lighter, stronger, and more fuel-efficient wheels. The increasing global automotive production, especially in rapidly developing economies, provides a substantial demand base. The escalating adoption of electric vehicles (EVs) is a pivotal growth catalyst, as the need for weight reduction to optimize battery range becomes paramount. Furthermore, evolving consumer preferences for enhanced vehicle aesthetics and performance are fueling the demand for premium aluminum alloy wheels in both the OEM and aftermarket segments. Supportive government policies aimed at improving fuel economy and reducing emissions indirectly bolster the market's growth trajectory.
Challenges Impacting Automotive Aluminum Alloy Wheel Growth
Several challenges are impacting the growth of the automotive aluminum alloy wheel market. The volatility in aluminum prices, a key raw material, can lead to unpredictable manufacturing costs and affect profit margins. Complex and evolving regulatory landscapes, particularly concerning environmental impact and safety standards, require continuous adaptation and investment in compliance. Supply chain vulnerabilities, including the availability of key raw materials and logistical complexities, can disrupt production and lead to delays. Intense competition among manufacturers, both domestic and international, can lead to pricing pressures and necessitate significant investment in innovation and marketing to maintain market share. The high capital expenditure required for advanced manufacturing technologies also presents a barrier to entry and expansion for some players.
Key Players Shaping the Automotive Aluminum Alloy Wheel Market
- Borbet
- Ronal Wheels
- Enkei Wheels
- Superior Industries
- Alcoa
- Iochpe-Maxion
- Uniwheel Group
- Accuride
- YHI International Limited
- Topy Group
- CITIC Dicastal
- Lizhong Group
- Wanfeng Auto
- Kunshan Liufeng
- Zhejiang Jinfei
- Yueling Wheels
- Zhongnan Aluminum Wheels
- Anchi Aluminum Wheel
- Guangdong Dcenti Auto-Parts
Significant Automotive Aluminum Alloy Wheel Industry Milestones
- 2019: Introduction of advanced flow-forming technologies enabling significantly lighter yet stronger wheel designs, boosting fuel efficiency in passenger vehicles.
- 2020: Increased focus on sustainable manufacturing practices, with a rise in the adoption of recycled aluminum alloys by major manufacturers.
- 2021: Significant M&A activity within the industry, with several consolidation efforts aimed at expanding market share and technological capabilities, e.g., CITIC Dicastal's strategic acquisitions.
- 2022: Growing integration of smart technologies, such as embedded tire pressure monitoring systems (TPMS), into aluminum alloy wheel designs for enhanced vehicle safety and performance.
- 2023: Launch of novel wheel designs catering to the rapidly expanding electric vehicle (EV) market, emphasizing aerodynamic efficiency and reduced weight.
- 2024: Heightened focus on customization and personalization trends, with manufacturers offering a wider array of finishes, colors, and spoke patterns for aftermarket applications.
Future Outlook for Automotive Aluminum Alloy Wheel Market
The future outlook for the automotive aluminum alloy wheel market is exceptionally promising, fueled by an ongoing commitment to lightweighting and performance enhancement in vehicles. The sustained growth of the global automotive industry, coupled with the accelerating transition towards electric mobility, will continue to drive demand for advanced aluminum alloy wheels. Manufacturers that prioritize innovation in material science, manufacturing efficiency, and sustainable production practices are poised for significant market expansion. Opportunities lie in developing smart wheels with integrated sensor technologies and catering to the increasing demand for customized and aesthetically superior wheel solutions. Strategic collaborations and technological advancements will be crucial in navigating market dynamics and capitalizing on the substantial growth potential anticipated in the coming years.
Automotive Aluminum Alloy Wheel Segmentation
-
1. Application
- 1.1. Passenger Vehicle
- 1.2. Commercial Vehicle
-
2. Types
- 2.1. Casting
- 2.2. Forging
- 2.3. Other
Automotive Aluminum Alloy Wheel Segmentation By Geography
-
1. North America
- 1.1. United States
- 1.2. Canada
- 1.3. Mexico
-
2. South America
- 2.1. Brazil
- 2.2. Argentina
- 2.3. Rest of South America
-
3. Europe
- 3.1. United Kingdom
- 3.2. Germany
- 3.3. France
- 3.4. Italy
- 3.5. Spain
- 3.6. Russia
- 3.7. Benelux
- 3.8. Nordics
- 3.9. Rest of Europe
-
4. Middle East & Africa
- 4.1. Turkey
- 4.2. Israel
- 4.3. GCC
- 4.4. North Africa
- 4.5. South Africa
- 4.6. Rest of Middle East & Africa
-
5. Asia Pacific
- 5.1. China
- 5.2. India
- 5.3. Japan
- 5.4. South Korea
- 5.5. ASEAN
- 5.6. Oceania
- 5.7. Rest of Asia Pacific
Automotive Aluminum Alloy Wheel Regional Market Share
Geographic Coverage of Automotive Aluminum Alloy Wheel
Automotive Aluminum Alloy Wheel REPORT HIGHLIGHTS
| Aspects | Details |
|---|---|
| Study Period | 2020-2034 |
| Base Year | 2025 |
| Estimated Year | 2026 |
| Forecast Period | 2026-2034 |
| Historical Period | 2020-2025 |
| Growth Rate | CAGR of 3.6% from 2020-2034 |
| Segmentation |
|
Table of Contents
- 1. Introduction
- 1.1. Research Scope
- 1.2. Market Segmentation
- 1.3. Research Methodology
- 1.4. Definitions and Assumptions
- 2. Executive Summary
- 2.1. Introduction
- 3. Market Dynamics
- 3.1. Introduction
- 3.2. Market Drivers
- 3.3. Market Restrains
- 3.4. Market Trends
- 4. Market Factor Analysis
- 4.1. Porters Five Forces
- 4.2. Supply/Value Chain
- 4.3. PESTEL analysis
- 4.4. Market Entropy
- 4.5. Patent/Trademark Analysis
- 5. Global Automotive Aluminum Alloy Wheel Analysis, Insights and Forecast, 2020-2032
- 5.1. Market Analysis, Insights and Forecast - by Application
- 5.1.1. Passenger Vehicle
- 5.1.2. Commercial Vehicle
- 5.2. Market Analysis, Insights and Forecast - by Types
- 5.2.1. Casting
- 5.2.2. Forging
- 5.2.3. Other
- 5.3. Market Analysis, Insights and Forecast - by Region
- 5.3.1. North America
- 5.3.2. South America
- 5.3.3. Europe
- 5.3.4. Middle East & Africa
- 5.3.5. Asia Pacific
- 5.1. Market Analysis, Insights and Forecast - by Application
- 6. North America Automotive Aluminum Alloy Wheel Analysis, Insights and Forecast, 2020-2032
- 6.1. Market Analysis, Insights and Forecast - by Application
- 6.1.1. Passenger Vehicle
- 6.1.2. Commercial Vehicle
- 6.2. Market Analysis, Insights and Forecast - by Types
- 6.2.1. Casting
- 6.2.2. Forging
- 6.2.3. Other
- 6.1. Market Analysis, Insights and Forecast - by Application
- 7. South America Automotive Aluminum Alloy Wheel Analysis, Insights and Forecast, 2020-2032
- 7.1. Market Analysis, Insights and Forecast - by Application
- 7.1.1. Passenger Vehicle
- 7.1.2. Commercial Vehicle
- 7.2. Market Analysis, Insights and Forecast - by Types
- 7.2.1. Casting
- 7.2.2. Forging
- 7.2.3. Other
- 7.1. Market Analysis, Insights and Forecast - by Application
- 8. Europe Automotive Aluminum Alloy Wheel Analysis, Insights and Forecast, 2020-2032
- 8.1. Market Analysis, Insights and Forecast - by Application
- 8.1.1. Passenger Vehicle
- 8.1.2. Commercial Vehicle
- 8.2. Market Analysis, Insights and Forecast - by Types
- 8.2.1. Casting
- 8.2.2. Forging
- 8.2.3. Other
- 8.1. Market Analysis, Insights and Forecast - by Application
- 9. Middle East & Africa Automotive Aluminum Alloy Wheel Analysis, Insights and Forecast, 2020-2032
- 9.1. Market Analysis, Insights and Forecast - by Application
- 9.1.1. Passenger Vehicle
- 9.1.2. Commercial Vehicle
- 9.2. Market Analysis, Insights and Forecast - by Types
- 9.2.1. Casting
- 9.2.2. Forging
- 9.2.3. Other
- 9.1. Market Analysis, Insights and Forecast - by Application
- 10. Asia Pacific Automotive Aluminum Alloy Wheel Analysis, Insights and Forecast, 2020-2032
- 10.1. Market Analysis, Insights and Forecast - by Application
- 10.1.1. Passenger Vehicle
- 10.1.2. Commercial Vehicle
- 10.2. Market Analysis, Insights and Forecast - by Types
- 10.2.1. Casting
- 10.2.2. Forging
- 10.2.3. Other
- 10.1. Market Analysis, Insights and Forecast - by Application
- 11. Competitive Analysis
- 11.1. Global Market Share Analysis 2025
- 11.2. Company Profiles
- 11.2.1 Borbet
- 11.2.1.1. Overview
- 11.2.1.2. Products
- 11.2.1.3. SWOT Analysis
- 11.2.1.4. Recent Developments
- 11.2.1.5. Financials (Based on Availability)
- 11.2.2 Ronal Wheels
- 11.2.2.1. Overview
- 11.2.2.2. Products
- 11.2.2.3. SWOT Analysis
- 11.2.2.4. Recent Developments
- 11.2.2.5. Financials (Based on Availability)
- 11.2.3 Enkei Wheels
- 11.2.3.1. Overview
- 11.2.3.2. Products
- 11.2.3.3. SWOT Analysis
- 11.2.3.4. Recent Developments
- 11.2.3.5. Financials (Based on Availability)
- 11.2.4 Superior Industries
- 11.2.4.1. Overview
- 11.2.4.2. Products
- 11.2.4.3. SWOT Analysis
- 11.2.4.4. Recent Developments
- 11.2.4.5. Financials (Based on Availability)
- 11.2.5 Alcoa
- 11.2.5.1. Overview
- 11.2.5.2. Products
- 11.2.5.3. SWOT Analysis
- 11.2.5.4. Recent Developments
- 11.2.5.5. Financials (Based on Availability)
- 11.2.6 Iochpe-Maxion
- 11.2.6.1. Overview
- 11.2.6.2. Products
- 11.2.6.3. SWOT Analysis
- 11.2.6.4. Recent Developments
- 11.2.6.5. Financials (Based on Availability)
- 11.2.7 Uniwheel Group
- 11.2.7.1. Overview
- 11.2.7.2. Products
- 11.2.7.3. SWOT Analysis
- 11.2.7.4. Recent Developments
- 11.2.7.5. Financials (Based on Availability)
- 11.2.8 Accuride
- 11.2.8.1. Overview
- 11.2.8.2. Products
- 11.2.8.3. SWOT Analysis
- 11.2.8.4. Recent Developments
- 11.2.8.5. Financials (Based on Availability)
- 11.2.9 YHI International Limited
- 11.2.9.1. Overview
- 11.2.9.2. Products
- 11.2.9.3. SWOT Analysis
- 11.2.9.4. Recent Developments
- 11.2.9.5. Financials (Based on Availability)
- 11.2.10 Topy Group
- 11.2.10.1. Overview
- 11.2.10.2. Products
- 11.2.10.3. SWOT Analysis
- 11.2.10.4. Recent Developments
- 11.2.10.5. Financials (Based on Availability)
- 11.2.11 CITIC Dicastal
- 11.2.11.1. Overview
- 11.2.11.2. Products
- 11.2.11.3. SWOT Analysis
- 11.2.11.4. Recent Developments
- 11.2.11.5. Financials (Based on Availability)
- 11.2.12 Lizhong Group
- 11.2.12.1. Overview
- 11.2.12.2. Products
- 11.2.12.3. SWOT Analysis
- 11.2.12.4. Recent Developments
- 11.2.12.5. Financials (Based on Availability)
- 11.2.13 Wanfeng Auto
- 11.2.13.1. Overview
- 11.2.13.2. Products
- 11.2.13.3. SWOT Analysis
- 11.2.13.4. Recent Developments
- 11.2.13.5. Financials (Based on Availability)
- 11.2.14 Kunshan Liufeng
- 11.2.14.1. Overview
- 11.2.14.2. Products
- 11.2.14.3. SWOT Analysis
- 11.2.14.4. Recent Developments
- 11.2.14.5. Financials (Based on Availability)
- 11.2.15 Zhejiang Jinfei
- 11.2.15.1. Overview
- 11.2.15.2. Products
- 11.2.15.3. SWOT Analysis
- 11.2.15.4. Recent Developments
- 11.2.15.5. Financials (Based on Availability)
- 11.2.16 Yueling Wheels
- 11.2.16.1. Overview
- 11.2.16.2. Products
- 11.2.16.3. SWOT Analysis
- 11.2.16.4. Recent Developments
- 11.2.16.5. Financials (Based on Availability)
- 11.2.17 Zhongnan Aluminum Wheels
- 11.2.17.1. Overview
- 11.2.17.2. Products
- 11.2.17.3. SWOT Analysis
- 11.2.17.4. Recent Developments
- 11.2.17.5. Financials (Based on Availability)
- 11.2.18 Anchi Aluminum Wheel
- 11.2.18.1. Overview
- 11.2.18.2. Products
- 11.2.18.3. SWOT Analysis
- 11.2.18.4. Recent Developments
- 11.2.18.5. Financials (Based on Availability)
- 11.2.19 Guangdong Dcenti Auto-Parts
- 11.2.19.1. Overview
- 11.2.19.2. Products
- 11.2.19.3. SWOT Analysis
- 11.2.19.4. Recent Developments
- 11.2.19.5. Financials (Based on Availability)
- 11.2.1 Borbet
List of Figures
- Figure 1: Global Automotive Aluminum Alloy Wheel Revenue Breakdown (million, %) by Region 2025 & 2033
- Figure 2: Global Automotive Aluminum Alloy Wheel Volume Breakdown (K, %) by Region 2025 & 2033
- Figure 3: North America Automotive Aluminum Alloy Wheel Revenue (million), by Application 2025 & 2033
- Figure 4: North America Automotive Aluminum Alloy Wheel Volume (K), by Application 2025 & 2033
- Figure 5: North America Automotive Aluminum Alloy Wheel Revenue Share (%), by Application 2025 & 2033
- Figure 6: North America Automotive Aluminum Alloy Wheel Volume Share (%), by Application 2025 & 2033
- Figure 7: North America Automotive Aluminum Alloy Wheel Revenue (million), by Types 2025 & 2033
- Figure 8: North America Automotive Aluminum Alloy Wheel Volume (K), by Types 2025 & 2033
- Figure 9: North America Automotive Aluminum Alloy Wheel Revenue Share (%), by Types 2025 & 2033
- Figure 10: North America Automotive Aluminum Alloy Wheel Volume Share (%), by Types 2025 & 2033
- Figure 11: North America Automotive Aluminum Alloy Wheel Revenue (million), by Country 2025 & 2033
- Figure 12: North America Automotive Aluminum Alloy Wheel Volume (K), by Country 2025 & 2033
- Figure 13: North America Automotive Aluminum Alloy Wheel Revenue Share (%), by Country 2025 & 2033
- Figure 14: North America Automotive Aluminum Alloy Wheel Volume Share (%), by Country 2025 & 2033
- Figure 15: South America Automotive Aluminum Alloy Wheel Revenue (million), by Application 2025 & 2033
- Figure 16: South America Automotive Aluminum Alloy Wheel Volume (K), by Application 2025 & 2033
- Figure 17: South America Automotive Aluminum Alloy Wheel Revenue Share (%), by Application 2025 & 2033
- Figure 18: South America Automotive Aluminum Alloy Wheel Volume Share (%), by Application 2025 & 2033
- Figure 19: South America Automotive Aluminum Alloy Wheel Revenue (million), by Types 2025 & 2033
- Figure 20: South America Automotive Aluminum Alloy Wheel Volume (K), by Types 2025 & 2033
- Figure 21: South America Automotive Aluminum Alloy Wheel Revenue Share (%), by Types 2025 & 2033
- Figure 22: South America Automotive Aluminum Alloy Wheel Volume Share (%), by Types 2025 & 2033
- Figure 23: South America Automotive Aluminum Alloy Wheel Revenue (million), by Country 2025 & 2033
- Figure 24: South America Automotive Aluminum Alloy Wheel Volume (K), by Country 2025 & 2033
- Figure 25: South America Automotive Aluminum Alloy Wheel Revenue Share (%), by Country 2025 & 2033
- Figure 26: South America Automotive Aluminum Alloy Wheel Volume Share (%), by Country 2025 & 2033
- Figure 27: Europe Automotive Aluminum Alloy Wheel Revenue (million), by Application 2025 & 2033
- Figure 28: Europe Automotive Aluminum Alloy Wheel Volume (K), by Application 2025 & 2033
- Figure 29: Europe Automotive Aluminum Alloy Wheel Revenue Share (%), by Application 2025 & 2033
- Figure 30: Europe Automotive Aluminum Alloy Wheel Volume Share (%), by Application 2025 & 2033
- Figure 31: Europe Automotive Aluminum Alloy Wheel Revenue (million), by Types 2025 & 2033
- Figure 32: Europe Automotive Aluminum Alloy Wheel Volume (K), by Types 2025 & 2033
- Figure 33: Europe Automotive Aluminum Alloy Wheel Revenue Share (%), by Types 2025 & 2033
- Figure 34: Europe Automotive Aluminum Alloy Wheel Volume Share (%), by Types 2025 & 2033
- Figure 35: Europe Automotive Aluminum Alloy Wheel Revenue (million), by Country 2025 & 2033
- Figure 36: Europe Automotive Aluminum Alloy Wheel Volume (K), by Country 2025 & 2033
- Figure 37: Europe Automotive Aluminum Alloy Wheel Revenue Share (%), by Country 2025 & 2033
- Figure 38: Europe Automotive Aluminum Alloy Wheel Volume Share (%), by Country 2025 & 2033
- Figure 39: Middle East & Africa Automotive Aluminum Alloy Wheel Revenue (million), by Application 2025 & 2033
- Figure 40: Middle East & Africa Automotive Aluminum Alloy Wheel Volume (K), by Application 2025 & 2033
- Figure 41: Middle East & Africa Automotive Aluminum Alloy Wheel Revenue Share (%), by Application 2025 & 2033
- Figure 42: Middle East & Africa Automotive Aluminum Alloy Wheel Volume Share (%), by Application 2025 & 2033
- Figure 43: Middle East & Africa Automotive Aluminum Alloy Wheel Revenue (million), by Types 2025 & 2033
- Figure 44: Middle East & Africa Automotive Aluminum Alloy Wheel Volume (K), by Types 2025 & 2033
- Figure 45: Middle East & Africa Automotive Aluminum Alloy Wheel Revenue Share (%), by Types 2025 & 2033
- Figure 46: Middle East & Africa Automotive Aluminum Alloy Wheel Volume Share (%), by Types 2025 & 2033
- Figure 47: Middle East & Africa Automotive Aluminum Alloy Wheel Revenue (million), by Country 2025 & 2033
- Figure 48: Middle East & Africa Automotive Aluminum Alloy Wheel Volume (K), by Country 2025 & 2033
- Figure 49: Middle East & Africa Automotive Aluminum Alloy Wheel Revenue Share (%), by Country 2025 & 2033
- Figure 50: Middle East & Africa Automotive Aluminum Alloy Wheel Volume Share (%), by Country 2025 & 2033
- Figure 51: Asia Pacific Automotive Aluminum Alloy Wheel Revenue (million), by Application 2025 & 2033
- Figure 52: Asia Pacific Automotive Aluminum Alloy Wheel Volume (K), by Application 2025 & 2033
- Figure 53: Asia Pacific Automotive Aluminum Alloy Wheel Revenue Share (%), by Application 2025 & 2033
- Figure 54: Asia Pacific Automotive Aluminum Alloy Wheel Volume Share (%), by Application 2025 & 2033
- Figure 55: Asia Pacific Automotive Aluminum Alloy Wheel Revenue (million), by Types 2025 & 2033
- Figure 56: Asia Pacific Automotive Aluminum Alloy Wheel Volume (K), by Types 2025 & 2033
- Figure 57: Asia Pacific Automotive Aluminum Alloy Wheel Revenue Share (%), by Types 2025 & 2033
- Figure 58: Asia Pacific Automotive Aluminum Alloy Wheel Volume Share (%), by Types 2025 & 2033
- Figure 59: Asia Pacific Automotive Aluminum Alloy Wheel Revenue (million), by Country 2025 & 2033
- Figure 60: Asia Pacific Automotive Aluminum Alloy Wheel Volume (K), by Country 2025 & 2033
- Figure 61: Asia Pacific Automotive Aluminum Alloy Wheel Revenue Share (%), by Country 2025 & 2033
- Figure 62: Asia Pacific Automotive Aluminum Alloy Wheel Volume Share (%), by Country 2025 & 2033
List of Tables
- Table 1: Global Automotive Aluminum Alloy Wheel Revenue million Forecast, by Application 2020 & 2033
- Table 2: Global Automotive Aluminum Alloy Wheel Volume K Forecast, by Application 2020 & 2033
- Table 3: Global Automotive Aluminum Alloy Wheel Revenue million Forecast, by Types 2020 & 2033
- Table 4: Global Automotive Aluminum Alloy Wheel Volume K Forecast, by Types 2020 & 2033
- Table 5: Global Automotive Aluminum Alloy Wheel Revenue million Forecast, by Region 2020 & 2033
- Table 6: Global Automotive Aluminum Alloy Wheel Volume K Forecast, by Region 2020 & 2033
- Table 7: Global Automotive Aluminum Alloy Wheel Revenue million Forecast, by Application 2020 & 2033
- Table 8: Global Automotive Aluminum Alloy Wheel Volume K Forecast, by Application 2020 & 2033
- Table 9: Global Automotive Aluminum Alloy Wheel Revenue million Forecast, by Types 2020 & 2033
- Table 10: Global Automotive Aluminum Alloy Wheel Volume K Forecast, by Types 2020 & 2033
- Table 11: Global Automotive Aluminum Alloy Wheel Revenue million Forecast, by Country 2020 & 2033
- Table 12: Global Automotive Aluminum Alloy Wheel Volume K Forecast, by Country 2020 & 2033
- Table 13: United States Automotive Aluminum Alloy Wheel Revenue (million) Forecast, by Application 2020 & 2033
- Table 14: United States Automotive Aluminum Alloy Wheel Volume (K) Forecast, by Application 2020 & 2033
- Table 15: Canada Automotive Aluminum Alloy Wheel Revenue (million) Forecast, by Application 2020 & 2033
- Table 16: Canada Automotive Aluminum Alloy Wheel Volume (K) Forecast, by Application 2020 & 2033
- Table 17: Mexico Automotive Aluminum Alloy Wheel Revenue (million) Forecast, by Application 2020 & 2033
- Table 18: Mexico Automotive Aluminum Alloy Wheel Volume (K) Forecast, by Application 2020 & 2033
- Table 19: Global Automotive Aluminum Alloy Wheel Revenue million Forecast, by Application 2020 & 2033
- Table 20: Global Automotive Aluminum Alloy Wheel Volume K Forecast, by Application 2020 & 2033
- Table 21: Global Automotive Aluminum Alloy Wheel Revenue million Forecast, by Types 2020 & 2033
- Table 22: Global Automotive Aluminum Alloy Wheel Volume K Forecast, by Types 2020 & 2033
- Table 23: Global Automotive Aluminum Alloy Wheel Revenue million Forecast, by Country 2020 & 2033
- Table 24: Global Automotive Aluminum Alloy Wheel Volume K Forecast, by Country 2020 & 2033
- Table 25: Brazil Automotive Aluminum Alloy Wheel Revenue (million) Forecast, by Application 2020 & 2033
- Table 26: Brazil Automotive Aluminum Alloy Wheel Volume (K) Forecast, by Application 2020 & 2033
- Table 27: Argentina Automotive Aluminum Alloy Wheel Revenue (million) Forecast, by Application 2020 & 2033
- Table 28: Argentina Automotive Aluminum Alloy Wheel Volume (K) Forecast, by Application 2020 & 2033
- Table 29: Rest of South America Automotive Aluminum Alloy Wheel Revenue (million) Forecast, by Application 2020 & 2033
- Table 30: Rest of South America Automotive Aluminum Alloy Wheel Volume (K) Forecast, by Application 2020 & 2033
- Table 31: Global Automotive Aluminum Alloy Wheel Revenue million Forecast, by Application 2020 & 2033
- Table 32: Global Automotive Aluminum Alloy Wheel Volume K Forecast, by Application 2020 & 2033
- Table 33: Global Automotive Aluminum Alloy Wheel Revenue million Forecast, by Types 2020 & 2033
- Table 34: Global Automotive Aluminum Alloy Wheel Volume K Forecast, by Types 2020 & 2033
- Table 35: Global Automotive Aluminum Alloy Wheel Revenue million Forecast, by Country 2020 & 2033
- Table 36: Global Automotive Aluminum Alloy Wheel Volume K Forecast, by Country 2020 & 2033
- Table 37: United Kingdom Automotive Aluminum Alloy Wheel Revenue (million) Forecast, by Application 2020 & 2033
- Table 38: United Kingdom Automotive Aluminum Alloy Wheel Volume (K) Forecast, by Application 2020 & 2033
- Table 39: Germany Automotive Aluminum Alloy Wheel Revenue (million) Forecast, by Application 2020 & 2033
- Table 40: Germany Automotive Aluminum Alloy Wheel Volume (K) Forecast, by Application 2020 & 2033
- Table 41: France Automotive Aluminum Alloy Wheel Revenue (million) Forecast, by Application 2020 & 2033
- Table 42: France Automotive Aluminum Alloy Wheel Volume (K) Forecast, by Application 2020 & 2033
- Table 43: Italy Automotive Aluminum Alloy Wheel Revenue (million) Forecast, by Application 2020 & 2033
- Table 44: Italy Automotive Aluminum Alloy Wheel Volume (K) Forecast, by Application 2020 & 2033
- Table 45: Spain Automotive Aluminum Alloy Wheel Revenue (million) Forecast, by Application 2020 & 2033
- Table 46: Spain Automotive Aluminum Alloy Wheel Volume (K) Forecast, by Application 2020 & 2033
- Table 47: Russia Automotive Aluminum Alloy Wheel Revenue (million) Forecast, by Application 2020 & 2033
- Table 48: Russia Automotive Aluminum Alloy Wheel Volume (K) Forecast, by Application 2020 & 2033
- Table 49: Benelux Automotive Aluminum Alloy Wheel Revenue (million) Forecast, by Application 2020 & 2033
- Table 50: Benelux Automotive Aluminum Alloy Wheel Volume (K) Forecast, by Application 2020 & 2033
- Table 51: Nordics Automotive Aluminum Alloy Wheel Revenue (million) Forecast, by Application 2020 & 2033
- Table 52: Nordics Automotive Aluminum Alloy Wheel Volume (K) Forecast, by Application 2020 & 2033
- Table 53: Rest of Europe Automotive Aluminum Alloy Wheel Revenue (million) Forecast, by Application 2020 & 2033
- Table 54: Rest of Europe Automotive Aluminum Alloy Wheel Volume (K) Forecast, by Application 2020 & 2033
- Table 55: Global Automotive Aluminum Alloy Wheel Revenue million Forecast, by Application 2020 & 2033
- Table 56: Global Automotive Aluminum Alloy Wheel Volume K Forecast, by Application 2020 & 2033
- Table 57: Global Automotive Aluminum Alloy Wheel Revenue million Forecast, by Types 2020 & 2033
- Table 58: Global Automotive Aluminum Alloy Wheel Volume K Forecast, by Types 2020 & 2033
- Table 59: Global Automotive Aluminum Alloy Wheel Revenue million Forecast, by Country 2020 & 2033
- Table 60: Global Automotive Aluminum Alloy Wheel Volume K Forecast, by Country 2020 & 2033
- Table 61: Turkey Automotive Aluminum Alloy Wheel Revenue (million) Forecast, by Application 2020 & 2033
- Table 62: Turkey Automotive Aluminum Alloy Wheel Volume (K) Forecast, by Application 2020 & 2033
- Table 63: Israel Automotive Aluminum Alloy Wheel Revenue (million) Forecast, by Application 2020 & 2033
- Table 64: Israel Automotive Aluminum Alloy Wheel Volume (K) Forecast, by Application 2020 & 2033
- Table 65: GCC Automotive Aluminum Alloy Wheel Revenue (million) Forecast, by Application 2020 & 2033
- Table 66: GCC Automotive Aluminum Alloy Wheel Volume (K) Forecast, by Application 2020 & 2033
- Table 67: North Africa Automotive Aluminum Alloy Wheel Revenue (million) Forecast, by Application 2020 & 2033
- Table 68: North Africa Automotive Aluminum Alloy Wheel Volume (K) Forecast, by Application 2020 & 2033
- Table 69: South Africa Automotive Aluminum Alloy Wheel Revenue (million) Forecast, by Application 2020 & 2033
- Table 70: South Africa Automotive Aluminum Alloy Wheel Volume (K) Forecast, by Application 2020 & 2033
- Table 71: Rest of Middle East & Africa Automotive Aluminum Alloy Wheel Revenue (million) Forecast, by Application 2020 & 2033
- Table 72: Rest of Middle East & Africa Automotive Aluminum Alloy Wheel Volume (K) Forecast, by Application 2020 & 2033
- Table 73: Global Automotive Aluminum Alloy Wheel Revenue million Forecast, by Application 2020 & 2033
- Table 74: Global Automotive Aluminum Alloy Wheel Volume K Forecast, by Application 2020 & 2033
- Table 75: Global Automotive Aluminum Alloy Wheel Revenue million Forecast, by Types 2020 & 2033
- Table 76: Global Automotive Aluminum Alloy Wheel Volume K Forecast, by Types 2020 & 2033
- Table 77: Global Automotive Aluminum Alloy Wheel Revenue million Forecast, by Country 2020 & 2033
- Table 78: Global Automotive Aluminum Alloy Wheel Volume K Forecast, by Country 2020 & 2033
- Table 79: China Automotive Aluminum Alloy Wheel Revenue (million) Forecast, by Application 2020 & 2033
- Table 80: China Automotive Aluminum Alloy Wheel Volume (K) Forecast, by Application 2020 & 2033
- Table 81: India Automotive Aluminum Alloy Wheel Revenue (million) Forecast, by Application 2020 & 2033
- Table 82: India Automotive Aluminum Alloy Wheel Volume (K) Forecast, by Application 2020 & 2033
- Table 83: Japan Automotive Aluminum Alloy Wheel Revenue (million) Forecast, by Application 2020 & 2033
- Table 84: Japan Automotive Aluminum Alloy Wheel Volume (K) Forecast, by Application 2020 & 2033
- Table 85: South Korea Automotive Aluminum Alloy Wheel Revenue (million) Forecast, by Application 2020 & 2033
- Table 86: South Korea Automotive Aluminum Alloy Wheel Volume (K) Forecast, by Application 2020 & 2033
- Table 87: ASEAN Automotive Aluminum Alloy Wheel Revenue (million) Forecast, by Application 2020 & 2033
- Table 88: ASEAN Automotive Aluminum Alloy Wheel Volume (K) Forecast, by Application 2020 & 2033
- Table 89: Oceania Automotive Aluminum Alloy Wheel Revenue (million) Forecast, by Application 2020 & 2033
- Table 90: Oceania Automotive Aluminum Alloy Wheel Volume (K) Forecast, by Application 2020 & 2033
- Table 91: Rest of Asia Pacific Automotive Aluminum Alloy Wheel Revenue (million) Forecast, by Application 2020 & 2033
- Table 92: Rest of Asia Pacific Automotive Aluminum Alloy Wheel Volume (K) Forecast, by Application 2020 & 2033
Frequently Asked Questions
1. What is the projected Compound Annual Growth Rate (CAGR) of the Automotive Aluminum Alloy Wheel?
The projected CAGR is approximately 3.6%.
2. Which companies are prominent players in the Automotive Aluminum Alloy Wheel?
Key companies in the market include Borbet, Ronal Wheels, Enkei Wheels, Superior Industries, Alcoa, Iochpe-Maxion, Uniwheel Group, Accuride, YHI International Limited, Topy Group, CITIC Dicastal, Lizhong Group, Wanfeng Auto, Kunshan Liufeng, Zhejiang Jinfei, Yueling Wheels, Zhongnan Aluminum Wheels, Anchi Aluminum Wheel, Guangdong Dcenti Auto-Parts.
3. What are the main segments of the Automotive Aluminum Alloy Wheel?
The market segments include Application, Types.
4. Can you provide details about the market size?
The market size is estimated to be USD 14570 million as of 2022.
5. What are some drivers contributing to market growth?
N/A
6. What are the notable trends driving market growth?
N/A
7. Are there any restraints impacting market growth?
N/A
8. Can you provide examples of recent developments in the market?
N/A
9. What pricing options are available for accessing the report?
Pricing options include single-user, multi-user, and enterprise licenses priced at USD 3950.00, USD 5925.00, and USD 7900.00 respectively.
10. Is the market size provided in terms of value or volume?
The market size is provided in terms of value, measured in million and volume, measured in K.
11. Are there any specific market keywords associated with the report?
Yes, the market keyword associated with the report is "Automotive Aluminum Alloy Wheel," which aids in identifying and referencing the specific market segment covered.
12. How do I determine which pricing option suits my needs best?
The pricing options vary based on user requirements and access needs. Individual users may opt for single-user licenses, while businesses requiring broader access may choose multi-user or enterprise licenses for cost-effective access to the report.
13. Are there any additional resources or data provided in the Automotive Aluminum Alloy Wheel report?
While the report offers comprehensive insights, it's advisable to review the specific contents or supplementary materials provided to ascertain if additional resources or data are available.
14. How can I stay updated on further developments or reports in the Automotive Aluminum Alloy Wheel?
To stay informed about further developments, trends, and reports in the Automotive Aluminum Alloy Wheel, consider subscribing to industry newsletters, following relevant companies and organizations, or regularly checking reputable industry news sources and publications.
Methodology
Step 1 - Identification of Relevant Samples Size from Population Database


Step 2 - Approaches for Defining Global Market Size (Value, Volume* & Price*)

Note*: In applicable scenarios
Step 3 - Data Sources
Primary Research
- Web Analytics
- Survey Reports
- Research Institute
- Latest Research Reports
- Opinion Leaders
Secondary Research
- Annual Reports
- White Paper
- Latest Press Release
- Industry Association
- Paid Database
- Investor Presentations

Step 4 - Data Triangulation
Involves using different sources of information in order to increase the validity of a study
These sources are likely to be stakeholders in a program - participants, other researchers, program staff, other community members, and so on.
Then we put all data in single framework & apply various statistical tools to find out the dynamic on the market.
During the analysis stage, feedback from the stakeholder groups would be compared to determine areas of agreement as well as areas of divergence