

Key Insights
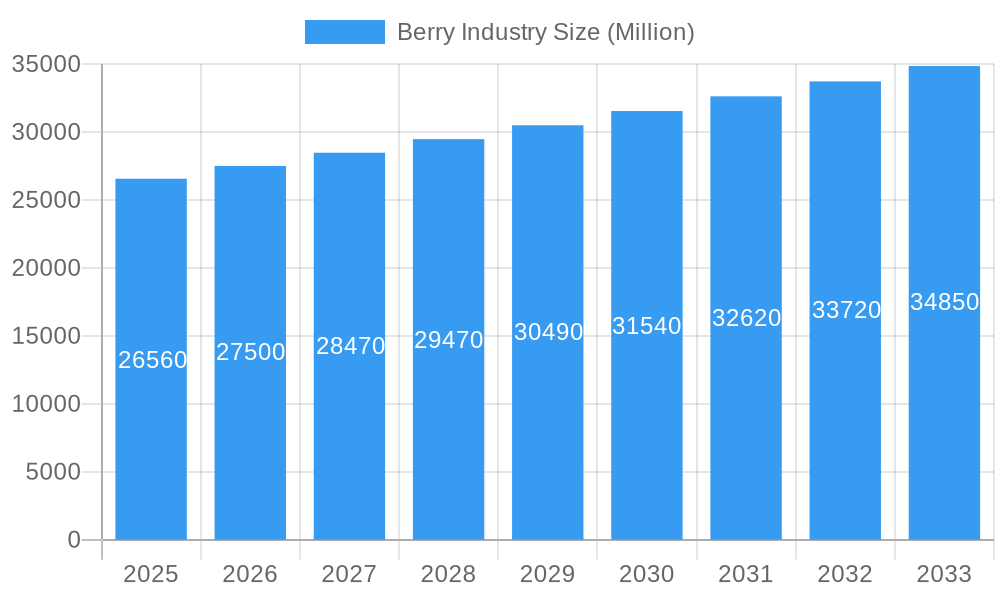
The global berry industry, valued at $26.56 billion in 2025, is projected to experience robust growth, driven by increasing consumer demand for healthy and convenient food options. The rising popularity of berries in various applications, including fresh consumption, frozen products, and processed foods and beverages, fuels market expansion. Health consciousness, coupled with the abundance of antioxidants and vitamins in berries, is a key driver. The food and beverage industry remains the largest application segment, utilizing berries in jams, juices, yogurt, and other products. However, the retail sector is also experiencing significant growth, with increasing sales of fresh and frozen berries in supermarkets and specialty stores. Further growth is anticipated from the healthcare sector, with berries increasingly incorporated into functional foods and supplements. Geographical expansion, particularly in developing economies with rising disposable incomes and changing dietary habits, presents substantial opportunities. While challenges such as seasonal production, perishability issues, and price fluctuations exist, innovative preservation techniques and supply chain management strategies are mitigating these risks. The competitive landscape is characterized by both large multinational corporations and smaller, regional producers, all vying for market share through product differentiation, brand building, and strategic partnerships. Frozen berries are anticipated to gain popularity due to longer shelf life and convenience.
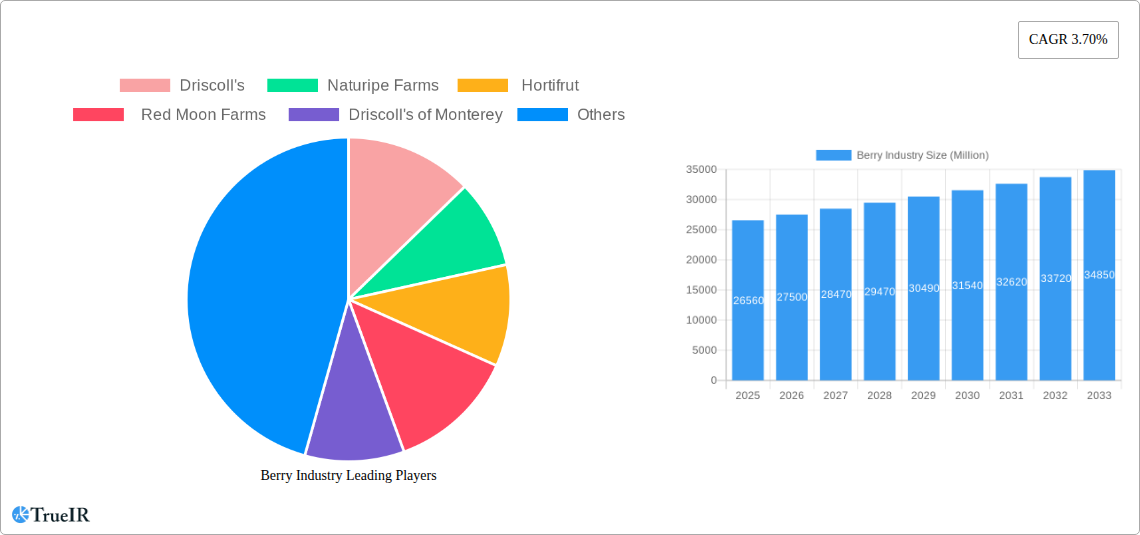
Berry Industry Market Size (In Billion)
The projected Compound Annual Growth Rate (CAGR) of 3.70% from 2025 to 2033 suggests a steadily expanding market. Regional variations exist, with North America and Europe currently holding significant market shares. However, the Asia-Pacific region is anticipated to show substantial growth in the coming years, propelled by increasing urbanization and a growing middle class. The industry is constantly innovating to meet evolving consumer preferences. This includes the development of new berry varieties with enhanced flavor and nutritional profiles, as well as the exploration of sustainable farming practices to address environmental concerns. The incorporation of berries into new product formats, such as ready-to-eat snacks and functional beverages, is further driving market growth. The overall outlook for the berry industry remains positive, indicating substantial growth potential in the coming years.
Berry Industry Company Market Share
This comprehensive report provides a detailed analysis of the global berry industry, encompassing market size, trends, competitive landscape, and future outlook. With a study period spanning 2019-2033, a base year of 2025, and a forecast period of 2025-2033, this report offers invaluable insights for industry stakeholders, investors, and researchers. The report analyzes the multi-billion dollar market, projecting significant growth across various segments including fresh, frozen, dried berries, and processed berry products for applications in the Food and Beverage Industry, Retail, and Healthcare sectors. Key players like Driscoll's, Naturipe Farms, Hortifrut, Red Moon Farms, and Driscoll's of Monterey are analyzed in detail.
Berry Industry Market Structure & Competitive Landscape
The global berry industry is characterized by a moderately concentrated market structure, with a few large players holding significant market share. The Herfindahl-Hirschman Index (HHI) for the industry is estimated at xx, indicating a moderately competitive landscape. However, increasing consolidation through mergers and acquisitions (M&A) activities is observed. The estimated volume of M&A deals in the industry during the historical period (2019-2024) was approximately xx Million USD. This trend is driven by the need to enhance economies of scale, expand product portfolios, and access new markets. Innovation plays a significant role, with companies continuously investing in research and development (R&D) to create novel berry varieties, improve cultivation techniques, and develop value-added products. The regulatory landscape significantly impacts the industry, particularly concerning food safety standards, pesticide usage, and labeling requirements. Product substitutes, such as other fruits and fruit-based products, pose a competitive challenge, necessitating continuous improvement in product quality and differentiation.
- Market Concentration: Moderate, with HHI estimated at xx.
- Innovation Drivers: R&D in new varieties, cultivation techniques, and value-added products.
- Regulatory Impacts: Food safety standards, pesticide use, and labeling regulations.
- Product Substitutes: Other fruits and fruit-based products.
- End-User Segmentation: Dominated by Food and Beverage, Retail, and Healthcare sectors.
- M&A Trends: Significant activity, totaling approximately xx Million USD (2019-2024).
Berry Industry Market Trends & Opportunities
The global berry industry exhibits robust growth, driven by rising consumer demand for healthy and convenient food options. The market size is estimated to reach xx Million USD in 2025, with a projected Compound Annual Growth Rate (CAGR) of xx% during the forecast period (2025-2033). This growth is fueled by several factors, including increasing disposable incomes in emerging economies, changing consumer preferences towards nutritious snacks, and the rising popularity of berry-based products in various applications. Technological advancements in agricultural practices, such as precision farming and automation, enhance productivity and efficiency. The increasing adoption of e-commerce platforms also contributes to market expansion. However, the industry faces challenges such as seasonal fluctuations in supply, vulnerability to climatic changes, and intense competition. Premiumization of products and expansion into new markets present significant opportunities for industry players. Market penetration rates of various berry types vary greatly by region and application, with fresh berries retaining the highest share.
Dominant Markets & Segments in Berry Industry
The North American region dominates the global berry market, driven by strong consumer demand, advanced agricultural practices, and well-established distribution networks. Within North America, the United States and Canada are the leading countries.
Key Growth Drivers:
- Advanced Agricultural Practices: Increased adoption of precision agriculture and automation leading to higher yield and efficiency.
- Strong Consumer Demand: High demand for healthy and convenient snacks driving berry consumption.
- Well-Established Distribution Network: Efficient supply chain enabling easy access for consumers.
Dominant Segments:
The fresh berry segment constitutes the largest share of the market, followed by frozen berries. The food and beverage industry is the major application segment, driven by the use of berries in various products such as jams, jellies, juices, and yogurts. The retail segment exhibits strong growth, driven by increasing demand for convenient packaged berry products. Growth in the healthcare segment is fueled by the recognition of berries' health benefits.
Berry Industry Product Analysis
Product innovation is a key driver of growth in the berry industry. Companies are constantly developing new berry varieties with improved flavor, texture, and shelf life. Technological advancements in processing and packaging technologies enable the creation of innovative berry-based products, catering to diverse consumer preferences and needs. The focus on premiumization and differentiation plays a crucial role in enhancing competitiveness. Examples include the introduction of Driscoll's Tropical Bliss strawberry line and Naturipe Farm's Sweet Selections premium berries. These new product offerings cater to the demand for high-quality, flavorful berries.
Key Drivers, Barriers & Challenges in Berry Industry
Key Drivers:
- Rising Consumer Demand for Healthy Foods: Growing awareness of the health benefits of berries drives consumption.
- Technological Advancements in Agriculture: Precision farming techniques enhance efficiency and yield.
- Expansion into New Markets: Emerging economies present significant growth opportunities.
Challenges:
- Supply Chain Disruptions: Fluctuations in weather patterns and logistical issues can impact availability.
- Regulatory Hurdles: Stringent food safety and labeling regulations impose costs on businesses.
- Intense Competition: A large number of players makes for a fiercely competitive market, requiring companies to continuously innovate and differentiate. The impact of these factors is a xx% reduction in market share for smaller players annually.
Growth Drivers in the Berry Industry Market
The berry industry's growth is fueled by increasing consumer demand for healthy and convenient foods, advancements in agricultural technologies, and expansion into new and emerging markets. The rising awareness of berries’ health benefits contributes significantly to their popularity. Technological advancements in cultivation, processing, and packaging are crucial in improving efficiency and enhancing product quality. Favorable government policies and support for agricultural development play a supportive role in boosting market growth.
Challenges Impacting Berry Industry Growth
Challenges include seasonal fluctuations in berry production, vulnerability to extreme weather events, and supply chain disruptions. Stringent regulatory requirements relating to food safety and pesticide usage increase compliance costs. Intense competition among various players and the emergence of substitutes put pressure on profit margins. These challenges can significantly impact the growth trajectory of the berry industry if not effectively managed.
Key Players Shaping the Berry Industry Market
- Driscoll's
- Naturipe Farms
- Hortifrut
- Red Moon Farms
- Driscoll's of Monterey
Significant Berry Industry Milestones
- May 2022: Driscoll's launched Tropical Bliss, a new premium strawberry line.
- October 2023: Naturipe Farms launched the “Sweet Selections” premium berries line.
Future Outlook for Berry Industry Market
The berry industry is poised for continued growth, driven by persistent consumer demand, technological advancements, and strategic expansion into new markets. Opportunities lie in product diversification, premiumization, and value-added product development. Companies focusing on sustainable farming practices and adopting innovative technologies will be well-positioned to capitalize on the industry's long-term growth potential. The market is expected to continue its expansion into new regions and applications, driving further growth and innovation.
Berry Industry Segmentation
- 1. Production Analysis
- 2. Consumption Analysis
- 3. Import Market Analysis (Value & Volume)
- 4. Export Market Analysis (Value & Volume)
- 5. Price Trend Analysis
Berry Industry Segmentation By Geography
-
1. North America
- 1.1. United States
- 1.2. Canada
-
2. Europe
- 2.1. Germany
- 2.2. United Kingdom
- 2.3. France
- 2.4. Spain
- 2.5. Netherlands
- 2.6. Poland
-
3. Asia Pacific
- 3.1. China
- 3.2. Australia
- 3.3. India
- 3.4. Japan
-
4. South America
- 4.1. Brazil
- 4.2. Argentina
-
5. Africa
- 5.1. South Africa
- 5.2. Egypt
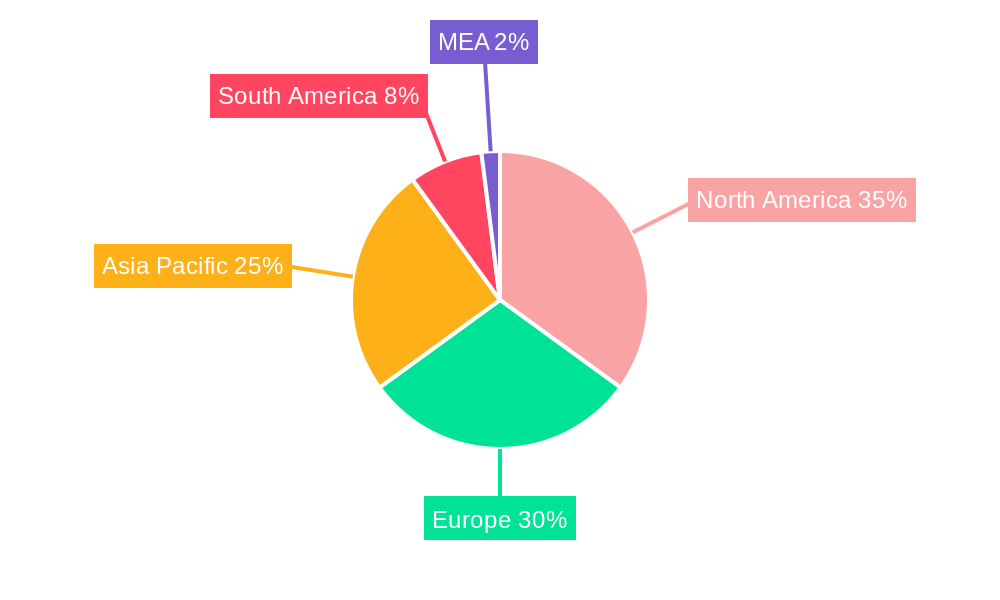
Berry Industry Regional Market Share
Geographic Coverage of Berry Industry
Berry Industry REPORT HIGHLIGHTS
| Aspects | Details |
|---|---|
| Study Period | 2020-2034 |
| Base Year | 2025 |
| Estimated Year | 2026 |
| Forecast Period | 2026-2034 |
| Historical Period | 2020-2025 |
| Growth Rate | CAGR of 3.70% from 2020-2034 |
| Segmentation |
|
Table of Contents
- 1. Introduction
- 1.1. Research Scope
- 1.2. Market Segmentation
- 1.3. Research Methodology
- 1.4. Definitions and Assumptions
- 2. Executive Summary
- 2.1. Introduction
- 3. Market Dynamics
- 3.1. Introduction
- 3.2. Market Drivers
- 3.2.1. Increasing Berry Consumption for Health Benefits; Increasing Adoption of High-Technology Farm Practices; Growing Usage of Berries in the Food and Beverage Industries
- 3.3. Market Restrains
- 3.3.1. High Production Cost Involved in Berry Production; Increasing Disease and Pest Infestations
- 3.4. Market Trends
- 3.4.1. Increasing Export of Berries from United States is Driving the Market
- 4. Market Factor Analysis
- 4.1. Porters Five Forces
- 4.2. Supply/Value Chain
- 4.3. PESTEL analysis
- 4.4. Market Entropy
- 4.5. Patent/Trademark Analysis
- 5. Global Berry Industry Analysis, Insights and Forecast, 2020-2032
- 5.1. Market Analysis, Insights and Forecast - by Production Analysis
- 5.2. Market Analysis, Insights and Forecast - by Consumption Analysis
- 5.3. Market Analysis, Insights and Forecast - by Import Market Analysis (Value & Volume)
- 5.4. Market Analysis, Insights and Forecast - by Export Market Analysis (Value & Volume)
- 5.5. Market Analysis, Insights and Forecast - by Price Trend Analysis
- 5.6. Market Analysis, Insights and Forecast - by Region
- 5.6.1. North America
- 5.6.2. Europe
- 5.6.3. Asia Pacific
- 5.6.4. South America
- 5.6.5. Africa
- 5.1. Market Analysis, Insights and Forecast - by Production Analysis
- 6. North America Berry Industry Analysis, Insights and Forecast, 2020-2032
- 6.1. Market Analysis, Insights and Forecast - by Production Analysis
- 6.2. Market Analysis, Insights and Forecast - by Consumption Analysis
- 6.3. Market Analysis, Insights and Forecast - by Import Market Analysis (Value & Volume)
- 6.4. Market Analysis, Insights and Forecast - by Export Market Analysis (Value & Volume)
- 6.5. Market Analysis, Insights and Forecast - by Price Trend Analysis
- 6.1. Market Analysis, Insights and Forecast - by Production Analysis
- 7. Europe Berry Industry Analysis, Insights and Forecast, 2020-2032
- 7.1. Market Analysis, Insights and Forecast - by Production Analysis
- 7.2. Market Analysis, Insights and Forecast - by Consumption Analysis
- 7.3. Market Analysis, Insights and Forecast - by Import Market Analysis (Value & Volume)
- 7.4. Market Analysis, Insights and Forecast - by Export Market Analysis (Value & Volume)
- 7.5. Market Analysis, Insights and Forecast - by Price Trend Analysis
- 7.1. Market Analysis, Insights and Forecast - by Production Analysis
- 8. Asia Pacific Berry Industry Analysis, Insights and Forecast, 2020-2032
- 8.1. Market Analysis, Insights and Forecast - by Production Analysis
- 8.2. Market Analysis, Insights and Forecast - by Consumption Analysis
- 8.3. Market Analysis, Insights and Forecast - by Import Market Analysis (Value & Volume)
- 8.4. Market Analysis, Insights and Forecast - by Export Market Analysis (Value & Volume)
- 8.5. Market Analysis, Insights and Forecast - by Price Trend Analysis
- 8.1. Market Analysis, Insights and Forecast - by Production Analysis
- 9. South America Berry Industry Analysis, Insights and Forecast, 2020-2032
- 9.1. Market Analysis, Insights and Forecast - by Production Analysis
- 9.2. Market Analysis, Insights and Forecast - by Consumption Analysis
- 9.3. Market Analysis, Insights and Forecast - by Import Market Analysis (Value & Volume)
- 9.4. Market Analysis, Insights and Forecast - by Export Market Analysis (Value & Volume)
- 9.5. Market Analysis, Insights and Forecast - by Price Trend Analysis
- 9.1. Market Analysis, Insights and Forecast - by Production Analysis
- 10. Africa Berry Industry Analysis, Insights and Forecast, 2020-2032
- 10.1. Market Analysis, Insights and Forecast - by Production Analysis
- 10.2. Market Analysis, Insights and Forecast - by Consumption Analysis
- 10.3. Market Analysis, Insights and Forecast - by Import Market Analysis (Value & Volume)
- 10.4. Market Analysis, Insights and Forecast - by Export Market Analysis (Value & Volume)
- 10.5. Market Analysis, Insights and Forecast - by Price Trend Analysis
- 10.1. Market Analysis, Insights and Forecast - by Production Analysis
- 11. Competitive Analysis
- 11.1. Global Market Share Analysis 2025
- 11.2. Company Profiles
- 11.2.1 Driscoll's
- 11.2.1.1. Overview
- 11.2.1.2. Products
- 11.2.1.3. SWOT Analysis
- 11.2.1.4. Recent Developments
- 11.2.1.5. Financials (Based on Availability)
- 11.2.2 Naturipe Farms
- 11.2.2.1. Overview
- 11.2.2.2. Products
- 11.2.2.3. SWOT Analysis
- 11.2.2.4. Recent Developments
- 11.2.2.5. Financials (Based on Availability)
- 11.2.3 Hortifrut
- 11.2.3.1. Overview
- 11.2.3.2. Products
- 11.2.3.3. SWOT Analysis
- 11.2.3.4. Recent Developments
- 11.2.3.5. Financials (Based on Availability)
- 11.2.4 Red Moon Farms
- 11.2.4.1. Overview
- 11.2.4.2. Products
- 11.2.4.3. SWOT Analysis
- 11.2.4.4. Recent Developments
- 11.2.4.5. Financials (Based on Availability)
- 11.2.5 Driscoll's of Monterey
- 11.2.5.1. Overview
- 11.2.5.2. Products
- 11.2.5.3. SWOT Analysis
- 11.2.5.4. Recent Developments
- 11.2.5.5. Financials (Based on Availability)
- 11.2.1 Driscoll's
List of Figures
- Figure 1: Global Berry Industry Revenue Breakdown (Million, %) by Region 2025 & 2033
- Figure 2: North America Berry Industry Revenue (Million), by Production Analysis 2025 & 2033
- Figure 3: North America Berry Industry Revenue Share (%), by Production Analysis 2025 & 2033
- Figure 4: North America Berry Industry Revenue (Million), by Consumption Analysis 2025 & 2033
- Figure 5: North America Berry Industry Revenue Share (%), by Consumption Analysis 2025 & 2033
- Figure 6: North America Berry Industry Revenue (Million), by Import Market Analysis (Value & Volume) 2025 & 2033
- Figure 7: North America Berry Industry Revenue Share (%), by Import Market Analysis (Value & Volume) 2025 & 2033
- Figure 8: North America Berry Industry Revenue (Million), by Export Market Analysis (Value & Volume) 2025 & 2033
- Figure 9: North America Berry Industry Revenue Share (%), by Export Market Analysis (Value & Volume) 2025 & 2033
- Figure 10: North America Berry Industry Revenue (Million), by Price Trend Analysis 2025 & 2033
- Figure 11: North America Berry Industry Revenue Share (%), by Price Trend Analysis 2025 & 2033
- Figure 12: North America Berry Industry Revenue (Million), by Country 2025 & 2033
- Figure 13: North America Berry Industry Revenue Share (%), by Country 2025 & 2033
- Figure 14: Europe Berry Industry Revenue (Million), by Production Analysis 2025 & 2033
- Figure 15: Europe Berry Industry Revenue Share (%), by Production Analysis 2025 & 2033
- Figure 16: Europe Berry Industry Revenue (Million), by Consumption Analysis 2025 & 2033
- Figure 17: Europe Berry Industry Revenue Share (%), by Consumption Analysis 2025 & 2033
- Figure 18: Europe Berry Industry Revenue (Million), by Import Market Analysis (Value & Volume) 2025 & 2033
- Figure 19: Europe Berry Industry Revenue Share (%), by Import Market Analysis (Value & Volume) 2025 & 2033
- Figure 20: Europe Berry Industry Revenue (Million), by Export Market Analysis (Value & Volume) 2025 & 2033
- Figure 21: Europe Berry Industry Revenue Share (%), by Export Market Analysis (Value & Volume) 2025 & 2033
- Figure 22: Europe Berry Industry Revenue (Million), by Price Trend Analysis 2025 & 2033
- Figure 23: Europe Berry Industry Revenue Share (%), by Price Trend Analysis 2025 & 2033
- Figure 24: Europe Berry Industry Revenue (Million), by Country 2025 & 2033
- Figure 25: Europe Berry Industry Revenue Share (%), by Country 2025 & 2033
- Figure 26: Asia Pacific Berry Industry Revenue (Million), by Production Analysis 2025 & 2033
- Figure 27: Asia Pacific Berry Industry Revenue Share (%), by Production Analysis 2025 & 2033
- Figure 28: Asia Pacific Berry Industry Revenue (Million), by Consumption Analysis 2025 & 2033
- Figure 29: Asia Pacific Berry Industry Revenue Share (%), by Consumption Analysis 2025 & 2033
- Figure 30: Asia Pacific Berry Industry Revenue (Million), by Import Market Analysis (Value & Volume) 2025 & 2033
- Figure 31: Asia Pacific Berry Industry Revenue Share (%), by Import Market Analysis (Value & Volume) 2025 & 2033
- Figure 32: Asia Pacific Berry Industry Revenue (Million), by Export Market Analysis (Value & Volume) 2025 & 2033
- Figure 33: Asia Pacific Berry Industry Revenue Share (%), by Export Market Analysis (Value & Volume) 2025 & 2033
- Figure 34: Asia Pacific Berry Industry Revenue (Million), by Price Trend Analysis 2025 & 2033
- Figure 35: Asia Pacific Berry Industry Revenue Share (%), by Price Trend Analysis 2025 & 2033
- Figure 36: Asia Pacific Berry Industry Revenue (Million), by Country 2025 & 2033
- Figure 37: Asia Pacific Berry Industry Revenue Share (%), by Country 2025 & 2033
- Figure 38: South America Berry Industry Revenue (Million), by Production Analysis 2025 & 2033
- Figure 39: South America Berry Industry Revenue Share (%), by Production Analysis 2025 & 2033
- Figure 40: South America Berry Industry Revenue (Million), by Consumption Analysis 2025 & 2033
- Figure 41: South America Berry Industry Revenue Share (%), by Consumption Analysis 2025 & 2033
- Figure 42: South America Berry Industry Revenue (Million), by Import Market Analysis (Value & Volume) 2025 & 2033
- Figure 43: South America Berry Industry Revenue Share (%), by Import Market Analysis (Value & Volume) 2025 & 2033
- Figure 44: South America Berry Industry Revenue (Million), by Export Market Analysis (Value & Volume) 2025 & 2033
- Figure 45: South America Berry Industry Revenue Share (%), by Export Market Analysis (Value & Volume) 2025 & 2033
- Figure 46: South America Berry Industry Revenue (Million), by Price Trend Analysis 2025 & 2033
- Figure 47: South America Berry Industry Revenue Share (%), by Price Trend Analysis 2025 & 2033
- Figure 48: South America Berry Industry Revenue (Million), by Country 2025 & 2033
- Figure 49: South America Berry Industry Revenue Share (%), by Country 2025 & 2033
- Figure 50: Africa Berry Industry Revenue (Million), by Production Analysis 2025 & 2033
- Figure 51: Africa Berry Industry Revenue Share (%), by Production Analysis 2025 & 2033
- Figure 52: Africa Berry Industry Revenue (Million), by Consumption Analysis 2025 & 2033
- Figure 53: Africa Berry Industry Revenue Share (%), by Consumption Analysis 2025 & 2033
- Figure 54: Africa Berry Industry Revenue (Million), by Import Market Analysis (Value & Volume) 2025 & 2033
- Figure 55: Africa Berry Industry Revenue Share (%), by Import Market Analysis (Value & Volume) 2025 & 2033
- Figure 56: Africa Berry Industry Revenue (Million), by Export Market Analysis (Value & Volume) 2025 & 2033
- Figure 57: Africa Berry Industry Revenue Share (%), by Export Market Analysis (Value & Volume) 2025 & 2033
- Figure 58: Africa Berry Industry Revenue (Million), by Price Trend Analysis 2025 & 2033
- Figure 59: Africa Berry Industry Revenue Share (%), by Price Trend Analysis 2025 & 2033
- Figure 60: Africa Berry Industry Revenue (Million), by Country 2025 & 2033
- Figure 61: Africa Berry Industry Revenue Share (%), by Country 2025 & 2033
List of Tables
- Table 1: Global Berry Industry Revenue Million Forecast, by Production Analysis 2020 & 2033
- Table 2: Global Berry Industry Revenue Million Forecast, by Consumption Analysis 2020 & 2033
- Table 3: Global Berry Industry Revenue Million Forecast, by Import Market Analysis (Value & Volume) 2020 & 2033
- Table 4: Global Berry Industry Revenue Million Forecast, by Export Market Analysis (Value & Volume) 2020 & 2033
- Table 5: Global Berry Industry Revenue Million Forecast, by Price Trend Analysis 2020 & 2033
- Table 6: Global Berry Industry Revenue Million Forecast, by Region 2020 & 2033
- Table 7: Global Berry Industry Revenue Million Forecast, by Production Analysis 2020 & 2033
- Table 8: Global Berry Industry Revenue Million Forecast, by Consumption Analysis 2020 & 2033
- Table 9: Global Berry Industry Revenue Million Forecast, by Import Market Analysis (Value & Volume) 2020 & 2033
- Table 10: Global Berry Industry Revenue Million Forecast, by Export Market Analysis (Value & Volume) 2020 & 2033
- Table 11: Global Berry Industry Revenue Million Forecast, by Price Trend Analysis 2020 & 2033
- Table 12: Global Berry Industry Revenue Million Forecast, by Country 2020 & 2033
- Table 13: United States Berry Industry Revenue (Million) Forecast, by Application 2020 & 2033
- Table 14: Canada Berry Industry Revenue (Million) Forecast, by Application 2020 & 2033
- Table 15: Global Berry Industry Revenue Million Forecast, by Production Analysis 2020 & 2033
- Table 16: Global Berry Industry Revenue Million Forecast, by Consumption Analysis 2020 & 2033
- Table 17: Global Berry Industry Revenue Million Forecast, by Import Market Analysis (Value & Volume) 2020 & 2033
- Table 18: Global Berry Industry Revenue Million Forecast, by Export Market Analysis (Value & Volume) 2020 & 2033
- Table 19: Global Berry Industry Revenue Million Forecast, by Price Trend Analysis 2020 & 2033
- Table 20: Global Berry Industry Revenue Million Forecast, by Country 2020 & 2033
- Table 21: Germany Berry Industry Revenue (Million) Forecast, by Application 2020 & 2033
- Table 22: United Kingdom Berry Industry Revenue (Million) Forecast, by Application 2020 & 2033
- Table 23: France Berry Industry Revenue (Million) Forecast, by Application 2020 & 2033
- Table 24: Spain Berry Industry Revenue (Million) Forecast, by Application 2020 & 2033
- Table 25: Netherlands Berry Industry Revenue (Million) Forecast, by Application 2020 & 2033
- Table 26: Poland Berry Industry Revenue (Million) Forecast, by Application 2020 & 2033
- Table 27: Global Berry Industry Revenue Million Forecast, by Production Analysis 2020 & 2033
- Table 28: Global Berry Industry Revenue Million Forecast, by Consumption Analysis 2020 & 2033
- Table 29: Global Berry Industry Revenue Million Forecast, by Import Market Analysis (Value & Volume) 2020 & 2033
- Table 30: Global Berry Industry Revenue Million Forecast, by Export Market Analysis (Value & Volume) 2020 & 2033
- Table 31: Global Berry Industry Revenue Million Forecast, by Price Trend Analysis 2020 & 2033
- Table 32: Global Berry Industry Revenue Million Forecast, by Country 2020 & 2033
- Table 33: China Berry Industry Revenue (Million) Forecast, by Application 2020 & 2033
- Table 34: Australia Berry Industry Revenue (Million) Forecast, by Application 2020 & 2033
- Table 35: India Berry Industry Revenue (Million) Forecast, by Application 2020 & 2033
- Table 36: Japan Berry Industry Revenue (Million) Forecast, by Application 2020 & 2033
- Table 37: Global Berry Industry Revenue Million Forecast, by Production Analysis 2020 & 2033
- Table 38: Global Berry Industry Revenue Million Forecast, by Consumption Analysis 2020 & 2033
- Table 39: Global Berry Industry Revenue Million Forecast, by Import Market Analysis (Value & Volume) 2020 & 2033
- Table 40: Global Berry Industry Revenue Million Forecast, by Export Market Analysis (Value & Volume) 2020 & 2033
- Table 41: Global Berry Industry Revenue Million Forecast, by Price Trend Analysis 2020 & 2033
- Table 42: Global Berry Industry Revenue Million Forecast, by Country 2020 & 2033
- Table 43: Brazil Berry Industry Revenue (Million) Forecast, by Application 2020 & 2033
- Table 44: Argentina Berry Industry Revenue (Million) Forecast, by Application 2020 & 2033
- Table 45: Global Berry Industry Revenue Million Forecast, by Production Analysis 2020 & 2033
- Table 46: Global Berry Industry Revenue Million Forecast, by Consumption Analysis 2020 & 2033
- Table 47: Global Berry Industry Revenue Million Forecast, by Import Market Analysis (Value & Volume) 2020 & 2033
- Table 48: Global Berry Industry Revenue Million Forecast, by Export Market Analysis (Value & Volume) 2020 & 2033
- Table 49: Global Berry Industry Revenue Million Forecast, by Price Trend Analysis 2020 & 2033
- Table 50: Global Berry Industry Revenue Million Forecast, by Country 2020 & 2033
- Table 51: South Africa Berry Industry Revenue (Million) Forecast, by Application 2020 & 2033
- Table 52: Egypt Berry Industry Revenue (Million) Forecast, by Application 2020 & 2033
Frequently Asked Questions
1. What is the projected Compound Annual Growth Rate (CAGR) of the Berry Industry?
The projected CAGR is approximately 3.70%.
2. Which companies are prominent players in the Berry Industry?
Key companies in the market include Driscoll's , Naturipe Farms , Hortifrut, Red Moon Farms , Driscoll's of Monterey.
3. What are the main segments of the Berry Industry?
The market segments include Production Analysis, Consumption Analysis, Import Market Analysis (Value & Volume), Export Market Analysis (Value & Volume), Price Trend Analysis.
4. Can you provide details about the market size?
The market size is estimated to be USD 26.56 Million as of 2022.
5. What are some drivers contributing to market growth?
Increasing Berry Consumption for Health Benefits; Increasing Adoption of High-Technology Farm Practices; Growing Usage of Berries in the Food and Beverage Industries.
6. What are the notable trends driving market growth?
Increasing Export of Berries from United States is Driving the Market.
7. Are there any restraints impacting market growth?
High Production Cost Involved in Berry Production; Increasing Disease and Pest Infestations.
8. Can you provide examples of recent developments in the market?
October 2023: Naturipe Farms has launched the “Sweet Selections” premium berries line. The Sweet Selections line featured Naturipe’s proprietary berry varieties that were meticulously bred and selected for high flavor and overall eating experience.
9. What pricing options are available for accessing the report?
Pricing options include single-user, multi-user, and enterprise licenses priced at USD 4750, USD 5250, and USD 8750 respectively.
10. Is the market size provided in terms of value or volume?
The market size is provided in terms of value, measured in Million.
11. Are there any specific market keywords associated with the report?
Yes, the market keyword associated with the report is "Berry Industry," which aids in identifying and referencing the specific market segment covered.
12. How do I determine which pricing option suits my needs best?
The pricing options vary based on user requirements and access needs. Individual users may opt for single-user licenses, while businesses requiring broader access may choose multi-user or enterprise licenses for cost-effective access to the report.
13. Are there any additional resources or data provided in the Berry Industry report?
While the report offers comprehensive insights, it's advisable to review the specific contents or supplementary materials provided to ascertain if additional resources or data are available.
14. How can I stay updated on further developments or reports in the Berry Industry?
To stay informed about further developments, trends, and reports in the Berry Industry, consider subscribing to industry newsletters, following relevant companies and organizations, or regularly checking reputable industry news sources and publications.
Methodology
Step 1 - Identification of Relevant Samples Size from Population Database


Step 2 - Approaches for Defining Global Market Size (Value, Volume* & Price*)

Note*: In applicable scenarios
Step 3 - Data Sources
Primary Research
- Web Analytics
- Survey Reports
- Research Institute
- Latest Research Reports
- Opinion Leaders
Secondary Research
- Annual Reports
- White Paper
- Latest Press Release
- Industry Association
- Paid Database
- Investor Presentations

Step 4 - Data Triangulation
Involves using different sources of information in order to increase the validity of a study
These sources are likely to be stakeholders in a program - participants, other researchers, program staff, other community members, and so on.
Then we put all data in single framework & apply various statistical tools to find out the dynamic on the market.
During the analysis stage, feedback from the stakeholder groups would be compared to determine areas of agreement as well as areas of divergence