

Key Insights
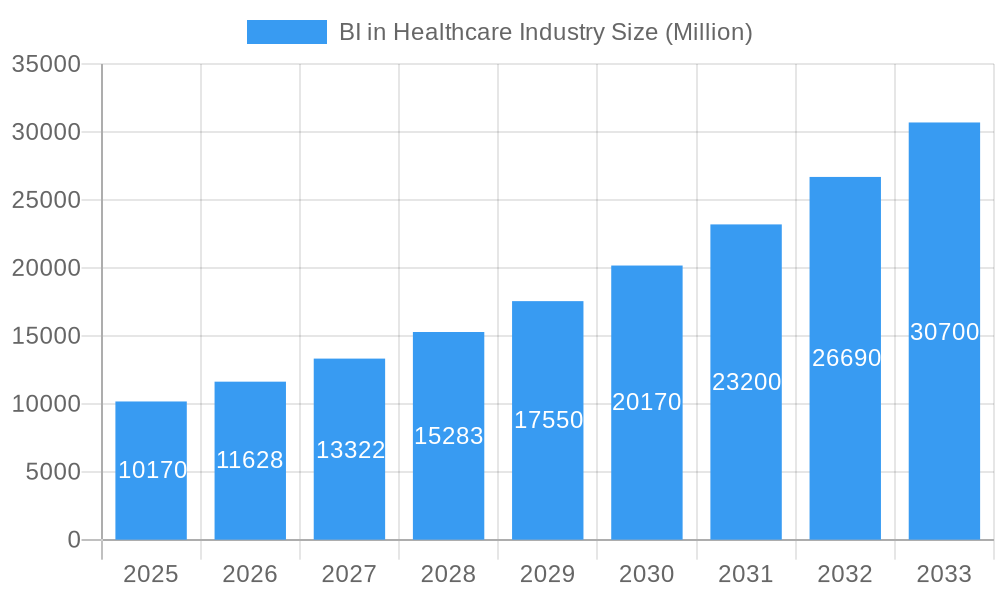
The Business Intelligence (BI) in Healthcare market is experiencing robust growth, projected to reach $10.17 billion in 2025 and exhibiting a Compound Annual Growth Rate (CAGR) of 14.41% from 2025 to 2033. This expansion is fueled by several key drivers. The increasing volume of healthcare data generated from electronic health records (EHRs), wearable devices, and other sources necessitates sophisticated analytics for improved decision-making. Furthermore, the rising demand for value-based care, coupled with regulatory pressures to enhance efficiency and reduce costs, is driving adoption of BI solutions. Key trends include the increasing preference for cloud-based BI platforms, the integration of artificial intelligence (AI) and machine learning (ML) for predictive analytics, and the growing adoption of BI across various healthcare applications like financial analysis, clinical data analysis, and patient care management. While data security and privacy concerns remain a restraint, the market's growth trajectory suggests these challenges are being actively addressed through enhanced security protocols and regulatory compliance. The market is segmented by component (software and services), mode of delivery (on-premise, hybrid, and cloud-based), application (financial, clinical, patient care, and others), and end-user (payers, providers, and others). North America currently holds a significant market share, driven by early adoption and technological advancements; however, Asia Pacific is poised for substantial growth due to increasing healthcare expenditure and digitalization efforts. The competitive landscape is marked by a mix of established players like SAS, IBM, and Microsoft, and specialized healthcare BI providers such as CareCloud and Epic Systems. The long-term forecast indicates continued market expansion driven by technological innovation and increasing data-driven decision-making within the healthcare sector.
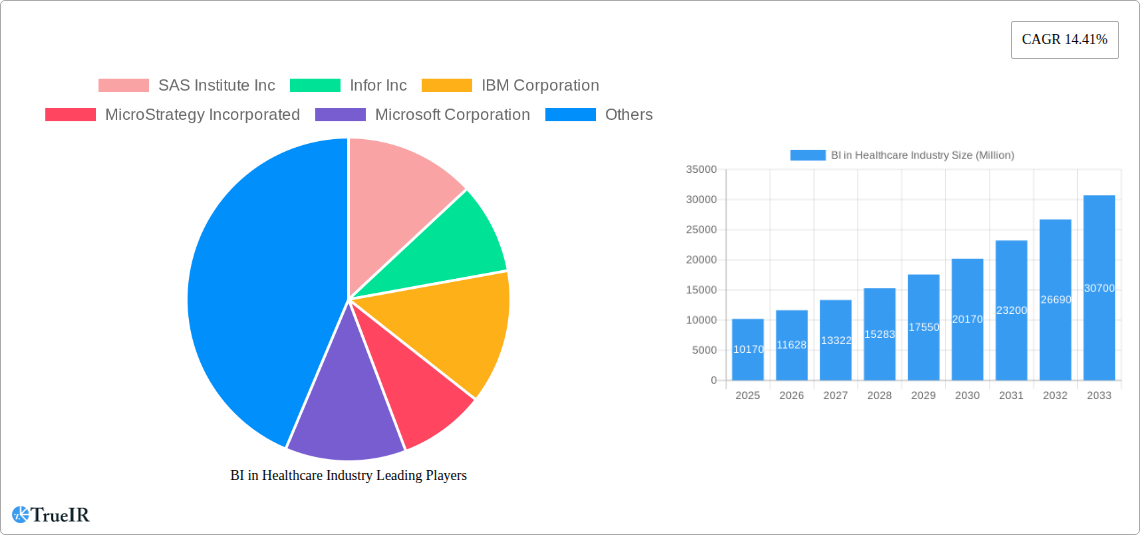
BI in Healthcare Industry Market Size (In Billion)
The diverse application of BI tools across the healthcare ecosystem contributes significantly to its growth. Financial analysis applications, using BI to optimize revenue cycle management and reduce administrative costs, are witnessing strong demand. Clinical data analysis helps improve patient outcomes through efficient diagnosis and treatment planning, while patient care analysis enables personalized medicine and enhanced patient engagement. The ongoing development of sophisticated algorithms and the integration of various data sources further propel market growth. The transition towards cloud-based solutions offers scalability and cost-effectiveness, making BI accessible to a wider range of healthcare organizations. Future growth will likely be influenced by factors such as advancements in AI and ML, increasing investment in healthcare infrastructure, and the expanding adoption of telehealth services. The market's segmented nature allows tailored BI solutions to address specific needs within different healthcare settings, reinforcing the overall market's impressive growth potential.
BI in Healthcare Industry Company Market Share
BI in Healthcare Industry Market Report: 2019-2033
This comprehensive report provides a detailed analysis of the Business Intelligence (BI) market in the healthcare industry, offering invaluable insights for stakeholders, investors, and industry professionals. The study period covers 2019-2033, with a base year of 2025 and a forecast period of 2025-2033. The report projects a market valuation exceeding $XX Million by 2033, exhibiting a robust Compound Annual Growth Rate (CAGR) of xx%. This in-depth analysis incorporates detailed segmentation, competitive landscaping, and future market projections, making it an essential resource for navigating this rapidly evolving sector. This report is crucial for understanding the $XX Million market and making informed business decisions.
BI in Healthcare Industry Market Structure & Competitive Landscape
The BI in healthcare market is characterized by a moderately concentrated landscape with key players like SAS Institute Inc, Infor Inc, IBM Corporation, MicroStrategy Incorporated, Microsoft Corporation, CareCloud Inc, EPIC SYSTEMS, QlikTech International AB, Information Builders, Oracle Corporation, Salesforce, Sisense Inc, Domo Inc, and SAP SE vying for market share. The market concentration ratio (CR4) is estimated at xx%, indicating a moderate level of competition.
- Innovation Drivers: Advancements in AI, machine learning, and cloud computing are driving innovation, leading to more sophisticated analytical tools and improved data visualization capabilities. The increasing adoption of big data analytics and predictive modeling further fuels this trend.
- Regulatory Impacts: HIPAA compliance and data privacy regulations significantly influence market dynamics, necessitating robust security measures and data governance frameworks.
- Product Substitutes: While dedicated BI solutions dominate, alternative data analysis tools and custom-built systems present some level of substitution.
- End-User Segmentation: The market is segmented by payers, healthcare providers, and other end-users, with healthcare providers accounting for the largest share currently at approximately xx Million.
- M&A Trends: The acquisition of Cerner Corporation by Oracle in June 2022 highlights the ongoing consolidation within the market, indicating a potential increase in market concentration in the coming years, with an estimated xx Million in M&A activity in the past five years.
BI in Healthcare Industry Market Trends & Opportunities
The global BI in healthcare market is experiencing significant growth, driven by factors such as the increasing volume of healthcare data, the rising demand for improved operational efficiency, and the growing need for data-driven decision-making within healthcare organizations. The market size is estimated at $XX Million in 2025 and is projected to reach $XX Million by 2033, reflecting a CAGR of xx%. This growth is fueled by several key market trends:
The shift towards value-based care is driving demand for advanced analytics to optimize resource allocation and improve patient outcomes. The increasing adoption of cloud-based BI solutions offers scalability, cost-effectiveness, and enhanced accessibility. Consumer preferences are shifting towards personalized healthcare experiences, leading to a growing need for data-driven insights to tailor care plans effectively. Furthermore, advancements in artificial intelligence (AI) and machine learning (ML) are transforming BI capabilities, enabling predictive analytics and early identification of potential health risks. Competition is intensifying, with established players and new entrants vying for market share through product innovation and strategic partnerships. The market penetration rate for cloud-based BI solutions in the healthcare industry is projected to reach xx% by 2033.
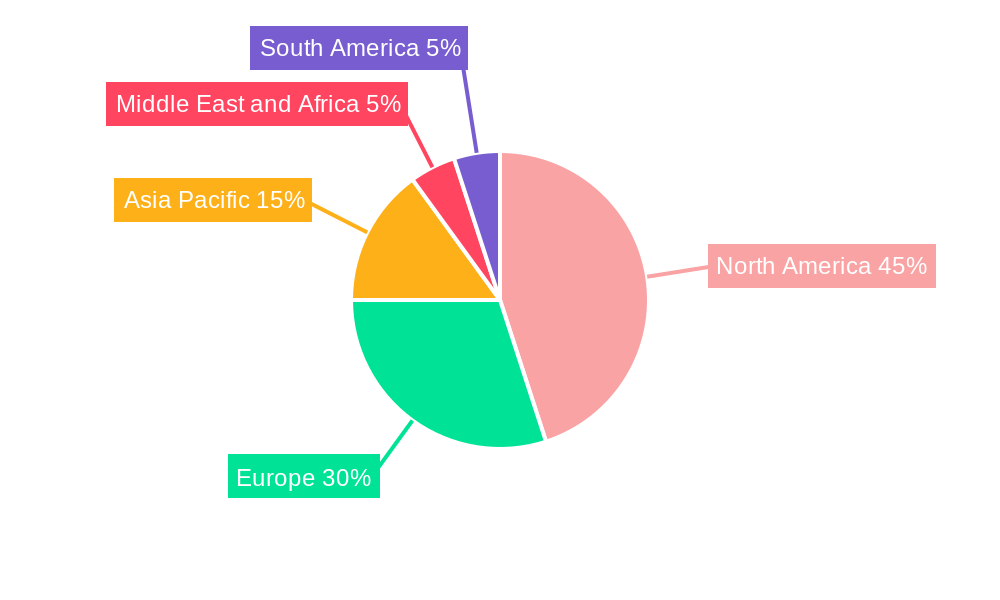
Dominant Markets & Segments in BI in Healthcare Industry
The North American region currently holds the largest market share, followed by Europe and Asia Pacific. Within North America, the United States is a dominant market due to factors such as robust healthcare infrastructure, increased healthcare spending, and favorable regulatory environments.
- By Component: The software segment dominates, accounting for approximately xx Million in revenue due to the high demand for sophisticated BI tools and platforms.
- By Mode of Delivery: Cloud-based models are rapidly gaining traction, owing to their scalability, cost-effectiveness, and accessibility, currently accounting for approximately xx Million, while on-premise models still hold a significant share due to established legacy systems and security concerns.
- By Application: Clinical data analysis is the leading application segment with $XX Million in revenue followed by financial analysis. Patient care analysis is a rapidly growing segment with strong potential.
- By End User: Healthcare providers constitute the largest end-user segment due to the large volume of data generated and their need for actionable insights.
Key growth drivers include:
- Technological advancements: AI, ML, cloud computing.
- Government initiatives: Funding for healthcare IT infrastructure and digital health.
- Increased healthcare spending: Driving the adoption of advanced analytics solutions.
BI in Healthcare Industry Product Analysis
Product innovations in the BI healthcare market focus on enhanced data visualization, predictive analytics capabilities leveraging AI/ML, improved integration with Electronic Health Records (EHRs), and user-friendly interfaces. These advancements aim to improve the accessibility and usability of BI solutions for healthcare professionals. The competitive advantage lies in offering comprehensive, secure, and scalable solutions tailored to specific healthcare needs, including seamless integration with existing healthcare systems and compliance with stringent regulations.
Key Drivers, Barriers & Challenges in BI in Healthcare Industry
Key Drivers: The increasing volume of healthcare data, the need for improved operational efficiency, the shift towards value-based care, and advancements in AI/ML are key drivers. The rising adoption of cloud computing and the availability of more affordable, user-friendly BI solutions also contribute significantly.
Challenges: Data security and privacy concerns related to HIPAA compliance pose a major challenge. Integration with legacy systems and EHRs can be complex and costly. The lack of skilled professionals to implement and manage BI solutions represents a significant barrier. The high cost of implementation and maintenance can also deter adoption, especially for smaller healthcare providers. The current market faces challenges in data interoperability and standardization across various healthcare systems, which hinders seamless data analysis and insights generation. This results in approximately a xx% failure rate in BI project implementations.
Growth Drivers in the BI in Healthcare Industry Market
The growth of the BI in healthcare market is fueled by several key drivers. Technological advancements like AI and ML are transforming data analysis, enabling predictive modeling and improved decision-making. Government initiatives and increased healthcare spending further support adoption. The shift toward value-based care necessitates better data utilization for optimizing resource allocation and improving outcomes.
Challenges Impacting BI in Healthcare Industry Growth
Regulatory hurdles, particularly HIPAA compliance, create challenges for data sharing and security. Integration complexities with legacy systems and a shortage of skilled professionals hinder implementation. High costs and the need for substantial infrastructure investment also present obstacles, particularly for small healthcare providers. Additionally, the fragmented nature of the healthcare industry, with diverse data formats and standards, can impact the efficiency and effectiveness of BI solutions.
Key Players Shaping the BI in Healthcare Industry Market
- SAS Institute Inc
- Infor Inc
- IBM Corporation
- MicroStrategy Incorporated
- Microsoft Corporation
- CareCloud Inc
- EPIC SYSTEMS
- QlikTech International AB
- Information Builders
- Oracle Corporation
- Salesforce
- Sisense Inc
- Domo Inc
- SAP SE
Significant BI in Healthcare Industry Industry Milestones
- June 2022: Oracle Corporation's acquisition of Cerner Corporation significantly impacted the market landscape, consolidating market share and enhancing Oracle's position in the healthcare IT sector.
- January 2022: The launch of PINC AI's INsights platform provided a significant boost to self-service analytics capabilities, enhancing accessibility to data-driven insights for healthcare professionals.
- January 2022: CareCloud Inc.'s launch of PrecisionBI Lite expanded the reach of BI solutions to smaller medical practices, increasing market penetration and democratizing access to valuable financial and operational data.
Future Outlook for BI in Healthcare Industry Market
The BI in healthcare market is poised for continued growth, driven by advancements in AI and ML, the increasing adoption of cloud-based solutions, and ongoing regulatory changes. Strategic partnerships and acquisitions will further shape the market dynamics. The development of more user-friendly interfaces and improved data integration capabilities will enhance adoption rates across all healthcare sectors. This positive outlook suggests a substantial market expansion and increased opportunities for market participants.
BI in Healthcare Industry Segmentation
-
1. Component
- 1.1. Software
- 1.2. Services
-
2. Mode of Delivery
- 2.1. On-premise Model
- 2.2. Hybrid Model
- 2.3. Cloud-based Model
-
3. Application
- 3.1. Financial Analysis
- 3.2. Clinical Data Analysis
- 3.3. Patient Care Analysis
- 3.4. Other Applications
-
4. End User
- 4.1. Payers
- 4.2. Healthcare Providers
- 4.3. Other End Users
BI in Healthcare Industry Segmentation By Geography
-
1. North America
- 1.1. United States
- 1.2. Canada
- 1.3. Mexico
-
2. Europe
- 2.1. Germany
- 2.2. United Kingdom
- 2.3. France
- 2.4. Italy
- 2.5. Spain
- 2.6. Rest of Europe
-
3. Asia Pacific
- 3.1. China
- 3.2. Japan
- 3.3. India
- 3.4. Australia
- 3.5. South Korea
- 3.6. Rest of Asia Pacific
-
4. Middle East and Africa
- 4.1. GCC
- 4.2. South Africa
- 4.3. Rest of Middle East and Africa
-
5. South America
- 5.1. Brazil
- 5.2. Argentina
- 5.3. Rest of South America
BI in Healthcare Industry Regional Market Share
Geographic Coverage of BI in Healthcare Industry
BI in Healthcare Industry REPORT HIGHLIGHTS
| Aspects | Details |
|---|---|
| Study Period | 2020-2034 |
| Base Year | 2025 |
| Estimated Year | 2026 |
| Forecast Period | 2026-2034 |
| Historical Period | 2020-2025 |
| Growth Rate | CAGR of 14.41% from 2020-2034 |
| Segmentation |
|
Table of Contents
- 1. Introduction
- 1.1. Research Scope
- 1.2. Market Segmentation
- 1.3. Research Objective
- 1.4. Definitions and Assumptions
- 2. Executive Summary
- 2.1. Market Snapshot
- 3. Market Dynamics
- 3.1. Market Drivers
- 3.2. Market Restrains
- 3.3. Market Trends
- 3.4. Market Opportunities
- 4. Market Factor Analysis
- 4.1. Porters Five Forces
- 4.1.1. Bargaining Power of Suppliers
- 4.1.2. Bargaining Power of Buyers
- 4.1.3. Threat of New Entrants
- 4.1.4. Threat of Substitutes
- 4.1.5. Competitive Rivalry
- 4.2. PESTEL analysis
- 4.3. BCG Analysis
- 4.3.1. Stars (High Growth, High Market Share)
- 4.3.2. Cash Cows (Low Growth, High Market Share)
- 4.3.3. Question Mark (High Growth, Low Market Share)
- 4.3.4. Dogs (Low Growth, Low Market Share)
- 4.4. Ansoff Matrix Analysis
- 4.5. Supply Chain Analysis
- 4.6. Regulatory Landscape
- 4.7. Current Market Potential and Opportunity Assessment (TAM–SAM–SOM Framework)
- 4.8. TIR Analyst Note
- 4.1. Porters Five Forces
- 5. Market Analysis, Insights and Forecast 2021-2033
- 5.1. Market Analysis, Insights and Forecast - by Component
- 5.1.1. Software
- 5.1.2. Services
- 5.2. Market Analysis, Insights and Forecast - by Mode of Delivery
- 5.2.1. On-premise Model
- 5.2.2. Hybrid Model
- 5.2.3. Cloud-based Model
- 5.3. Market Analysis, Insights and Forecast - by Application
- 5.3.1. Financial Analysis
- 5.3.2. Clinical Data Analysis
- 5.3.3. Patient Care Analysis
- 5.3.4. Other Applications
- 5.4. Market Analysis, Insights and Forecast - by End User
- 5.4.1. Payers
- 5.4.2. Healthcare Providers
- 5.4.3. Other End Users
- 5.5. Market Analysis, Insights and Forecast - by Region
- 5.5.1. North America
- 5.5.2. Europe
- 5.5.3. Asia Pacific
- 5.5.4. Middle East and Africa
- 5.5.5. South America
- 5.1. Market Analysis, Insights and Forecast - by Component
- 6. Global BI in Healthcare Industry Analysis, Insights and Forecast, 2021-2033
- 6.1. Market Analysis, Insights and Forecast - by Component
- 6.1.1. Software
- 6.1.2. Services
- 6.2. Market Analysis, Insights and Forecast - by Mode of Delivery
- 6.2.1. On-premise Model
- 6.2.2. Hybrid Model
- 6.2.3. Cloud-based Model
- 6.3. Market Analysis, Insights and Forecast - by Application
- 6.3.1. Financial Analysis
- 6.3.2. Clinical Data Analysis
- 6.3.3. Patient Care Analysis
- 6.3.4. Other Applications
- 6.4. Market Analysis, Insights and Forecast - by End User
- 6.4.1. Payers
- 6.4.2. Healthcare Providers
- 6.4.3. Other End Users
- 6.1. Market Analysis, Insights and Forecast - by Component
- 7. North America BI in Healthcare Industry Analysis, Insights and Forecast, 2020-2032
- 7.1. Market Analysis, Insights and Forecast - by Component
- 7.1.1. Software
- 7.1.2. Services
- 7.2. Market Analysis, Insights and Forecast - by Mode of Delivery
- 7.2.1. On-premise Model
- 7.2.2. Hybrid Model
- 7.2.3. Cloud-based Model
- 7.3. Market Analysis, Insights and Forecast - by Application
- 7.3.1. Financial Analysis
- 7.3.2. Clinical Data Analysis
- 7.3.3. Patient Care Analysis
- 7.3.4. Other Applications
- 7.4. Market Analysis, Insights and Forecast - by End User
- 7.4.1. Payers
- 7.4.2. Healthcare Providers
- 7.4.3. Other End Users
- 7.1. Market Analysis, Insights and Forecast - by Component
- 8. Europe BI in Healthcare Industry Analysis, Insights and Forecast, 2020-2032
- 8.1. Market Analysis, Insights and Forecast - by Component
- 8.1.1. Software
- 8.1.2. Services
- 8.2. Market Analysis, Insights and Forecast - by Mode of Delivery
- 8.2.1. On-premise Model
- 8.2.2. Hybrid Model
- 8.2.3. Cloud-based Model
- 8.3. Market Analysis, Insights and Forecast - by Application
- 8.3.1. Financial Analysis
- 8.3.2. Clinical Data Analysis
- 8.3.3. Patient Care Analysis
- 8.3.4. Other Applications
- 8.4. Market Analysis, Insights and Forecast - by End User
- 8.4.1. Payers
- 8.4.2. Healthcare Providers
- 8.4.3. Other End Users
- 8.1. Market Analysis, Insights and Forecast - by Component
- 9. Asia Pacific BI in Healthcare Industry Analysis, Insights and Forecast, 2020-2032
- 9.1. Market Analysis, Insights and Forecast - by Component
- 9.1.1. Software
- 9.1.2. Services
- 9.2. Market Analysis, Insights and Forecast - by Mode of Delivery
- 9.2.1. On-premise Model
- 9.2.2. Hybrid Model
- 9.2.3. Cloud-based Model
- 9.3. Market Analysis, Insights and Forecast - by Application
- 9.3.1. Financial Analysis
- 9.3.2. Clinical Data Analysis
- 9.3.3. Patient Care Analysis
- 9.3.4. Other Applications
- 9.4. Market Analysis, Insights and Forecast - by End User
- 9.4.1. Payers
- 9.4.2. Healthcare Providers
- 9.4.3. Other End Users
- 9.1. Market Analysis, Insights and Forecast - by Component
- 10. Middle East and Africa BI in Healthcare Industry Analysis, Insights and Forecast, 2020-2032
- 10.1. Market Analysis, Insights and Forecast - by Component
- 10.1.1. Software
- 10.1.2. Services
- 10.2. Market Analysis, Insights and Forecast - by Mode of Delivery
- 10.2.1. On-premise Model
- 10.2.2. Hybrid Model
- 10.2.3. Cloud-based Model
- 10.3. Market Analysis, Insights and Forecast - by Application
- 10.3.1. Financial Analysis
- 10.3.2. Clinical Data Analysis
- 10.3.3. Patient Care Analysis
- 10.3.4. Other Applications
- 10.4. Market Analysis, Insights and Forecast - by End User
- 10.4.1. Payers
- 10.4.2. Healthcare Providers
- 10.4.3. Other End Users
- 10.1. Market Analysis, Insights and Forecast - by Component
- 11. South America BI in Healthcare Industry Analysis, Insights and Forecast, 2020-2032
- 11.1. Market Analysis, Insights and Forecast - by Component
- 11.1.1. Software
- 11.1.2. Services
- 11.2. Market Analysis, Insights and Forecast - by Mode of Delivery
- 11.2.1. On-premise Model
- 11.2.2. Hybrid Model
- 11.2.3. Cloud-based Model
- 11.3. Market Analysis, Insights and Forecast - by Application
- 11.3.1. Financial Analysis
- 11.3.2. Clinical Data Analysis
- 11.3.3. Patient Care Analysis
- 11.3.4. Other Applications
- 11.4. Market Analysis, Insights and Forecast - by End User
- 11.4.1. Payers
- 11.4.2. Healthcare Providers
- 11.4.3. Other End Users
- 11.1. Market Analysis, Insights and Forecast - by Component
- 12. Competitive Analysis
- 12.1. Company Profiles
- 12.1.1 SAS Institute Inc
- 12.1.1.1. Company Overview
- 12.1.1.2. Products
- 12.1.1.3. Company Financials
- 12.1.1.4. SWOT Analysis
- 12.1.2 Infor Inc
- 12.1.2.1. Company Overview
- 12.1.2.2. Products
- 12.1.2.3. Company Financials
- 12.1.2.4. SWOT Analysis
- 12.1.3 IBM Corporation
- 12.1.3.1. Company Overview
- 12.1.3.2. Products
- 12.1.3.3. Company Financials
- 12.1.3.4. SWOT Analysis
- 12.1.4 MicroStrategy Incorporated
- 12.1.4.1. Company Overview
- 12.1.4.2. Products
- 12.1.4.3. Company Financials
- 12.1.4.4. SWOT Analysis
- 12.1.5 Microsoft Corporation
- 12.1.5.1. Company Overview
- 12.1.5.2. Products
- 12.1.5.3. Company Financials
- 12.1.5.4. SWOT Analysis
- 12.1.6 CareCloud Inc
- 12.1.6.1. Company Overview
- 12.1.6.2. Products
- 12.1.6.3. Company Financials
- 12.1.6.4. SWOT Analysis
- 12.1.7 EPIC SYSTEMS
- 12.1.7.1. Company Overview
- 12.1.7.2. Products
- 12.1.7.3. Company Financials
- 12.1.7.4. SWOT Analysis
- 12.1.8 QlikTech International AB
- 12.1.8.1. Company Overview
- 12.1.8.2. Products
- 12.1.8.3. Company Financials
- 12.1.8.4. SWOT Analysis
- 12.1.9 Information Builders
- 12.1.9.1. Company Overview
- 12.1.9.2. Products
- 12.1.9.3. Company Financials
- 12.1.9.4. SWOT Analysis
- 12.1.10 Oracle Corporation
- 12.1.10.1. Company Overview
- 12.1.10.2. Products
- 12.1.10.3. Company Financials
- 12.1.10.4. SWOT Analysis
- 12.1.11 Salesforce
- 12.1.11.1. Company Overview
- 12.1.11.2. Products
- 12.1.11.3. Company Financials
- 12.1.11.4. SWOT Analysis
- 12.1.12 Sisense Inc
- 12.1.12.1. Company Overview
- 12.1.12.2. Products
- 12.1.12.3. Company Financials
- 12.1.12.4. SWOT Analysis
- 12.1.13 Domo Inc
- 12.1.13.1. Company Overview
- 12.1.13.2. Products
- 12.1.13.3. Company Financials
- 12.1.13.4. SWOT Analysis
- 12.1.14 SAP SE
- 12.1.14.1. Company Overview
- 12.1.14.2. Products
- 12.1.14.3. Company Financials
- 12.1.14.4. SWOT Analysis
- 12.1.1 SAS Institute Inc
- 12.2. Market Entropy
- 12.2.1 Company's Key Areas Served
- 12.2.2 Recent Developments
- 12.3. Company Market Share Analysis 2025
- 12.3.1 Top 5 Companies Market Share Analysis
- 12.3.2 Top 3 Companies Market Share Analysis
- 12.4. List of Potential Customers
- 13. Research Methodology
List of Figures
- Figure 1: Global BI in Healthcare Industry Revenue Breakdown (Million, %) by Region 2025 & 2033
- Figure 2: Global BI in Healthcare Industry Volume Breakdown (K Unit, %) by Region 2025 & 2033
- Figure 3: North America BI in Healthcare Industry Revenue (Million), by Component 2025 & 2033
- Figure 4: North America BI in Healthcare Industry Volume (K Unit), by Component 2025 & 2033
- Figure 5: North America BI in Healthcare Industry Revenue Share (%), by Component 2025 & 2033
- Figure 6: North America BI in Healthcare Industry Volume Share (%), by Component 2025 & 2033
- Figure 7: North America BI in Healthcare Industry Revenue (Million), by Mode of Delivery 2025 & 2033
- Figure 8: North America BI in Healthcare Industry Volume (K Unit), by Mode of Delivery 2025 & 2033
- Figure 9: North America BI in Healthcare Industry Revenue Share (%), by Mode of Delivery 2025 & 2033
- Figure 10: North America BI in Healthcare Industry Volume Share (%), by Mode of Delivery 2025 & 2033
- Figure 11: North America BI in Healthcare Industry Revenue (Million), by Application 2025 & 2033
- Figure 12: North America BI in Healthcare Industry Volume (K Unit), by Application 2025 & 2033
- Figure 13: North America BI in Healthcare Industry Revenue Share (%), by Application 2025 & 2033
- Figure 14: North America BI in Healthcare Industry Volume Share (%), by Application 2025 & 2033
- Figure 15: North America BI in Healthcare Industry Revenue (Million), by End User 2025 & 2033
- Figure 16: North America BI in Healthcare Industry Volume (K Unit), by End User 2025 & 2033
- Figure 17: North America BI in Healthcare Industry Revenue Share (%), by End User 2025 & 2033
- Figure 18: North America BI in Healthcare Industry Volume Share (%), by End User 2025 & 2033
- Figure 19: North America BI in Healthcare Industry Revenue (Million), by Country 2025 & 2033
- Figure 20: North America BI in Healthcare Industry Volume (K Unit), by Country 2025 & 2033
- Figure 21: North America BI in Healthcare Industry Revenue Share (%), by Country 2025 & 2033
- Figure 22: North America BI in Healthcare Industry Volume Share (%), by Country 2025 & 2033
- Figure 23: Europe BI in Healthcare Industry Revenue (Million), by Component 2025 & 2033
- Figure 24: Europe BI in Healthcare Industry Volume (K Unit), by Component 2025 & 2033
- Figure 25: Europe BI in Healthcare Industry Revenue Share (%), by Component 2025 & 2033
- Figure 26: Europe BI in Healthcare Industry Volume Share (%), by Component 2025 & 2033
- Figure 27: Europe BI in Healthcare Industry Revenue (Million), by Mode of Delivery 2025 & 2033
- Figure 28: Europe BI in Healthcare Industry Volume (K Unit), by Mode of Delivery 2025 & 2033
- Figure 29: Europe BI in Healthcare Industry Revenue Share (%), by Mode of Delivery 2025 & 2033
- Figure 30: Europe BI in Healthcare Industry Volume Share (%), by Mode of Delivery 2025 & 2033
- Figure 31: Europe BI in Healthcare Industry Revenue (Million), by Application 2025 & 2033
- Figure 32: Europe BI in Healthcare Industry Volume (K Unit), by Application 2025 & 2033
- Figure 33: Europe BI in Healthcare Industry Revenue Share (%), by Application 2025 & 2033
- Figure 34: Europe BI in Healthcare Industry Volume Share (%), by Application 2025 & 2033
- Figure 35: Europe BI in Healthcare Industry Revenue (Million), by End User 2025 & 2033
- Figure 36: Europe BI in Healthcare Industry Volume (K Unit), by End User 2025 & 2033
- Figure 37: Europe BI in Healthcare Industry Revenue Share (%), by End User 2025 & 2033
- Figure 38: Europe BI in Healthcare Industry Volume Share (%), by End User 2025 & 2033
- Figure 39: Europe BI in Healthcare Industry Revenue (Million), by Country 2025 & 2033
- Figure 40: Europe BI in Healthcare Industry Volume (K Unit), by Country 2025 & 2033
- Figure 41: Europe BI in Healthcare Industry Revenue Share (%), by Country 2025 & 2033
- Figure 42: Europe BI in Healthcare Industry Volume Share (%), by Country 2025 & 2033
- Figure 43: Asia Pacific BI in Healthcare Industry Revenue (Million), by Component 2025 & 2033
- Figure 44: Asia Pacific BI in Healthcare Industry Volume (K Unit), by Component 2025 & 2033
- Figure 45: Asia Pacific BI in Healthcare Industry Revenue Share (%), by Component 2025 & 2033
- Figure 46: Asia Pacific BI in Healthcare Industry Volume Share (%), by Component 2025 & 2033
- Figure 47: Asia Pacific BI in Healthcare Industry Revenue (Million), by Mode of Delivery 2025 & 2033
- Figure 48: Asia Pacific BI in Healthcare Industry Volume (K Unit), by Mode of Delivery 2025 & 2033
- Figure 49: Asia Pacific BI in Healthcare Industry Revenue Share (%), by Mode of Delivery 2025 & 2033
- Figure 50: Asia Pacific BI in Healthcare Industry Volume Share (%), by Mode of Delivery 2025 & 2033
- Figure 51: Asia Pacific BI in Healthcare Industry Revenue (Million), by Application 2025 & 2033
- Figure 52: Asia Pacific BI in Healthcare Industry Volume (K Unit), by Application 2025 & 2033
- Figure 53: Asia Pacific BI in Healthcare Industry Revenue Share (%), by Application 2025 & 2033
- Figure 54: Asia Pacific BI in Healthcare Industry Volume Share (%), by Application 2025 & 2033
- Figure 55: Asia Pacific BI in Healthcare Industry Revenue (Million), by End User 2025 & 2033
- Figure 56: Asia Pacific BI in Healthcare Industry Volume (K Unit), by End User 2025 & 2033
- Figure 57: Asia Pacific BI in Healthcare Industry Revenue Share (%), by End User 2025 & 2033
- Figure 58: Asia Pacific BI in Healthcare Industry Volume Share (%), by End User 2025 & 2033
- Figure 59: Asia Pacific BI in Healthcare Industry Revenue (Million), by Country 2025 & 2033
- Figure 60: Asia Pacific BI in Healthcare Industry Volume (K Unit), by Country 2025 & 2033
- Figure 61: Asia Pacific BI in Healthcare Industry Revenue Share (%), by Country 2025 & 2033
- Figure 62: Asia Pacific BI in Healthcare Industry Volume Share (%), by Country 2025 & 2033
- Figure 63: Middle East and Africa BI in Healthcare Industry Revenue (Million), by Component 2025 & 2033
- Figure 64: Middle East and Africa BI in Healthcare Industry Volume (K Unit), by Component 2025 & 2033
- Figure 65: Middle East and Africa BI in Healthcare Industry Revenue Share (%), by Component 2025 & 2033
- Figure 66: Middle East and Africa BI in Healthcare Industry Volume Share (%), by Component 2025 & 2033
- Figure 67: Middle East and Africa BI in Healthcare Industry Revenue (Million), by Mode of Delivery 2025 & 2033
- Figure 68: Middle East and Africa BI in Healthcare Industry Volume (K Unit), by Mode of Delivery 2025 & 2033
- Figure 69: Middle East and Africa BI in Healthcare Industry Revenue Share (%), by Mode of Delivery 2025 & 2033
- Figure 70: Middle East and Africa BI in Healthcare Industry Volume Share (%), by Mode of Delivery 2025 & 2033
- Figure 71: Middle East and Africa BI in Healthcare Industry Revenue (Million), by Application 2025 & 2033
- Figure 72: Middle East and Africa BI in Healthcare Industry Volume (K Unit), by Application 2025 & 2033
- Figure 73: Middle East and Africa BI in Healthcare Industry Revenue Share (%), by Application 2025 & 2033
- Figure 74: Middle East and Africa BI in Healthcare Industry Volume Share (%), by Application 2025 & 2033
- Figure 75: Middle East and Africa BI in Healthcare Industry Revenue (Million), by End User 2025 & 2033
- Figure 76: Middle East and Africa BI in Healthcare Industry Volume (K Unit), by End User 2025 & 2033
- Figure 77: Middle East and Africa BI in Healthcare Industry Revenue Share (%), by End User 2025 & 2033
- Figure 78: Middle East and Africa BI in Healthcare Industry Volume Share (%), by End User 2025 & 2033
- Figure 79: Middle East and Africa BI in Healthcare Industry Revenue (Million), by Country 2025 & 2033
- Figure 80: Middle East and Africa BI in Healthcare Industry Volume (K Unit), by Country 2025 & 2033
- Figure 81: Middle East and Africa BI in Healthcare Industry Revenue Share (%), by Country 2025 & 2033
- Figure 82: Middle East and Africa BI in Healthcare Industry Volume Share (%), by Country 2025 & 2033
- Figure 83: South America BI in Healthcare Industry Revenue (Million), by Component 2025 & 2033
- Figure 84: South America BI in Healthcare Industry Volume (K Unit), by Component 2025 & 2033
- Figure 85: South America BI in Healthcare Industry Revenue Share (%), by Component 2025 & 2033
- Figure 86: South America BI in Healthcare Industry Volume Share (%), by Component 2025 & 2033
- Figure 87: South America BI in Healthcare Industry Revenue (Million), by Mode of Delivery 2025 & 2033
- Figure 88: South America BI in Healthcare Industry Volume (K Unit), by Mode of Delivery 2025 & 2033
- Figure 89: South America BI in Healthcare Industry Revenue Share (%), by Mode of Delivery 2025 & 2033
- Figure 90: South America BI in Healthcare Industry Volume Share (%), by Mode of Delivery 2025 & 2033
- Figure 91: South America BI in Healthcare Industry Revenue (Million), by Application 2025 & 2033
- Figure 92: South America BI in Healthcare Industry Volume (K Unit), by Application 2025 & 2033
- Figure 93: South America BI in Healthcare Industry Revenue Share (%), by Application 2025 & 2033
- Figure 94: South America BI in Healthcare Industry Volume Share (%), by Application 2025 & 2033
- Figure 95: South America BI in Healthcare Industry Revenue (Million), by End User 2025 & 2033
- Figure 96: South America BI in Healthcare Industry Volume (K Unit), by End User 2025 & 2033
- Figure 97: South America BI in Healthcare Industry Revenue Share (%), by End User 2025 & 2033
- Figure 98: South America BI in Healthcare Industry Volume Share (%), by End User 2025 & 2033
- Figure 99: South America BI in Healthcare Industry Revenue (Million), by Country 2025 & 2033
- Figure 100: South America BI in Healthcare Industry Volume (K Unit), by Country 2025 & 2033
- Figure 101: South America BI in Healthcare Industry Revenue Share (%), by Country 2025 & 2033
- Figure 102: South America BI in Healthcare Industry Volume Share (%), by Country 2025 & 2033
List of Tables
- Table 1: Global BI in Healthcare Industry Revenue Million Forecast, by Component 2020 & 2033
- Table 2: Global BI in Healthcare Industry Volume K Unit Forecast, by Component 2020 & 2033
- Table 3: Global BI in Healthcare Industry Revenue Million Forecast, by Mode of Delivery 2020 & 2033
- Table 4: Global BI in Healthcare Industry Volume K Unit Forecast, by Mode of Delivery 2020 & 2033
- Table 5: Global BI in Healthcare Industry Revenue Million Forecast, by Application 2020 & 2033
- Table 6: Global BI in Healthcare Industry Volume K Unit Forecast, by Application 2020 & 2033
- Table 7: Global BI in Healthcare Industry Revenue Million Forecast, by End User 2020 & 2033
- Table 8: Global BI in Healthcare Industry Volume K Unit Forecast, by End User 2020 & 2033
- Table 9: Global BI in Healthcare Industry Revenue Million Forecast, by Region 2020 & 2033
- Table 10: Global BI in Healthcare Industry Volume K Unit Forecast, by Region 2020 & 2033
- Table 11: Global BI in Healthcare Industry Revenue Million Forecast, by Component 2020 & 2033
- Table 12: Global BI in Healthcare Industry Volume K Unit Forecast, by Component 2020 & 2033
- Table 13: Global BI in Healthcare Industry Revenue Million Forecast, by Mode of Delivery 2020 & 2033
- Table 14: Global BI in Healthcare Industry Volume K Unit Forecast, by Mode of Delivery 2020 & 2033
- Table 15: Global BI in Healthcare Industry Revenue Million Forecast, by Application 2020 & 2033
- Table 16: Global BI in Healthcare Industry Volume K Unit Forecast, by Application 2020 & 2033
- Table 17: Global BI in Healthcare Industry Revenue Million Forecast, by End User 2020 & 2033
- Table 18: Global BI in Healthcare Industry Volume K Unit Forecast, by End User 2020 & 2033
- Table 19: Global BI in Healthcare Industry Revenue Million Forecast, by Country 2020 & 2033
- Table 20: Global BI in Healthcare Industry Volume K Unit Forecast, by Country 2020 & 2033
- Table 21: United States BI in Healthcare Industry Revenue (Million) Forecast, by Application 2020 & 2033
- Table 22: United States BI in Healthcare Industry Volume (K Unit) Forecast, by Application 2020 & 2033
- Table 23: Canada BI in Healthcare Industry Revenue (Million) Forecast, by Application 2020 & 2033
- Table 24: Canada BI in Healthcare Industry Volume (K Unit) Forecast, by Application 2020 & 2033
- Table 25: Mexico BI in Healthcare Industry Revenue (Million) Forecast, by Application 2020 & 2033
- Table 26: Mexico BI in Healthcare Industry Volume (K Unit) Forecast, by Application 2020 & 2033
- Table 27: Global BI in Healthcare Industry Revenue Million Forecast, by Component 2020 & 2033
- Table 28: Global BI in Healthcare Industry Volume K Unit Forecast, by Component 2020 & 2033
- Table 29: Global BI in Healthcare Industry Revenue Million Forecast, by Mode of Delivery 2020 & 2033
- Table 30: Global BI in Healthcare Industry Volume K Unit Forecast, by Mode of Delivery 2020 & 2033
- Table 31: Global BI in Healthcare Industry Revenue Million Forecast, by Application 2020 & 2033
- Table 32: Global BI in Healthcare Industry Volume K Unit Forecast, by Application 2020 & 2033
- Table 33: Global BI in Healthcare Industry Revenue Million Forecast, by End User 2020 & 2033
- Table 34: Global BI in Healthcare Industry Volume K Unit Forecast, by End User 2020 & 2033
- Table 35: Global BI in Healthcare Industry Revenue Million Forecast, by Country 2020 & 2033
- Table 36: Global BI in Healthcare Industry Volume K Unit Forecast, by Country 2020 & 2033
- Table 37: Germany BI in Healthcare Industry Revenue (Million) Forecast, by Application 2020 & 2033
- Table 38: Germany BI in Healthcare Industry Volume (K Unit) Forecast, by Application 2020 & 2033
- Table 39: United Kingdom BI in Healthcare Industry Revenue (Million) Forecast, by Application 2020 & 2033
- Table 40: United Kingdom BI in Healthcare Industry Volume (K Unit) Forecast, by Application 2020 & 2033
- Table 41: France BI in Healthcare Industry Revenue (Million) Forecast, by Application 2020 & 2033
- Table 42: France BI in Healthcare Industry Volume (K Unit) Forecast, by Application 2020 & 2033
- Table 43: Italy BI in Healthcare Industry Revenue (Million) Forecast, by Application 2020 & 2033
- Table 44: Italy BI in Healthcare Industry Volume (K Unit) Forecast, by Application 2020 & 2033
- Table 45: Spain BI in Healthcare Industry Revenue (Million) Forecast, by Application 2020 & 2033
- Table 46: Spain BI in Healthcare Industry Volume (K Unit) Forecast, by Application 2020 & 2033
- Table 47: Rest of Europe BI in Healthcare Industry Revenue (Million) Forecast, by Application 2020 & 2033
- Table 48: Rest of Europe BI in Healthcare Industry Volume (K Unit) Forecast, by Application 2020 & 2033
- Table 49: Global BI in Healthcare Industry Revenue Million Forecast, by Component 2020 & 2033
- Table 50: Global BI in Healthcare Industry Volume K Unit Forecast, by Component 2020 & 2033
- Table 51: Global BI in Healthcare Industry Revenue Million Forecast, by Mode of Delivery 2020 & 2033
- Table 52: Global BI in Healthcare Industry Volume K Unit Forecast, by Mode of Delivery 2020 & 2033
- Table 53: Global BI in Healthcare Industry Revenue Million Forecast, by Application 2020 & 2033
- Table 54: Global BI in Healthcare Industry Volume K Unit Forecast, by Application 2020 & 2033
- Table 55: Global BI in Healthcare Industry Revenue Million Forecast, by End User 2020 & 2033
- Table 56: Global BI in Healthcare Industry Volume K Unit Forecast, by End User 2020 & 2033
- Table 57: Global BI in Healthcare Industry Revenue Million Forecast, by Country 2020 & 2033
- Table 58: Global BI in Healthcare Industry Volume K Unit Forecast, by Country 2020 & 2033
- Table 59: China BI in Healthcare Industry Revenue (Million) Forecast, by Application 2020 & 2033
- Table 60: China BI in Healthcare Industry Volume (K Unit) Forecast, by Application 2020 & 2033
- Table 61: Japan BI in Healthcare Industry Revenue (Million) Forecast, by Application 2020 & 2033
- Table 62: Japan BI in Healthcare Industry Volume (K Unit) Forecast, by Application 2020 & 2033
- Table 63: India BI in Healthcare Industry Revenue (Million) Forecast, by Application 2020 & 2033
- Table 64: India BI in Healthcare Industry Volume (K Unit) Forecast, by Application 2020 & 2033
- Table 65: Australia BI in Healthcare Industry Revenue (Million) Forecast, by Application 2020 & 2033
- Table 66: Australia BI in Healthcare Industry Volume (K Unit) Forecast, by Application 2020 & 2033
- Table 67: South Korea BI in Healthcare Industry Revenue (Million) Forecast, by Application 2020 & 2033
- Table 68: South Korea BI in Healthcare Industry Volume (K Unit) Forecast, by Application 2020 & 2033
- Table 69: Rest of Asia Pacific BI in Healthcare Industry Revenue (Million) Forecast, by Application 2020 & 2033
- Table 70: Rest of Asia Pacific BI in Healthcare Industry Volume (K Unit) Forecast, by Application 2020 & 2033
- Table 71: Global BI in Healthcare Industry Revenue Million Forecast, by Component 2020 & 2033
- Table 72: Global BI in Healthcare Industry Volume K Unit Forecast, by Component 2020 & 2033
- Table 73: Global BI in Healthcare Industry Revenue Million Forecast, by Mode of Delivery 2020 & 2033
- Table 74: Global BI in Healthcare Industry Volume K Unit Forecast, by Mode of Delivery 2020 & 2033
- Table 75: Global BI in Healthcare Industry Revenue Million Forecast, by Application 2020 & 2033
- Table 76: Global BI in Healthcare Industry Volume K Unit Forecast, by Application 2020 & 2033
- Table 77: Global BI in Healthcare Industry Revenue Million Forecast, by End User 2020 & 2033
- Table 78: Global BI in Healthcare Industry Volume K Unit Forecast, by End User 2020 & 2033
- Table 79: Global BI in Healthcare Industry Revenue Million Forecast, by Country 2020 & 2033
- Table 80: Global BI in Healthcare Industry Volume K Unit Forecast, by Country 2020 & 2033
- Table 81: GCC BI in Healthcare Industry Revenue (Million) Forecast, by Application 2020 & 2033
- Table 82: GCC BI in Healthcare Industry Volume (K Unit) Forecast, by Application 2020 & 2033
- Table 83: South Africa BI in Healthcare Industry Revenue (Million) Forecast, by Application 2020 & 2033
- Table 84: South Africa BI in Healthcare Industry Volume (K Unit) Forecast, by Application 2020 & 2033
- Table 85: Rest of Middle East and Africa BI in Healthcare Industry Revenue (Million) Forecast, by Application 2020 & 2033
- Table 86: Rest of Middle East and Africa BI in Healthcare Industry Volume (K Unit) Forecast, by Application 2020 & 2033
- Table 87: Global BI in Healthcare Industry Revenue Million Forecast, by Component 2020 & 2033
- Table 88: Global BI in Healthcare Industry Volume K Unit Forecast, by Component 2020 & 2033
- Table 89: Global BI in Healthcare Industry Revenue Million Forecast, by Mode of Delivery 2020 & 2033
- Table 90: Global BI in Healthcare Industry Volume K Unit Forecast, by Mode of Delivery 2020 & 2033
- Table 91: Global BI in Healthcare Industry Revenue Million Forecast, by Application 2020 & 2033
- Table 92: Global BI in Healthcare Industry Volume K Unit Forecast, by Application 2020 & 2033
- Table 93: Global BI in Healthcare Industry Revenue Million Forecast, by End User 2020 & 2033
- Table 94: Global BI in Healthcare Industry Volume K Unit Forecast, by End User 2020 & 2033
- Table 95: Global BI in Healthcare Industry Revenue Million Forecast, by Country 2020 & 2033
- Table 96: Global BI in Healthcare Industry Volume K Unit Forecast, by Country 2020 & 2033
- Table 97: Brazil BI in Healthcare Industry Revenue (Million) Forecast, by Application 2020 & 2033
- Table 98: Brazil BI in Healthcare Industry Volume (K Unit) Forecast, by Application 2020 & 2033
- Table 99: Argentina BI in Healthcare Industry Revenue (Million) Forecast, by Application 2020 & 2033
- Table 100: Argentina BI in Healthcare Industry Volume (K Unit) Forecast, by Application 2020 & 2033
- Table 101: Rest of South America BI in Healthcare Industry Revenue (Million) Forecast, by Application 2020 & 2033
- Table 102: Rest of South America BI in Healthcare Industry Volume (K Unit) Forecast, by Application 2020 & 2033
Frequently Asked Questions
1. What is the projected Compound Annual Growth Rate (CAGR) of the BI in Healthcare Industry?
The projected CAGR is approximately 14.41%.
2. Which companies are prominent players in the BI in Healthcare Industry?
Key companies in the market include SAS Institute Inc, Infor Inc, IBM Corporation, MicroStrategy Incorporated, Microsoft Corporation, CareCloud Inc, EPIC SYSTEMS, QlikTech International AB, Information Builders, Oracle Corporation, Salesforce, Sisense Inc, Domo Inc , SAP SE.
3. What are the main segments of the BI in Healthcare Industry?
The market segments include Component, Mode of Delivery, Application, End User.
4. Can you provide details about the market size?
The market size is estimated to be USD 10.17 Million as of 2022.
5. What are some drivers contributing to market growth?
Growing Government Initiatives for Healthcare Digitalization. Like Adoption of EHR; Increasing Number of Patient Registries; The Emergence of Big Data in the Healthcare Industry.
6. What are the notable trends driving market growth?
Cloud-based Model is Expected to Grow Significantly in the Healthcare BI Market Over the Forecast Period.
7. Are there any restraints impacting market growth?
High Cost of Implementation; Lack of Skilled Professionals.
8. Can you provide examples of recent developments in the market?
Jun 2022: Oracle Corporation completed the acquisition of Cerner Corporation, a supplier of health information technology services.
9. What pricing options are available for accessing the report?
Pricing options include single-user, multi-user, and enterprise licenses priced at USD 4750, USD 5250, and USD 8750 respectively.
10. Is the market size provided in terms of value or volume?
The market size is provided in terms of value, measured in Million and volume, measured in K Unit.
11. Are there any specific market keywords associated with the report?
Yes, the market keyword associated with the report is "BI in Healthcare Industry," which aids in identifying and referencing the specific market segment covered.
12. How do I determine which pricing option suits my needs best?
The pricing options vary based on user requirements and access needs. Individual users may opt for single-user licenses, while businesses requiring broader access may choose multi-user or enterprise licenses for cost-effective access to the report.
13. Are there any additional resources or data provided in the BI in Healthcare Industry report?
While the report offers comprehensive insights, it's advisable to review the specific contents or supplementary materials provided to ascertain if additional resources or data are available.
14. How can I stay updated on further developments or reports in the BI in Healthcare Industry?
To stay informed about further developments, trends, and reports in the BI in Healthcare Industry, consider subscribing to industry newsletters, following relevant companies and organizations, or regularly checking reputable industry news sources and publications.
Methodology
Step 1 - Identification of Relevant Samples Size from Population Database


Step 2 - Approaches for Defining Global Market Size (Value, Volume* & Price*)

Note*: In applicable scenarios
Step 3 - Data Sources
Primary Research
- Web Analytics
- Survey Reports
- Research Institute
- Latest Research Reports
- Opinion Leaders
Secondary Research
- Annual Reports
- White Paper
- Latest Press Release
- Industry Association
- Paid Database
- Investor Presentations

Step 4 - Data Triangulation
Involves using different sources of information in order to increase the validity of a study
These sources are likely to be stakeholders in a program - participants, other researchers, program staff, other community members, and so on.
Then we put all data in single framework & apply various statistical tools to find out the dynamic on the market.
During the analysis stage, feedback from the stakeholder groups would be compared to determine areas of agreement as well as areas of divergence