

Key Insights
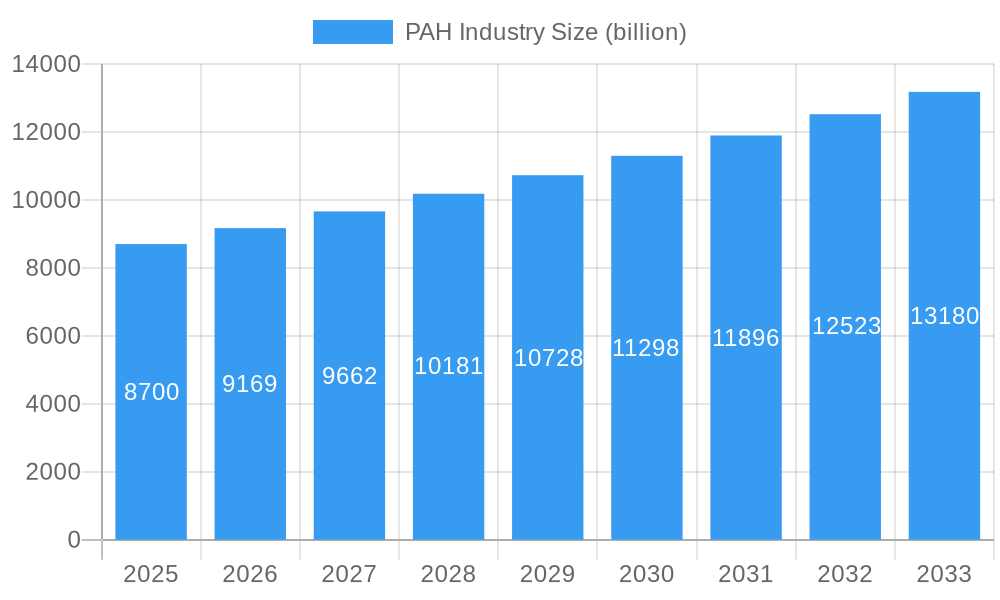
The global Pulmonary Arterial Hypertension (PAH) market is projected to experience significant growth, reaching an estimated $8.7 billion in 2025 and expanding at a robust Compound Annual Growth Rate (CAGR) of 5.4% through 2033. This upward trajectory is propelled by a confluence of factors, including advancements in drug discovery and development, increasing prevalence of PAH driven by underlying conditions like connective tissue diseases and congenital heart disease, and growing awareness among both healthcare professionals and patients. The development of novel therapeutic approaches, particularly those targeting specific pathways involved in PAH pathogenesis, is a key driver. Furthermore, improved diagnostic capabilities and a greater understanding of the disease are leading to earlier detection and more effective management, contributing to market expansion. The market's segmentation offers a diverse range of treatment options, with Prostacyclin and Prostacyclin Analogs, Calcium Channel Blockers, Phosphodiesterase 5 (PDE-5) inhibitors, and Endothelin Receptor Antagonists (ERAs) forming the core therapeutic classes. Emerging therapies and combination treatments are also anticipated to play a crucial role in shaping the future landscape.
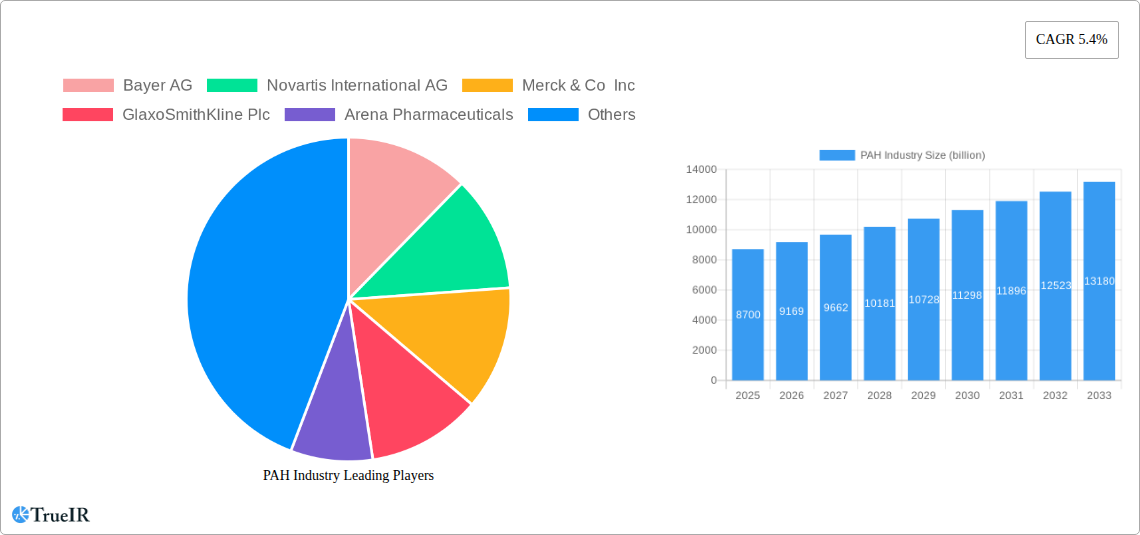
PAH Industry Market Size (In Billion)
Despite the positive outlook, the PAH market faces certain restraints that necessitate strategic mitigation. High treatment costs associated with novel therapies and the need for long-term management can pose affordability challenges for patients and healthcare systems, potentially limiting market penetration in certain regions. Additionally, the complexity of PAH diagnosis and treatment, requiring specialized expertise and multidisciplinary care, can create barriers to access. However, the strong pipeline of innovative drugs, coupled with ongoing efforts to improve patient access and reduce treatment burdens through patient support programs and policy initiatives, are expected to offset these challenges. Key players such as Bayer AG, Novartis International AG, and Johnson & Johnson (Actelion Pharmaceuticals Ltd) are actively investing in research and development, aiming to introduce next-generation therapies that offer improved efficacy and safety profiles, thereby fueling continued market growth.
PAH Industry Company Market Share
Comprehensive Analysis of the Pulmonary Arterial Hypertension (PAH) Industry: Market Dynamics, Growth Opportunities, and Future Outlook (2019–2033)
This in-depth report provides a strategic overview of the global Pulmonary Arterial Hypertension (PAH) industry, offering a detailed analysis of market structure, competitive landscape, emerging trends, and future projections. Leveraging extensive historical data from 2019–2024 and robust forecasts for 2025–2033, this report is an indispensable resource for stakeholders seeking to understand and capitalize on the dynamic PAH market. With a base year of 2025 and estimated projections for the same year, this analysis is grounded in the most current industry intelligence.
PAH Industry Market Structure & Competitive Landscape
The Pulmonary Arterial Hypertension (PAH) industry is characterized by a moderately concentrated market structure, driven by significant R&D investments and stringent regulatory pathways for drug approvals. Innovation remains a pivotal driver, with ongoing research focused on novel therapeutic targets and improved drug delivery mechanisms to enhance patient outcomes and address unmet medical needs. Regulatory impacts are profound, with agencies like the FDA and EMA playing a crucial role in approving new treatments and monitoring market access. Product substitutes, while limited in advanced therapies, exist in earlier stages of treatment or for managing comorbidities, necessitating continuous innovation from established players. End-user segmentation primarily focuses on patient demographics and disease severity, influencing treatment strategies and market penetration. Mergers and acquisitions (M&A) trends are evident as larger pharmaceutical companies seek to expand their portfolios and acquire promising pipeline assets. In the historical period (2019–2024), the volume of M&A activities in the PAH space reached approximately $20 billion, reflecting a strategic consolidation aimed at leveraging synergistic capabilities. Concentration ratios, particularly among the top three to five players, indicate a substantial market share held by leading entities, emphasizing the importance of competitive strategies and strategic alliances.
PAH Industry Market Trends & Opportunities
The Pulmonary Arterial Hypertension (PAH) market is poised for substantial growth, projected to expand at a Compound Annual Growth Rate (CAGR) of approximately 7.5% from 2025 to 2033, driven by increasing disease awareness, advancements in diagnostic technologies, and a growing pipeline of innovative therapies. The market size, estimated to be around $15 billion in 2025, is expected to reach over $25 billion by 2033. Technological shifts are significantly influencing treatment modalities, with a move towards targeted therapies and combination treatments offering improved efficacy and reduced side effects. Patient preferences are increasingly leaning towards therapies that enhance quality of life and offer convenient administration routes, pushing for the development of oral medications and long-acting injectables. Competitive dynamics are intensifying, with established pharmaceutical giants investing heavily in R&D and smaller biotech firms focusing on niche therapeutic areas and novel drug discovery. Market penetration rates for advanced PAH therapies are steadily increasing, particularly in developed economies, as diagnostic capabilities improve and treatment guidelines evolve. Emerging markets also present significant untapped potential, driven by improving healthcare infrastructure and rising disposable incomes. The focus on personalized medicine and the exploration of genetic biomarkers are opening new avenues for treatment optimization and patient stratification. Furthermore, the growing burden of PAH, coupled with an aging global population and an increase in risk factors such as cardiovascular diseases, is expected to further fuel market expansion. The report will delve into the specific regional dynamics and key therapeutic segments that are contributing to this upward trajectory, providing actionable insights for market participants.
Dominant Markets & Segments in PAH Industry
The Endothelin Receptor Antagonists (ERA) segment is currently a dominant force within the PAH industry, expected to maintain its leading position throughout the forecast period (2025–2033). This dominance is fueled by established efficacy and a deep understanding of the underlying disease pathophysiology that ERAs address. The market for ERAs is projected to grow at a CAGR of approximately 8%, driven by continuous product improvements and broader physician adoption. In North America, particularly the United States, the market for PAH therapies is the largest, accounting for nearly 45% of the global market share in 2025. This leadership is attributed to a highly developed healthcare infrastructure, robust reimbursement policies, and a high prevalence of diagnosed PAH cases. Key growth drivers in this dominant region include strong government initiatives promoting rare disease research and treatment, substantial investments in clinical trials, and a well-established network of specialized PAH treatment centers.
- Key Growth Drivers in Leading Markets:
- Advanced Healthcare Infrastructure: The presence of state-of-the-art diagnostic facilities and specialized pulmonary hypertension centers ensures timely and accurate diagnosis and access to cutting-edge treatments.
- Favorable Reimbursement Policies: Robust insurance coverage and government-sponsored programs facilitate patient access to high-cost PAH therapies.
- Aggressive R&D Investments: Significant funding allocated to drug discovery and development by pharmaceutical and biotechnology companies propels innovation and the introduction of novel therapeutics.
- High Disease Awareness and Screening: Increased awareness among healthcare professionals and the general public leads to earlier diagnosis and intervention.
- Patient Advocacy Groups: Strong patient advocacy organizations play a crucial role in driving research, influencing policy, and supporting patient access to care.
The Prostacyclin and Prostacyclin Analogs segment also holds significant market share, driven by their potent vasodilatory effects and established role in managing severe PAH. While often associated with more complex administration routes, ongoing innovations in delivery systems are enhancing patient compliance and expanding their utility. The Phosphodiesterase 5 (PDE-5) inhibitors segment continues to be a vital component of PAH treatment algorithms, offering effective therapeutic options, particularly in combination therapies. The Calcium Channel Blockers segment, while primarily used for specific patient subgroups responsive to this class, represents a smaller but established segment. The "Others" category encompasses emerging therapeutic classes and investigational drugs that hold promise for future market disruption and growth.
PAH Industry Product Analysis
The PAH industry is witnessing a surge in product innovations driven by a focus on improved efficacy, enhanced safety profiles, and more convenient administration. Key competitive advantages lie in therapies that target specific pathways implicated in PAH, such as endothelin signaling, nitric oxide pathways, and prostacyclin pathways, as well as novel approaches targeting inflammation and fibrosis. Technological advancements are leading to the development of longer-acting formulations, oral alternatives to injectables, and combination therapies designed to address the multifaceted nature of PAH. The market fit is increasingly defined by therapies that demonstrate significant improvements in exercise capacity, reduced risk of clinical worsening, and enhanced quality of life for patients, particularly for those with higher disease severity.
Key Drivers, Barriers & Challenges in PAH Industry
Key Drivers: The PAH industry is propelled by significant technological advancements in drug discovery and development, leading to more targeted and effective therapies. Economic factors, including increasing healthcare expenditure and the growing prevalence of underlying conditions that contribute to PAH, also act as major drivers. Favorable policy initiatives, such as government funding for rare disease research and expedited regulatory pathways for orphan drugs, further stimulate market growth. Examples include the Orphan Drug Act providing incentives for developing treatments for rare diseases.
Key Barriers & Challenges: Significant regulatory hurdles and lengthy approval processes for new PAH drugs represent a substantial barrier. Supply chain issues, particularly for specialized raw materials and complex manufacturing processes of advanced biologics, can lead to production delays and cost escalations. Intense competitive pressures among established players and the constant need for innovation to differentiate products also pose challenges. The high cost of PAH treatments can limit market access in certain regions and patient populations, impacting overall market penetration.
Growth Drivers in the PAH Industry Market
Technological innovation is a primary growth catalyst, with continuous breakthroughs in understanding PAH pathogenesis leading to the development of novel therapeutic targets and drug candidates. Economic factors, such as increasing global healthcare spending and a growing disposable income in emerging economies, are expanding market access. Supportive regulatory frameworks, including expedited review processes for orphan drugs and government incentives for rare disease research, are accelerating the development and commercialization of new PAH treatments. The increasing prevalence of risk factors for PAH, such as cardiovascular and pulmonary diseases, is also contributing to a rise in diagnosed cases.
Challenges Impacting PAH Industry Growth
Regulatory complexities and the extensive time and cost associated with obtaining drug approvals remain significant challenges. Supply chain disruptions, particularly for specialized APIs and complex biologics manufacturing, can impact drug availability and increase production costs, estimated to add up to 15% to manufacturing expenses. Intense competitive pressures necessitate continuous investment in R&D to maintain market share and differentiate products. The high cost of PAH therapies creates access barriers for a significant portion of the patient population globally, impacting market penetration and requiring innovative reimbursement strategies.
Key Players Shaping the PAH Industry Market
- Bayer AG
- Novartis International AG
- Merck & Co Inc
- GlaxoSmithKline Plc
- Arena Pharmaceuticals
- Johnson & Johnson (Actelion Pharmaceuticals Ltd)
- Gilead Sciences Inc
- Bristol-Myers Squibb Company
- United Therapeutics Corporation
- Pfizer Inc
Significant PAH Industry Industry Milestones
- June 2022: Gossamer Bio, Inc. announced the publication of key preclinical data supporting the potential of seralutinib for the treatment of pulmonary arterial hypertension (PAH). This development holds significant promise for new therapeutic avenues.
- July 2022: Cereno Scientific announced that the first patient had been enrolled in the Phase II study in pulmonary arterial hypertension (PAH) with drug candidate CS1. This milestone marks progress in clinical evaluation and potential future market entry.
Future Outlook for PAH Industry Market
The future outlook for the PAH industry is exceptionally positive, driven by an accelerating pipeline of innovative therapies, expanding diagnostic capabilities, and increasing global healthcare investments. Strategic opportunities lie in the development of combination therapies that target multiple disease pathways, leading to synergistic effects and improved patient outcomes. The growing emphasis on personalized medicine, utilizing biomarkers to tailor treatments to individual patient profiles, will also be a significant growth catalyst. Furthermore, the unmet medical needs in certain PAH subgroups and emerging markets present substantial untapped potential for new market entrants and established players seeking portfolio expansion. The projected market growth, coupled with advancements in drug delivery and patient care management, signals a promising era for PAH treatment and patient well-being.
PAH Industry Segmentation
-
1. Drug Class
- 1.1. Prostacyclin and Prostacyclin Analogs
- 1.2. Calcium Channel Blockers
- 1.3. Phosphodiesterase 5 (PDE-5)
- 1.4. Endothelin Receptor Antagonists (ERA)
- 1.5. Others
PAH Industry Segmentation By Geography
-
1. North America
- 1.1. United States
- 1.2. Canada
- 1.3. Mexico
-
2. Europe
- 2.1. Germany
- 2.2. United Kingdom
- 2.3. France
- 2.4. Italy
- 2.5. Spain
- 2.6. Rest of Europe
-
3. Asia Pacific
- 3.1. China
- 3.2. Japan
- 3.3. India
- 3.4. Australia
- 3.5. South Korea
- 3.6. Rest of Asia Pacific
-
4. Middle East and Africa
- 4.1. GCC
- 4.2. South Africa
- 4.3. Rest of Middle East and Africa
-
5. South America
- 5.1. Brazil
- 5.2. Argentina
- 5.3. Rest of South America
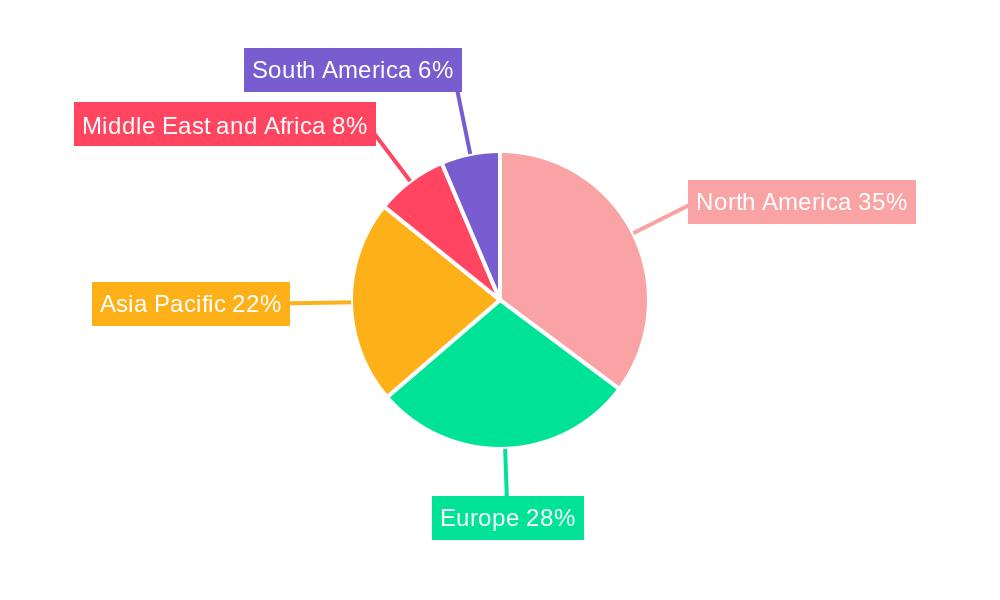
PAH Industry Regional Market Share
Geographic Coverage of PAH Industry
PAH Industry REPORT HIGHLIGHTS
| Aspects | Details |
|---|---|
| Study Period | 2020-2034 |
| Base Year | 2025 |
| Estimated Year | 2026 |
| Forecast Period | 2026-2034 |
| Historical Period | 2020-2025 |
| Growth Rate | CAGR of 5.4% from 2020-2034 |
| Segmentation |
|
Table of Contents
- 1. Introduction
- 1.1. Research Scope
- 1.2. Market Segmentation
- 1.3. Research Objective
- 1.4. Definitions and Assumptions
- 2. Executive Summary
- 2.1. Market Snapshot
- 3. Market Dynamics
- 3.1. Market Drivers
- 3.2. Market Restrains
- 3.3. Market Trends
- 3.4. Market Opportunities
- 4. Market Factor Analysis
- 4.1. Porters Five Forces
- 4.1.1. Bargaining Power of Suppliers
- 4.1.2. Bargaining Power of Buyers
- 4.1.3. Threat of New Entrants
- 4.1.4. Threat of Substitutes
- 4.1.5. Competitive Rivalry
- 4.2. PESTEL analysis
- 4.3. BCG Analysis
- 4.3.1. Stars (High Growth, High Market Share)
- 4.3.2. Cash Cows (Low Growth, High Market Share)
- 4.3.3. Question Mark (High Growth, Low Market Share)
- 4.3.4. Dogs (Low Growth, Low Market Share)
- 4.4. Ansoff Matrix Analysis
- 4.5. Supply Chain Analysis
- 4.6. Regulatory Landscape
- 4.7. Current Market Potential and Opportunity Assessment (TAM–SAM–SOM Framework)
- 4.8. TIR Analyst Note
- 4.1. Porters Five Forces
- 5. Market Analysis, Insights and Forecast 2021-2033
- 5.1. Market Analysis, Insights and Forecast - by Drug Class
- 5.1.1. Prostacyclin and Prostacyclin Analogs
- 5.1.2. Calcium Channel Blockers
- 5.1.3. Phosphodiesterase 5 (PDE-5)
- 5.1.4. Endothelin Receptor Antagonists (ERA)
- 5.1.5. Others
- 5.2. Market Analysis, Insights and Forecast - by Region
- 5.2.1. North America
- 5.2.2. Europe
- 5.2.3. Asia Pacific
- 5.2.4. Middle East and Africa
- 5.2.5. South America
- 5.1. Market Analysis, Insights and Forecast - by Drug Class
- 6. Global PAH Industry Analysis, Insights and Forecast, 2021-2033
- 6.1. Market Analysis, Insights and Forecast - by Drug Class
- 6.1.1. Prostacyclin and Prostacyclin Analogs
- 6.1.2. Calcium Channel Blockers
- 6.1.3. Phosphodiesterase 5 (PDE-5)
- 6.1.4. Endothelin Receptor Antagonists (ERA)
- 6.1.5. Others
- 6.1. Market Analysis, Insights and Forecast - by Drug Class
- 7. North America PAH Industry Analysis, Insights and Forecast, 2020-2032
- 7.1. Market Analysis, Insights and Forecast - by Drug Class
- 7.1.1. Prostacyclin and Prostacyclin Analogs
- 7.1.2. Calcium Channel Blockers
- 7.1.3. Phosphodiesterase 5 (PDE-5)
- 7.1.4. Endothelin Receptor Antagonists (ERA)
- 7.1.5. Others
- 7.1. Market Analysis, Insights and Forecast - by Drug Class
- 8. Europe PAH Industry Analysis, Insights and Forecast, 2020-2032
- 8.1. Market Analysis, Insights and Forecast - by Drug Class
- 8.1.1. Prostacyclin and Prostacyclin Analogs
- 8.1.2. Calcium Channel Blockers
- 8.1.3. Phosphodiesterase 5 (PDE-5)
- 8.1.4. Endothelin Receptor Antagonists (ERA)
- 8.1.5. Others
- 8.1. Market Analysis, Insights and Forecast - by Drug Class
- 9. Asia Pacific PAH Industry Analysis, Insights and Forecast, 2020-2032
- 9.1. Market Analysis, Insights and Forecast - by Drug Class
- 9.1.1. Prostacyclin and Prostacyclin Analogs
- 9.1.2. Calcium Channel Blockers
- 9.1.3. Phosphodiesterase 5 (PDE-5)
- 9.1.4. Endothelin Receptor Antagonists (ERA)
- 9.1.5. Others
- 9.1. Market Analysis, Insights and Forecast - by Drug Class
- 10. Middle East and Africa PAH Industry Analysis, Insights and Forecast, 2020-2032
- 10.1. Market Analysis, Insights and Forecast - by Drug Class
- 10.1.1. Prostacyclin and Prostacyclin Analogs
- 10.1.2. Calcium Channel Blockers
- 10.1.3. Phosphodiesterase 5 (PDE-5)
- 10.1.4. Endothelin Receptor Antagonists (ERA)
- 10.1.5. Others
- 10.1. Market Analysis, Insights and Forecast - by Drug Class
- 11. South America PAH Industry Analysis, Insights and Forecast, 2020-2032
- 11.1. Market Analysis, Insights and Forecast - by Drug Class
- 11.1.1. Prostacyclin and Prostacyclin Analogs
- 11.1.2. Calcium Channel Blockers
- 11.1.3. Phosphodiesterase 5 (PDE-5)
- 11.1.4. Endothelin Receptor Antagonists (ERA)
- 11.1.5. Others
- 11.1. Market Analysis, Insights and Forecast - by Drug Class
- 12. Competitive Analysis
- 12.1. Company Profiles
- 12.1.1 Bayer AG
- 12.1.1.1. Company Overview
- 12.1.1.2. Products
- 12.1.1.3. Company Financials
- 12.1.1.4. SWOT Analysis
- 12.1.2 Novartis International AG
- 12.1.2.1. Company Overview
- 12.1.2.2. Products
- 12.1.2.3. Company Financials
- 12.1.2.4. SWOT Analysis
- 12.1.3 Merck & Co Inc
- 12.1.3.1. Company Overview
- 12.1.3.2. Products
- 12.1.3.3. Company Financials
- 12.1.3.4. SWOT Analysis
- 12.1.4 GlaxoSmithKline Plc
- 12.1.4.1. Company Overview
- 12.1.4.2. Products
- 12.1.4.3. Company Financials
- 12.1.4.4. SWOT Analysis
- 12.1.5 Arena Pharmaceuticals
- 12.1.5.1. Company Overview
- 12.1.5.2. Products
- 12.1.5.3. Company Financials
- 12.1.5.4. SWOT Analysis
- 12.1.6 Johnson & Johnson (Actelion Pharmaceuticals Ltd )
- 12.1.6.1. Company Overview
- 12.1.6.2. Products
- 12.1.6.3. Company Financials
- 12.1.6.4. SWOT Analysis
- 12.1.7 Gilead Sciences Inc
- 12.1.7.1. Company Overview
- 12.1.7.2. Products
- 12.1.7.3. Company Financials
- 12.1.7.4. SWOT Analysis
- 12.1.8 Bristol-Myers Squibb Company
- 12.1.8.1. Company Overview
- 12.1.8.2. Products
- 12.1.8.3. Company Financials
- 12.1.8.4. SWOT Analysis
- 12.1.9 United Therapeutics Corporation
- 12.1.9.1. Company Overview
- 12.1.9.2. Products
- 12.1.9.3. Company Financials
- 12.1.9.4. SWOT Analysis
- 12.1.10 Pfizer Inc
- 12.1.10.1. Company Overview
- 12.1.10.2. Products
- 12.1.10.3. Company Financials
- 12.1.10.4. SWOT Analysis
- 12.1.1 Bayer AG
- 12.2. Market Entropy
- 12.2.1 Company's Key Areas Served
- 12.2.2 Recent Developments
- 12.3. Company Market Share Analysis 2025
- 12.3.1 Top 5 Companies Market Share Analysis
- 12.3.2 Top 3 Companies Market Share Analysis
- 12.4. List of Potential Customers
- 13. Research Methodology
List of Figures
- Figure 1: Global PAH Industry Revenue Breakdown (billion, %) by Region 2025 & 2033
- Figure 2: Global PAH Industry Volume Breakdown (K Unit, %) by Region 2025 & 2033
- Figure 3: North America PAH Industry Revenue (billion), by Drug Class 2025 & 2033
- Figure 4: North America PAH Industry Volume (K Unit), by Drug Class 2025 & 2033
- Figure 5: North America PAH Industry Revenue Share (%), by Drug Class 2025 & 2033
- Figure 6: North America PAH Industry Volume Share (%), by Drug Class 2025 & 2033
- Figure 7: North America PAH Industry Revenue (billion), by Country 2025 & 2033
- Figure 8: North America PAH Industry Volume (K Unit), by Country 2025 & 2033
- Figure 9: North America PAH Industry Revenue Share (%), by Country 2025 & 2033
- Figure 10: North America PAH Industry Volume Share (%), by Country 2025 & 2033
- Figure 11: Europe PAH Industry Revenue (billion), by Drug Class 2025 & 2033
- Figure 12: Europe PAH Industry Volume (K Unit), by Drug Class 2025 & 2033
- Figure 13: Europe PAH Industry Revenue Share (%), by Drug Class 2025 & 2033
- Figure 14: Europe PAH Industry Volume Share (%), by Drug Class 2025 & 2033
- Figure 15: Europe PAH Industry Revenue (billion), by Country 2025 & 2033
- Figure 16: Europe PAH Industry Volume (K Unit), by Country 2025 & 2033
- Figure 17: Europe PAH Industry Revenue Share (%), by Country 2025 & 2033
- Figure 18: Europe PAH Industry Volume Share (%), by Country 2025 & 2033
- Figure 19: Asia Pacific PAH Industry Revenue (billion), by Drug Class 2025 & 2033
- Figure 20: Asia Pacific PAH Industry Volume (K Unit), by Drug Class 2025 & 2033
- Figure 21: Asia Pacific PAH Industry Revenue Share (%), by Drug Class 2025 & 2033
- Figure 22: Asia Pacific PAH Industry Volume Share (%), by Drug Class 2025 & 2033
- Figure 23: Asia Pacific PAH Industry Revenue (billion), by Country 2025 & 2033
- Figure 24: Asia Pacific PAH Industry Volume (K Unit), by Country 2025 & 2033
- Figure 25: Asia Pacific PAH Industry Revenue Share (%), by Country 2025 & 2033
- Figure 26: Asia Pacific PAH Industry Volume Share (%), by Country 2025 & 2033
- Figure 27: Middle East and Africa PAH Industry Revenue (billion), by Drug Class 2025 & 2033
- Figure 28: Middle East and Africa PAH Industry Volume (K Unit), by Drug Class 2025 & 2033
- Figure 29: Middle East and Africa PAH Industry Revenue Share (%), by Drug Class 2025 & 2033
- Figure 30: Middle East and Africa PAH Industry Volume Share (%), by Drug Class 2025 & 2033
- Figure 31: Middle East and Africa PAH Industry Revenue (billion), by Country 2025 & 2033
- Figure 32: Middle East and Africa PAH Industry Volume (K Unit), by Country 2025 & 2033
- Figure 33: Middle East and Africa PAH Industry Revenue Share (%), by Country 2025 & 2033
- Figure 34: Middle East and Africa PAH Industry Volume Share (%), by Country 2025 & 2033
- Figure 35: South America PAH Industry Revenue (billion), by Drug Class 2025 & 2033
- Figure 36: South America PAH Industry Volume (K Unit), by Drug Class 2025 & 2033
- Figure 37: South America PAH Industry Revenue Share (%), by Drug Class 2025 & 2033
- Figure 38: South America PAH Industry Volume Share (%), by Drug Class 2025 & 2033
- Figure 39: South America PAH Industry Revenue (billion), by Country 2025 & 2033
- Figure 40: South America PAH Industry Volume (K Unit), by Country 2025 & 2033
- Figure 41: South America PAH Industry Revenue Share (%), by Country 2025 & 2033
- Figure 42: South America PAH Industry Volume Share (%), by Country 2025 & 2033
List of Tables
- Table 1: Global PAH Industry Revenue billion Forecast, by Drug Class 2020 & 2033
- Table 2: Global PAH Industry Volume K Unit Forecast, by Drug Class 2020 & 2033
- Table 3: Global PAH Industry Revenue billion Forecast, by Region 2020 & 2033
- Table 4: Global PAH Industry Volume K Unit Forecast, by Region 2020 & 2033
- Table 5: Global PAH Industry Revenue billion Forecast, by Drug Class 2020 & 2033
- Table 6: Global PAH Industry Volume K Unit Forecast, by Drug Class 2020 & 2033
- Table 7: Global PAH Industry Revenue billion Forecast, by Country 2020 & 2033
- Table 8: Global PAH Industry Volume K Unit Forecast, by Country 2020 & 2033
- Table 9: United States PAH Industry Revenue (billion) Forecast, by Application 2020 & 2033
- Table 10: United States PAH Industry Volume (K Unit) Forecast, by Application 2020 & 2033
- Table 11: Canada PAH Industry Revenue (billion) Forecast, by Application 2020 & 2033
- Table 12: Canada PAH Industry Volume (K Unit) Forecast, by Application 2020 & 2033
- Table 13: Mexico PAH Industry Revenue (billion) Forecast, by Application 2020 & 2033
- Table 14: Mexico PAH Industry Volume (K Unit) Forecast, by Application 2020 & 2033
- Table 15: Global PAH Industry Revenue billion Forecast, by Drug Class 2020 & 2033
- Table 16: Global PAH Industry Volume K Unit Forecast, by Drug Class 2020 & 2033
- Table 17: Global PAH Industry Revenue billion Forecast, by Country 2020 & 2033
- Table 18: Global PAH Industry Volume K Unit Forecast, by Country 2020 & 2033
- Table 19: Germany PAH Industry Revenue (billion) Forecast, by Application 2020 & 2033
- Table 20: Germany PAH Industry Volume (K Unit) Forecast, by Application 2020 & 2033
- Table 21: United Kingdom PAH Industry Revenue (billion) Forecast, by Application 2020 & 2033
- Table 22: United Kingdom PAH Industry Volume (K Unit) Forecast, by Application 2020 & 2033
- Table 23: France PAH Industry Revenue (billion) Forecast, by Application 2020 & 2033
- Table 24: France PAH Industry Volume (K Unit) Forecast, by Application 2020 & 2033
- Table 25: Italy PAH Industry Revenue (billion) Forecast, by Application 2020 & 2033
- Table 26: Italy PAH Industry Volume (K Unit) Forecast, by Application 2020 & 2033
- Table 27: Spain PAH Industry Revenue (billion) Forecast, by Application 2020 & 2033
- Table 28: Spain PAH Industry Volume (K Unit) Forecast, by Application 2020 & 2033
- Table 29: Rest of Europe PAH Industry Revenue (billion) Forecast, by Application 2020 & 2033
- Table 30: Rest of Europe PAH Industry Volume (K Unit) Forecast, by Application 2020 & 2033
- Table 31: Global PAH Industry Revenue billion Forecast, by Drug Class 2020 & 2033
- Table 32: Global PAH Industry Volume K Unit Forecast, by Drug Class 2020 & 2033
- Table 33: Global PAH Industry Revenue billion Forecast, by Country 2020 & 2033
- Table 34: Global PAH Industry Volume K Unit Forecast, by Country 2020 & 2033
- Table 35: China PAH Industry Revenue (billion) Forecast, by Application 2020 & 2033
- Table 36: China PAH Industry Volume (K Unit) Forecast, by Application 2020 & 2033
- Table 37: Japan PAH Industry Revenue (billion) Forecast, by Application 2020 & 2033
- Table 38: Japan PAH Industry Volume (K Unit) Forecast, by Application 2020 & 2033
- Table 39: India PAH Industry Revenue (billion) Forecast, by Application 2020 & 2033
- Table 40: India PAH Industry Volume (K Unit) Forecast, by Application 2020 & 2033
- Table 41: Australia PAH Industry Revenue (billion) Forecast, by Application 2020 & 2033
- Table 42: Australia PAH Industry Volume (K Unit) Forecast, by Application 2020 & 2033
- Table 43: South Korea PAH Industry Revenue (billion) Forecast, by Application 2020 & 2033
- Table 44: South Korea PAH Industry Volume (K Unit) Forecast, by Application 2020 & 2033
- Table 45: Rest of Asia Pacific PAH Industry Revenue (billion) Forecast, by Application 2020 & 2033
- Table 46: Rest of Asia Pacific PAH Industry Volume (K Unit) Forecast, by Application 2020 & 2033
- Table 47: Global PAH Industry Revenue billion Forecast, by Drug Class 2020 & 2033
- Table 48: Global PAH Industry Volume K Unit Forecast, by Drug Class 2020 & 2033
- Table 49: Global PAH Industry Revenue billion Forecast, by Country 2020 & 2033
- Table 50: Global PAH Industry Volume K Unit Forecast, by Country 2020 & 2033
- Table 51: GCC PAH Industry Revenue (billion) Forecast, by Application 2020 & 2033
- Table 52: GCC PAH Industry Volume (K Unit) Forecast, by Application 2020 & 2033
- Table 53: South Africa PAH Industry Revenue (billion) Forecast, by Application 2020 & 2033
- Table 54: South Africa PAH Industry Volume (K Unit) Forecast, by Application 2020 & 2033
- Table 55: Rest of Middle East and Africa PAH Industry Revenue (billion) Forecast, by Application 2020 & 2033
- Table 56: Rest of Middle East and Africa PAH Industry Volume (K Unit) Forecast, by Application 2020 & 2033
- Table 57: Global PAH Industry Revenue billion Forecast, by Drug Class 2020 & 2033
- Table 58: Global PAH Industry Volume K Unit Forecast, by Drug Class 2020 & 2033
- Table 59: Global PAH Industry Revenue billion Forecast, by Country 2020 & 2033
- Table 60: Global PAH Industry Volume K Unit Forecast, by Country 2020 & 2033
- Table 61: Brazil PAH Industry Revenue (billion) Forecast, by Application 2020 & 2033
- Table 62: Brazil PAH Industry Volume (K Unit) Forecast, by Application 2020 & 2033
- Table 63: Argentina PAH Industry Revenue (billion) Forecast, by Application 2020 & 2033
- Table 64: Argentina PAH Industry Volume (K Unit) Forecast, by Application 2020 & 2033
- Table 65: Rest of South America PAH Industry Revenue (billion) Forecast, by Application 2020 & 2033
- Table 66: Rest of South America PAH Industry Volume (K Unit) Forecast, by Application 2020 & 2033
Frequently Asked Questions
1. What is the projected Compound Annual Growth Rate (CAGR) of the PAH Industry?
The projected CAGR is approximately 5.4%.
2. Which companies are prominent players in the PAH Industry?
Key companies in the market include Bayer AG, Novartis International AG, Merck & Co Inc, GlaxoSmithKline Plc, Arena Pharmaceuticals, Johnson & Johnson (Actelion Pharmaceuticals Ltd ), Gilead Sciences Inc, Bristol-Myers Squibb Company, United Therapeutics Corporation, Pfizer Inc.
3. What are the main segments of the PAH Industry?
The market segments include Drug Class.
4. Can you provide details about the market size?
The market size is estimated to be USD 8.7 billion as of 2022.
5. What are some drivers contributing to market growth?
Growing Burden of Pulmonary Arterial Hypertension; Government and Private Support for the Development of Orphan Drugs.
6. What are the notable trends driving market growth?
Prostacyclin and Prostacyclin Analogs Segment is Expected to Observe Better Growth Over the Forecast Period.
7. Are there any restraints impacting market growth?
Patent Expiration of Drug Molecule; Side Effects Associated with the Drugs.
8. Can you provide examples of recent developments in the market?
In July 2022, Cereno Scientific announced that the first patient had been enrolled in the Phase II study in pulmonary arterial hypertension (PAH) with drug candidate CS1.
9. What pricing options are available for accessing the report?
Pricing options include single-user, multi-user, and enterprise licenses priced at USD 4750, USD 5250, and USD 8750 respectively.
10. Is the market size provided in terms of value or volume?
The market size is provided in terms of value, measured in billion and volume, measured in K Unit.
11. Are there any specific market keywords associated with the report?
Yes, the market keyword associated with the report is "PAH Industry," which aids in identifying and referencing the specific market segment covered.
12. How do I determine which pricing option suits my needs best?
The pricing options vary based on user requirements and access needs. Individual users may opt for single-user licenses, while businesses requiring broader access may choose multi-user or enterprise licenses for cost-effective access to the report.
13. Are there any additional resources or data provided in the PAH Industry report?
While the report offers comprehensive insights, it's advisable to review the specific contents or supplementary materials provided to ascertain if additional resources or data are available.
14. How can I stay updated on further developments or reports in the PAH Industry?
To stay informed about further developments, trends, and reports in the PAH Industry, consider subscribing to industry newsletters, following relevant companies and organizations, or regularly checking reputable industry news sources and publications.
Methodology
Step 1 - Identification of Relevant Samples Size from Population Database


Step 2 - Approaches for Defining Global Market Size (Value, Volume* & Price*)

Note*: In applicable scenarios
Step 3 - Data Sources
Primary Research
- Web Analytics
- Survey Reports
- Research Institute
- Latest Research Reports
- Opinion Leaders
Secondary Research
- Annual Reports
- White Paper
- Latest Press Release
- Industry Association
- Paid Database
- Investor Presentations

Step 4 - Data Triangulation
Involves using different sources of information in order to increase the validity of a study
These sources are likely to be stakeholders in a program - participants, other researchers, program staff, other community members, and so on.
Then we put all data in single framework & apply various statistical tools to find out the dynamic on the market.
During the analysis stage, feedback from the stakeholder groups would be compared to determine areas of agreement as well as areas of divergence