

Key Insights
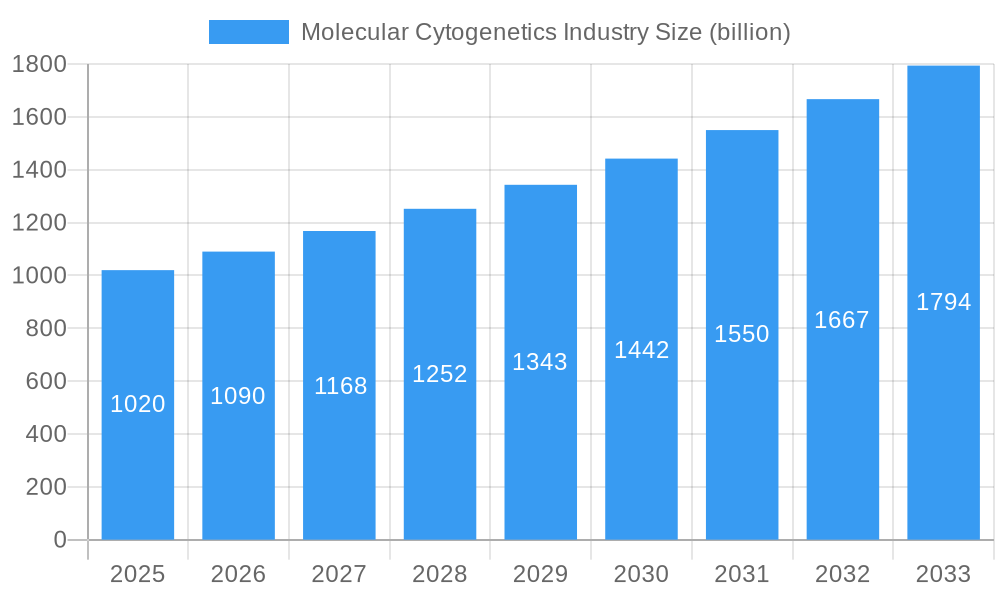
The Molecular Cytogenetics market is poised for significant expansion, projected to reach $1.02 billion in 2025. This robust growth is underpinned by a compelling Compound Annual Growth Rate (CAGR) of 7.1% throughout the forecast period (2025-2033). This upward trajectory is primarily driven by the increasing prevalence of genetic disorders, the escalating demand for personalized medicine, and advancements in diagnostic technologies. The growing awareness and early detection of conditions like cancer and inherited diseases are fueling the need for sophisticated molecular cytogenetic techniques. Furthermore, substantial investments in research and development by key players are contributing to the innovation of more accurate and efficient diagnostic tools and platforms, further propelling market growth.
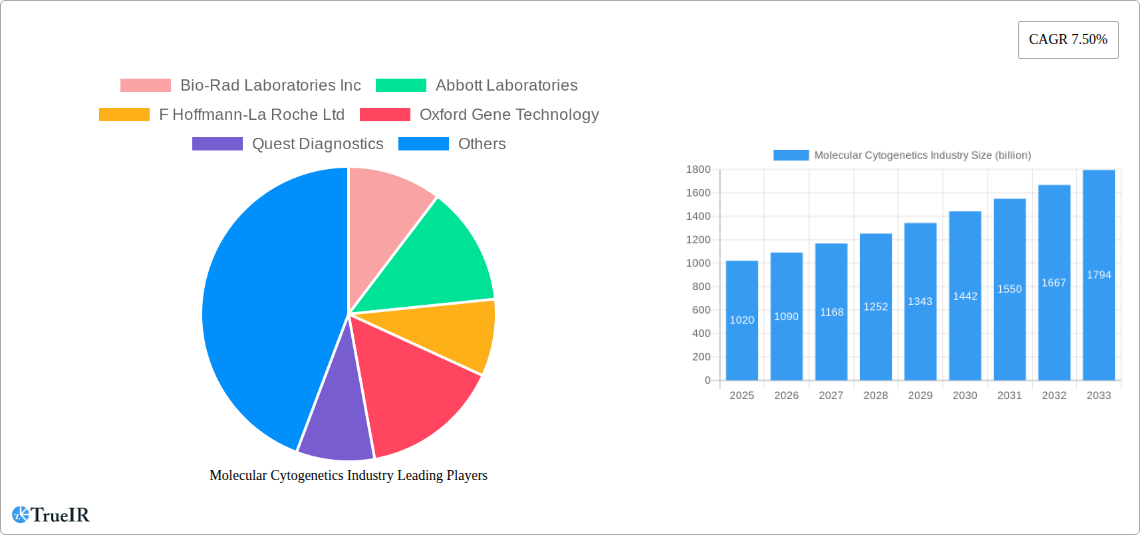
Molecular Cytogenetics Industry Market Size (In Billion)
The market is segmented across various product categories, including essential Instruments, Kits & Reagents, and integrated Software & Services, reflecting a comprehensive ecosystem supporting molecular cytogenetic analysis. Key techniques such as Fluorescence In Situ Hybridization (FISH), Comparative Genomic Hybridization (CGH), and Karyotyping are integral to unlocking insights into genetic abnormalities. These techniques find critical applications in diagnosing and managing Cancer and a wide spectrum of Genetic Disorders. Geographically, North America is expected to lead market share, followed by Europe and the Asia Pacific region, with emerging economies showing promising growth potential. Despite the optimistic outlook, challenges such as high equipment costs and the need for skilled professionals may pose minor restraints, but the overarching trend indicates a dynamic and expanding molecular cytogenetics landscape.
Molecular Cytogenetics Industry Company Market Share
This comprehensive report provides an in-depth analysis of the global Molecular Cytogenetics Industry, a rapidly evolving sector at the forefront of genetic diagnostics and personalized medicine. With a study period spanning from 2019 to 2033, and a base year of 2025, this report offers unparalleled insights into market dynamics, key trends, and future growth trajectories. The molecular cytogenetics market is projected to witness significant expansion, driven by advancements in genetic analysis technologies and an increasing understanding of the role of chromosomal abnormalities in various diseases. The market size is anticipated to reach multi-billion dollar valuations, with a projected Compound Annual Growth Rate (CAGR) of XX% between 2025 and 2033. This report is essential for stakeholders seeking to understand the competitive landscape, identify lucrative opportunities, and navigate the complexities of this critical healthcare segment.
Molecular Cytogenetics Industry Market Structure & Competitive Landscape
The molecular cytogenetics market exhibits a dynamic and moderately concentrated structure, driven by significant research and development investments and a growing demand for advanced diagnostic tools. Innovation is a primary driver, fueled by continuous technological advancements in areas like next-generation sequencing and advanced imaging, leading to the development of more accurate and comprehensive diagnostic solutions. Regulatory frameworks, while essential for ensuring product safety and efficacy, also present a crucial influence on market entry and product approval processes, impacting the pace of innovation and market penetration. The emergence of novel diagnostic techniques and an expanding understanding of genetic disorders are contributing to a robust pipeline of new products and services. Product substitutes, while present, are increasingly being outpaced by the specificity and depth of molecular cytogenetic analyses, particularly in oncology and rare genetic disease diagnostics. The end-user segmentation showcases a strong reliance on healthcare providers, diagnostic laboratories, and pharmaceutical companies, all leveraging molecular cytogenetics for diagnosis, treatment selection, and drug development. Mergers and acquisitions (M&A) activity, while not consistently high, plays a significant role in market consolidation and expansion, allowing key players to gain market share and diversify their product portfolios. Concentration ratios are estimated to be in the range of 50-70%, with a few major players dominating a substantial portion of the market. M&A volumes have seen a steady increase, averaging approximately 10-15 significant deals annually over the historical period.
Molecular Cytogenetics Industry Market Trends & Opportunities
The molecular cytogenetics industry is experiencing a transformative period, characterized by substantial market size growth and a fundamental shift in technological paradigms. The global market is projected to reach multi-billion dollar valuations by 2033, driven by an estimated CAGR of XX% during the forecast period (2025-2033). This expansion is underpinned by an increasing awareness and diagnosis of genetic disorders, coupled with the burgeoning field of precision medicine, particularly in oncology. Consumer preferences are increasingly leaning towards highly specific, non-invasive, and rapid diagnostic methods, which molecular cytogenetics technologies are adept at providing. The competitive dynamics are intensifying, with established giants and innovative startups vying for market dominance through continuous product development and strategic collaborations.
Technological advancements are at the core of this market's evolution. Fluorescence In Situ Hybridization (FISH) and Comparative Genomic Hybridization (CGH) remain crucial techniques, but their integration with next-generation sequencing (NGS) platforms is revolutionizing the field. These integrated approaches offer higher resolution, greater throughput, and the ability to detect a wider range of genomic alterations, from single nucleotide variants to large chromosomal rearrangements. Karyotyping, though a more traditional technique, continues to hold its ground for specific applications, especially in prenatal diagnostics and the identification of gross chromosomal abnormalities. The "Other Techniques" segment is rapidly expanding, encompassing array comparative genomic hybridization (aCGH), whole-genome sequencing (WGS), and whole-exome sequencing (WES), which provide unparalleled depth and breadth in genomic analysis.
The application landscape is also diversifying. Cancer diagnostics and prognostics represent a dominant segment, with molecular cytogenetics playing a pivotal role in identifying actionable mutations, predicting treatment response, and monitoring disease progression. The detection of gene fusions, amplifications, and deletions is crucial for targeted therapy selection in various cancers, including lung cancer, breast cancer, and hematological malignancies. Beyond cancer, the diagnosis of rare genetic disorders, developmental abnormalities, and prenatal screening are significant growth areas, offering hope and clarity to affected families. The increasing availability of affordable sequencing technologies and sophisticated bioinformatics tools is democratizing access to these powerful diagnostic capabilities.
Market penetration rates are steadily increasing, particularly in developed economies, where healthcare infrastructure is robust and there is a higher disposable income for advanced medical diagnostics. However, emerging economies present significant untapped opportunities as healthcare systems develop and awareness of genetic diagnostics grows. Strategic partnerships between technology providers, research institutions, and healthcare organizations are crucial for overcoming market access barriers and driving wider adoption of molecular cytogenetic solutions. The increasing demand for personalized treatment strategies, driven by a deeper understanding of individual genetic makeup, will continue to fuel the growth and innovation within the molecular cytogenetics industry for the foreseeable future.
Dominant Markets & Segments in Molecular Cytogenetics Industry
The molecular cytogenetics industry exhibits distinct regional dominance and segment leadership, shaped by factors like healthcare infrastructure, research funding, and disease prevalence. North America, particularly the United States, currently holds a dominant position due to its advanced healthcare system, substantial investment in R&D, and a high incidence of genetic disorders and cancer. Europe follows closely, with countries like Germany, the UK, and France demonstrating significant market share driven by robust governmental support for medical research and a growing emphasis on precision medicine. The Asia-Pacific region is emerging as a rapidly growing market, propelled by increasing healthcare expenditure, a large patient population, and a rising awareness of genetic testing, with China and India leading this expansion.
Within the Products segment, Kits & Reagents are projected to command the largest market share, estimated to be over 50% of the total market value by 2033. This dominance is attributed to the consumable nature of these products and the constant need for updated reagents for various assays. Instruments, though requiring higher initial investment, are essential enablers for widespread testing and are expected to represent a significant portion of the market, approximately 30-35%. The Software & Services segment is the fastest-growing, with an expected CAGR of XX% over the forecast period, driven by the increasing complexity of data analysis and the need for specialized bioinformatics support and interpretation services.
In terms of Technique, Fluorescence In Situ Hybridization (FISH) continues to be a leading technique, particularly for its established role in cancer diagnostics and prenatal testing, accounting for an estimated 40-45% of the market. Comparative Genomic Hybridization (CGH), including array CGH, is a rapidly growing technique, expected to capture around 30-35% of the market, owing to its higher resolution and ability to detect copy number variations across the entire genome. Karyotyping, while foundational, is projected to hold a smaller but stable share of approximately 10-15%, primarily for specific diagnostic needs. The Other Techniques segment, which includes advanced NGS-based methods, is experiencing exponential growth and is anticipated to expand its market share significantly, potentially reaching 15-20% by 2033.
The Application segment is overwhelmingly dominated by Cancer, which is expected to account for over 60% of the market value by 2033. This is due to the critical role of molecular cytogenetics in diagnosing, classifying, predicting prognosis, and guiding treatment for various cancers. Genetic Disorders represent the second-largest application, with an estimated market share of 25-30%, covering a wide range of inherited conditions, developmental delays, and rare diseases. Other Applications, including infectious diseases and research purposes, are expected to constitute the remaining market share. Key growth drivers for dominance in these segments include:
- Infrastructure: Development of advanced molecular diagnostic laboratories and clinical research centers.
- Policies: Government initiatives supporting genetic research, personalized medicine, and improved diagnostic access.
- Technological Advancements: Continuous innovation in assay sensitivity, specificity, and throughput.
- Disease Prevalence: High incidence of specific cancers and genetic disorders in key regions.
- Reimbursement Policies: Favorable reimbursement for molecular cytogenetic tests in healthcare systems.
Molecular Cytogenetics Industry Product Analysis
The molecular cytogenetics industry is characterized by a continuous stream of product innovations aimed at enhancing diagnostic accuracy, speed, and comprehensiveness. Key product categories include advanced FISH probes for targeted gene detection in oncology, high-resolution CGH arrays for identifying copy number variations in genetic disorders, and integrated platforms combining sequencing and cytogenetic analysis. These innovations offer significant competitive advantages by enabling earlier and more precise diagnosis of diseases like cancer and rare genetic syndromes. Applications range from prenatal screening and the diagnosis of congenital abnormalities to the precise characterization of tumors for personalized therapy selection and the monitoring of treatment efficacy. Technological advancements, such as multiplexing capabilities and automation, are further improving market fit by reducing turnaround times and operational costs for diagnostic laboratories.
Key Drivers, Barriers & Challenges in Molecular Cytogenetics Industry
Key Drivers:
- Technological Advancements: The relentless development of next-generation sequencing, advanced imaging, and bioinformatics tools is a primary growth catalyst, enabling more precise and comprehensive genomic analysis.
- Increasing Prevalence of Genetic Disorders and Cancer: A rising global incidence of these conditions fuels demand for accurate diagnostic solutions.
- Growing Adoption of Precision Medicine: The trend towards personalized treatment strategies, particularly in oncology, is a significant driver, requiring detailed molecular profiling.
- Governmental Support and Funding: Increased investment in healthcare and genetic research initiatives by governments worldwide is fostering market growth.
- Improved Reimbursement Policies: Expanding coverage for molecular cytogenetic tests by public and private payers is enhancing accessibility.
Key Barriers & Challenges:
- High Cost of Technology and Instrumentation: The initial investment for advanced molecular cytogenetic equipment can be substantial, posing a barrier to adoption for smaller laboratories.
- Regulatory Hurdles: Stringent approval processes for new diagnostic tests and technologies can lead to extended market entry timelines.
- Data Interpretation Complexity: Analyzing and interpreting the vast amounts of genomic data generated requires specialized bioinformatics expertise, which can be a bottleneck.
- Shortage of Skilled Professionals: A global deficit of trained molecular biologists, geneticists, and bioinformaticians can limit the widespread implementation of advanced techniques.
- Supply Chain Disruptions: Global events can impact the availability and cost of essential reagents and consumables.
Growth Drivers in the Molecular Cytogenetics Industry Market
The molecular cytogenetics industry is propelled by a confluence of powerful forces. Technologically, the ongoing revolution in next-generation sequencing (NGS) platforms and advanced bioinformatics software is continuously enhancing the resolution, speed, and scope of genomic analysis, making it indispensable for modern diagnostics. Economically, the increasing global burden of cancer and rare genetic disorders, coupled with a growing patient and physician awareness of the benefits of personalized medicine, creates a robust demand for accurate and timely molecular insights. Regulatory bodies are increasingly facilitating the approval of innovative diagnostic tests, recognizing their critical role in improving patient outcomes. Furthermore, favorable reimbursement policies from both public and private healthcare providers in key markets are making these advanced diagnostic solutions more accessible, thereby stimulating market growth.
Challenges Impacting Molecular Cytogenetics Industry Growth
Despite its promising trajectory, the molecular cytogenetics industry faces several significant challenges. Regulatory complexities, particularly the stringent approval pathways for novel diagnostic kits and software, can significantly prolong time-to-market and increase development costs. Supply chain issues, as evidenced by recent global disruptions, can impact the availability and pricing of critical reagents and consumables, leading to potential delays in testing and increased operational expenses. Competitive pressures are intense, with established players and emerging innovators constantly striving to gain market share through technological superiority and strategic partnerships, leading to price erosion in certain segments. Furthermore, the significant upfront investment required for advanced instrumentation and the ongoing need for specialized personnel with expertise in bioinformatics and molecular diagnostics present substantial barriers to entry and expansion for many organizations.
Key Players Shaping the Molecular Cytogenetics Industry Market
- Bio-Rad Laboratories Inc
- Abbott Laboratories
- F Hoffmann-La Roche Ltd
- Oxford Gene Technology
- Quest Diagnostics
- Agilent Technologies Inc
- Genial Genetic Solutions Ltd
- PerkinElmer Inc
- Illumina Inc
- Empire Genomics
- Thermo Fisher Scientific
- CytoTest Inc
Significant Molecular Cytogenetics Industry Industry Milestones
- September 2022: The Azerbaijan Thalassemia Center and BGI signed a Collaboration Agreement to enhance thalassemia screening in Azerbaijan through advanced genetic technology.
- March 2022: Illumina, Inc. launched TruSight Oncology (TSO) Comprehensive (EU), a single diagnostic test designed to assess multiple tumor genes and biomarkers for comprehensive cancer profiling, aiding precision medicine decisions in Europe.
Future Outlook for Molecular Cytogenetics Industry Market
The future outlook for the molecular cytogenetics industry is exceptionally bright, characterized by sustained growth and transformative potential. Key growth catalysts include the continuous refinement of NGS technologies, leading to even greater accuracy and cost-effectiveness, and the expanding applications in areas like liquid biopsies for non-invasive cancer detection and prenatal screening. The increasing focus on personalized medicine will further solidify the demand for precise molecular diagnostics. Strategic opportunities lie in emerging markets, where the unmet need for advanced genetic testing is significant, and in the development of integrated diagnostic platforms that combine multiple molecular techniques for a holistic patient assessment. The market is poised to witness significant advancements in automation, artificial intelligence for data analysis, and the development of novel therapeutic targets informed by cytogenetic insights, promising a future of improved patient care and groundbreaking discoveries.
Molecular Cytogenetics Industry Segmentation
-
1. Products
- 1.1. Instruments
- 1.2. Kits & Reagents
- 1.3. Software & Services
-
2. Technique
- 2.1. Fluorescence in Situ Hybridization
- 2.2. Comparative Genomic Hybridization
- 2.3. Karyotyping
- 2.4. Other Techniques
-
3. Application
- 3.1. Cancer
- 3.2. Genetic Disorders
- 3.3. Other Applications
Molecular Cytogenetics Industry Segmentation By Geography
-
1. North America
- 1.1. United States
- 1.2. Canada
- 1.3. Mexico
-
2. Europe
- 2.1. Germany
- 2.2. United Kingdom
- 2.3. France
- 2.4. Italy
- 2.5. Spain
- 2.6. Rest of Europe
-
3. Asia Pacific
- 3.1. China
- 3.2. Japan
- 3.3. India
- 3.4. Australia
- 3.5. South Korea
- 3.6. Rest of Asia Pacific
-
4. Middle East and Africa
- 4.1. GCC
- 4.2. South Africa
- 4.3. Rest of Middle East and Africa
-
5. South America
- 5.1. Brazil
- 5.2. Argentina
- 5.3. Rest of South America
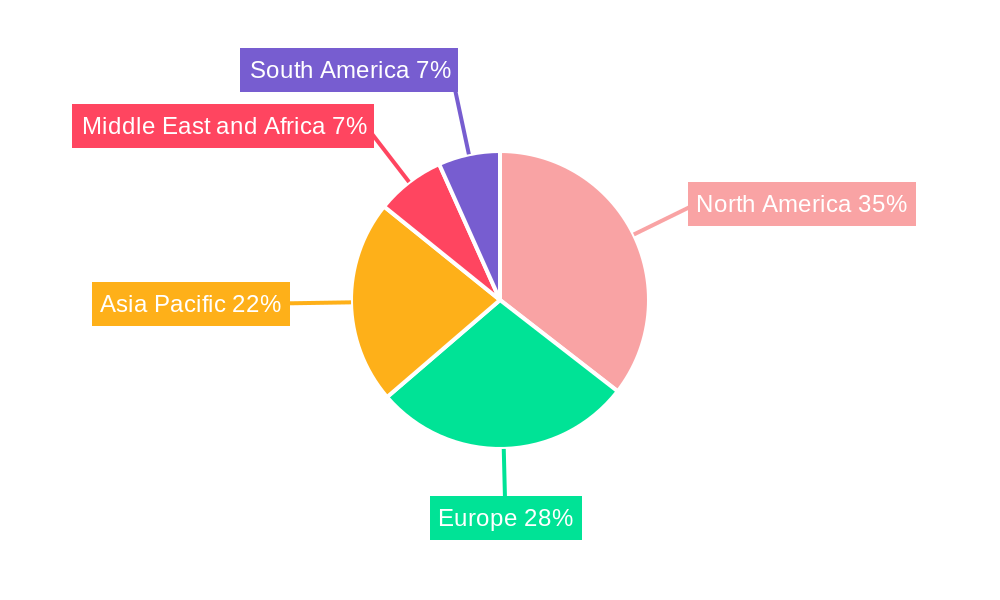
Molecular Cytogenetics Industry Regional Market Share
Geographic Coverage of Molecular Cytogenetics Industry
Molecular Cytogenetics Industry REPORT HIGHLIGHTS
| Aspects | Details |
|---|---|
| Study Period | 2020-2034 |
| Base Year | 2025 |
| Estimated Year | 2026 |
| Forecast Period | 2026-2034 |
| Historical Period | 2020-2025 |
| Growth Rate | CAGR of 8.9% from 2020-2034 |
| Segmentation |
|
Table of Contents
- 1. Introduction
- 1.1. Research Scope
- 1.2. Market Segmentation
- 1.3. Research Objective
- 1.4. Definitions and Assumptions
- 2. Executive Summary
- 2.1. Market Snapshot
- 3. Market Dynamics
- 3.1. Market Drivers
- 3.2. Market Restrains
- 3.3. Market Trends
- 3.4. Market Opportunities
- 4. Market Factor Analysis
- 4.1. Porters Five Forces
- 4.1.1. Bargaining Power of Suppliers
- 4.1.2. Bargaining Power of Buyers
- 4.1.3. Threat of New Entrants
- 4.1.4. Threat of Substitutes
- 4.1.5. Competitive Rivalry
- 4.2. PESTEL analysis
- 4.3. BCG Analysis
- 4.3.1. Stars (High Growth, High Market Share)
- 4.3.2. Cash Cows (Low Growth, High Market Share)
- 4.3.3. Question Mark (High Growth, Low Market Share)
- 4.3.4. Dogs (Low Growth, Low Market Share)
- 4.4. Ansoff Matrix Analysis
- 4.5. Supply Chain Analysis
- 4.6. Regulatory Landscape
- 4.7. Current Market Potential and Opportunity Assessment (TAM–SAM–SOM Framework)
- 4.8. TIR Analyst Note
- 4.1. Porters Five Forces
- 5. Market Analysis, Insights and Forecast 2021-2033
- 5.1. Market Analysis, Insights and Forecast - by Products
- 5.1.1. Instruments
- 5.1.2. Kits & Reagents
- 5.1.3. Software & Services
- 5.2. Market Analysis, Insights and Forecast - by Technique
- 5.2.1. Fluorescence in Situ Hybridization
- 5.2.2. Comparative Genomic Hybridization
- 5.2.3. Karyotyping
- 5.2.4. Other Techniques
- 5.3. Market Analysis, Insights and Forecast - by Application
- 5.3.1. Cancer
- 5.3.2. Genetic Disorders
- 5.3.3. Other Applications
- 5.4. Market Analysis, Insights and Forecast - by Region
- 5.4.1. North America
- 5.4.2. Europe
- 5.4.3. Asia Pacific
- 5.4.4. Middle East and Africa
- 5.4.5. South America
- 5.1. Market Analysis, Insights and Forecast - by Products
- 6. Global Molecular Cytogenetics Industry Analysis, Insights and Forecast, 2021-2033
- 6.1. Market Analysis, Insights and Forecast - by Products
- 6.1.1. Instruments
- 6.1.2. Kits & Reagents
- 6.1.3. Software & Services
- 6.2. Market Analysis, Insights and Forecast - by Technique
- 6.2.1. Fluorescence in Situ Hybridization
- 6.2.2. Comparative Genomic Hybridization
- 6.2.3. Karyotyping
- 6.2.4. Other Techniques
- 6.3. Market Analysis, Insights and Forecast - by Application
- 6.3.1. Cancer
- 6.3.2. Genetic Disorders
- 6.3.3. Other Applications
- 6.1. Market Analysis, Insights and Forecast - by Products
- 7. North America Molecular Cytogenetics Industry Analysis, Insights and Forecast, 2020-2032
- 7.1. Market Analysis, Insights and Forecast - by Products
- 7.1.1. Instruments
- 7.1.2. Kits & Reagents
- 7.1.3. Software & Services
- 7.2. Market Analysis, Insights and Forecast - by Technique
- 7.2.1. Fluorescence in Situ Hybridization
- 7.2.2. Comparative Genomic Hybridization
- 7.2.3. Karyotyping
- 7.2.4. Other Techniques
- 7.3. Market Analysis, Insights and Forecast - by Application
- 7.3.1. Cancer
- 7.3.2. Genetic Disorders
- 7.3.3. Other Applications
- 7.1. Market Analysis, Insights and Forecast - by Products
- 8. Europe Molecular Cytogenetics Industry Analysis, Insights and Forecast, 2020-2032
- 8.1. Market Analysis, Insights and Forecast - by Products
- 8.1.1. Instruments
- 8.1.2. Kits & Reagents
- 8.1.3. Software & Services
- 8.2. Market Analysis, Insights and Forecast - by Technique
- 8.2.1. Fluorescence in Situ Hybridization
- 8.2.2. Comparative Genomic Hybridization
- 8.2.3. Karyotyping
- 8.2.4. Other Techniques
- 8.3. Market Analysis, Insights and Forecast - by Application
- 8.3.1. Cancer
- 8.3.2. Genetic Disorders
- 8.3.3. Other Applications
- 8.1. Market Analysis, Insights and Forecast - by Products
- 9. Asia Pacific Molecular Cytogenetics Industry Analysis, Insights and Forecast, 2020-2032
- 9.1. Market Analysis, Insights and Forecast - by Products
- 9.1.1. Instruments
- 9.1.2. Kits & Reagents
- 9.1.3. Software & Services
- 9.2. Market Analysis, Insights and Forecast - by Technique
- 9.2.1. Fluorescence in Situ Hybridization
- 9.2.2. Comparative Genomic Hybridization
- 9.2.3. Karyotyping
- 9.2.4. Other Techniques
- 9.3. Market Analysis, Insights and Forecast - by Application
- 9.3.1. Cancer
- 9.3.2. Genetic Disorders
- 9.3.3. Other Applications
- 9.1. Market Analysis, Insights and Forecast - by Products
- 10. Middle East and Africa Molecular Cytogenetics Industry Analysis, Insights and Forecast, 2020-2032
- 10.1. Market Analysis, Insights and Forecast - by Products
- 10.1.1. Instruments
- 10.1.2. Kits & Reagents
- 10.1.3. Software & Services
- 10.2. Market Analysis, Insights and Forecast - by Technique
- 10.2.1. Fluorescence in Situ Hybridization
- 10.2.2. Comparative Genomic Hybridization
- 10.2.3. Karyotyping
- 10.2.4. Other Techniques
- 10.3. Market Analysis, Insights and Forecast - by Application
- 10.3.1. Cancer
- 10.3.2. Genetic Disorders
- 10.3.3. Other Applications
- 10.1. Market Analysis, Insights and Forecast - by Products
- 11. South America Molecular Cytogenetics Industry Analysis, Insights and Forecast, 2020-2032
- 11.1. Market Analysis, Insights and Forecast - by Products
- 11.1.1. Instruments
- 11.1.2. Kits & Reagents
- 11.1.3. Software & Services
- 11.2. Market Analysis, Insights and Forecast - by Technique
- 11.2.1. Fluorescence in Situ Hybridization
- 11.2.2. Comparative Genomic Hybridization
- 11.2.3. Karyotyping
- 11.2.4. Other Techniques
- 11.3. Market Analysis, Insights and Forecast - by Application
- 11.3.1. Cancer
- 11.3.2. Genetic Disorders
- 11.3.3. Other Applications
- 11.1. Market Analysis, Insights and Forecast - by Products
- 12. Competitive Analysis
- 12.1. Company Profiles
- 12.1.1 Bio-Rad Laboratories Inc
- 12.1.1.1. Company Overview
- 12.1.1.2. Products
- 12.1.1.3. Company Financials
- 12.1.1.4. SWOT Analysis
- 12.1.2 Abbott Laboratories
- 12.1.2.1. Company Overview
- 12.1.2.2. Products
- 12.1.2.3. Company Financials
- 12.1.2.4. SWOT Analysis
- 12.1.3 F Hoffmann-La Roche Ltd
- 12.1.3.1. Company Overview
- 12.1.3.2. Products
- 12.1.3.3. Company Financials
- 12.1.3.4. SWOT Analysis
- 12.1.4 Oxford Gene Technology
- 12.1.4.1. Company Overview
- 12.1.4.2. Products
- 12.1.4.3. Company Financials
- 12.1.4.4. SWOT Analysis
- 12.1.5 Quest Diagnostics
- 12.1.5.1. Company Overview
- 12.1.5.2. Products
- 12.1.5.3. Company Financials
- 12.1.5.4. SWOT Analysis
- 12.1.6 Agilent Technologies Inc
- 12.1.6.1. Company Overview
- 12.1.6.2. Products
- 12.1.6.3. Company Financials
- 12.1.6.4. SWOT Analysis
- 12.1.7 Genial Genetic Solutions Ltd
- 12.1.7.1. Company Overview
- 12.1.7.2. Products
- 12.1.7.3. Company Financials
- 12.1.7.4. SWOT Analysis
- 12.1.8 PerkinElmer Inc
- 12.1.8.1. Company Overview
- 12.1.8.2. Products
- 12.1.8.3. Company Financials
- 12.1.8.4. SWOT Analysis
- 12.1.9 Illumina Inc
- 12.1.9.1. Company Overview
- 12.1.9.2. Products
- 12.1.9.3. Company Financials
- 12.1.9.4. SWOT Analysis
- 12.1.10 Empire Genomics
- 12.1.10.1. Company Overview
- 12.1.10.2. Products
- 12.1.10.3. Company Financials
- 12.1.10.4. SWOT Analysis
- 12.1.11 Thermo Fisher Scientific
- 12.1.11.1. Company Overview
- 12.1.11.2. Products
- 12.1.11.3. Company Financials
- 12.1.11.4. SWOT Analysis
- 12.1.12 CytoTest Inc *List Not Exhaustive
- 12.1.12.1. Company Overview
- 12.1.12.2. Products
- 12.1.12.3. Company Financials
- 12.1.12.4. SWOT Analysis
- 12.1.1 Bio-Rad Laboratories Inc
- 12.2. Market Entropy
- 12.2.1 Company's Key Areas Served
- 12.2.2 Recent Developments
- 12.3. Company Market Share Analysis 2025
- 12.3.1 Top 5 Companies Market Share Analysis
- 12.3.2 Top 3 Companies Market Share Analysis
- 12.4. List of Potential Customers
- 13. Research Methodology
List of Figures
- Figure 1: Global Molecular Cytogenetics Industry Revenue Breakdown (billion, %) by Region 2025 & 2033
- Figure 2: North America Molecular Cytogenetics Industry Revenue (billion), by Products 2025 & 2033
- Figure 3: North America Molecular Cytogenetics Industry Revenue Share (%), by Products 2025 & 2033
- Figure 4: North America Molecular Cytogenetics Industry Revenue (billion), by Technique 2025 & 2033
- Figure 5: North America Molecular Cytogenetics Industry Revenue Share (%), by Technique 2025 & 2033
- Figure 6: North America Molecular Cytogenetics Industry Revenue (billion), by Application 2025 & 2033
- Figure 7: North America Molecular Cytogenetics Industry Revenue Share (%), by Application 2025 & 2033
- Figure 8: North America Molecular Cytogenetics Industry Revenue (billion), by Country 2025 & 2033
- Figure 9: North America Molecular Cytogenetics Industry Revenue Share (%), by Country 2025 & 2033
- Figure 10: Europe Molecular Cytogenetics Industry Revenue (billion), by Products 2025 & 2033
- Figure 11: Europe Molecular Cytogenetics Industry Revenue Share (%), by Products 2025 & 2033
- Figure 12: Europe Molecular Cytogenetics Industry Revenue (billion), by Technique 2025 & 2033
- Figure 13: Europe Molecular Cytogenetics Industry Revenue Share (%), by Technique 2025 & 2033
- Figure 14: Europe Molecular Cytogenetics Industry Revenue (billion), by Application 2025 & 2033
- Figure 15: Europe Molecular Cytogenetics Industry Revenue Share (%), by Application 2025 & 2033
- Figure 16: Europe Molecular Cytogenetics Industry Revenue (billion), by Country 2025 & 2033
- Figure 17: Europe Molecular Cytogenetics Industry Revenue Share (%), by Country 2025 & 2033
- Figure 18: Asia Pacific Molecular Cytogenetics Industry Revenue (billion), by Products 2025 & 2033
- Figure 19: Asia Pacific Molecular Cytogenetics Industry Revenue Share (%), by Products 2025 & 2033
- Figure 20: Asia Pacific Molecular Cytogenetics Industry Revenue (billion), by Technique 2025 & 2033
- Figure 21: Asia Pacific Molecular Cytogenetics Industry Revenue Share (%), by Technique 2025 & 2033
- Figure 22: Asia Pacific Molecular Cytogenetics Industry Revenue (billion), by Application 2025 & 2033
- Figure 23: Asia Pacific Molecular Cytogenetics Industry Revenue Share (%), by Application 2025 & 2033
- Figure 24: Asia Pacific Molecular Cytogenetics Industry Revenue (billion), by Country 2025 & 2033
- Figure 25: Asia Pacific Molecular Cytogenetics Industry Revenue Share (%), by Country 2025 & 2033
- Figure 26: Middle East and Africa Molecular Cytogenetics Industry Revenue (billion), by Products 2025 & 2033
- Figure 27: Middle East and Africa Molecular Cytogenetics Industry Revenue Share (%), by Products 2025 & 2033
- Figure 28: Middle East and Africa Molecular Cytogenetics Industry Revenue (billion), by Technique 2025 & 2033
- Figure 29: Middle East and Africa Molecular Cytogenetics Industry Revenue Share (%), by Technique 2025 & 2033
- Figure 30: Middle East and Africa Molecular Cytogenetics Industry Revenue (billion), by Application 2025 & 2033
- Figure 31: Middle East and Africa Molecular Cytogenetics Industry Revenue Share (%), by Application 2025 & 2033
- Figure 32: Middle East and Africa Molecular Cytogenetics Industry Revenue (billion), by Country 2025 & 2033
- Figure 33: Middle East and Africa Molecular Cytogenetics Industry Revenue Share (%), by Country 2025 & 2033
- Figure 34: South America Molecular Cytogenetics Industry Revenue (billion), by Products 2025 & 2033
- Figure 35: South America Molecular Cytogenetics Industry Revenue Share (%), by Products 2025 & 2033
- Figure 36: South America Molecular Cytogenetics Industry Revenue (billion), by Technique 2025 & 2033
- Figure 37: South America Molecular Cytogenetics Industry Revenue Share (%), by Technique 2025 & 2033
- Figure 38: South America Molecular Cytogenetics Industry Revenue (billion), by Application 2025 & 2033
- Figure 39: South America Molecular Cytogenetics Industry Revenue Share (%), by Application 2025 & 2033
- Figure 40: South America Molecular Cytogenetics Industry Revenue (billion), by Country 2025 & 2033
- Figure 41: South America Molecular Cytogenetics Industry Revenue Share (%), by Country 2025 & 2033
List of Tables
- Table 1: Global Molecular Cytogenetics Industry Revenue billion Forecast, by Products 2020 & 2033
- Table 2: Global Molecular Cytogenetics Industry Revenue billion Forecast, by Technique 2020 & 2033
- Table 3: Global Molecular Cytogenetics Industry Revenue billion Forecast, by Application 2020 & 2033
- Table 4: Global Molecular Cytogenetics Industry Revenue billion Forecast, by Region 2020 & 2033
- Table 5: Global Molecular Cytogenetics Industry Revenue billion Forecast, by Products 2020 & 2033
- Table 6: Global Molecular Cytogenetics Industry Revenue billion Forecast, by Technique 2020 & 2033
- Table 7: Global Molecular Cytogenetics Industry Revenue billion Forecast, by Application 2020 & 2033
- Table 8: Global Molecular Cytogenetics Industry Revenue billion Forecast, by Country 2020 & 2033
- Table 9: United States Molecular Cytogenetics Industry Revenue (billion) Forecast, by Application 2020 & 2033
- Table 10: Canada Molecular Cytogenetics Industry Revenue (billion) Forecast, by Application 2020 & 2033
- Table 11: Mexico Molecular Cytogenetics Industry Revenue (billion) Forecast, by Application 2020 & 2033
- Table 12: Global Molecular Cytogenetics Industry Revenue billion Forecast, by Products 2020 & 2033
- Table 13: Global Molecular Cytogenetics Industry Revenue billion Forecast, by Technique 2020 & 2033
- Table 14: Global Molecular Cytogenetics Industry Revenue billion Forecast, by Application 2020 & 2033
- Table 15: Global Molecular Cytogenetics Industry Revenue billion Forecast, by Country 2020 & 2033
- Table 16: Germany Molecular Cytogenetics Industry Revenue (billion) Forecast, by Application 2020 & 2033
- Table 17: United Kingdom Molecular Cytogenetics Industry Revenue (billion) Forecast, by Application 2020 & 2033
- Table 18: France Molecular Cytogenetics Industry Revenue (billion) Forecast, by Application 2020 & 2033
- Table 19: Italy Molecular Cytogenetics Industry Revenue (billion) Forecast, by Application 2020 & 2033
- Table 20: Spain Molecular Cytogenetics Industry Revenue (billion) Forecast, by Application 2020 & 2033
- Table 21: Rest of Europe Molecular Cytogenetics Industry Revenue (billion) Forecast, by Application 2020 & 2033
- Table 22: Global Molecular Cytogenetics Industry Revenue billion Forecast, by Products 2020 & 2033
- Table 23: Global Molecular Cytogenetics Industry Revenue billion Forecast, by Technique 2020 & 2033
- Table 24: Global Molecular Cytogenetics Industry Revenue billion Forecast, by Application 2020 & 2033
- Table 25: Global Molecular Cytogenetics Industry Revenue billion Forecast, by Country 2020 & 2033
- Table 26: China Molecular Cytogenetics Industry Revenue (billion) Forecast, by Application 2020 & 2033
- Table 27: Japan Molecular Cytogenetics Industry Revenue (billion) Forecast, by Application 2020 & 2033
- Table 28: India Molecular Cytogenetics Industry Revenue (billion) Forecast, by Application 2020 & 2033
- Table 29: Australia Molecular Cytogenetics Industry Revenue (billion) Forecast, by Application 2020 & 2033
- Table 30: South Korea Molecular Cytogenetics Industry Revenue (billion) Forecast, by Application 2020 & 2033
- Table 31: Rest of Asia Pacific Molecular Cytogenetics Industry Revenue (billion) Forecast, by Application 2020 & 2033
- Table 32: Global Molecular Cytogenetics Industry Revenue billion Forecast, by Products 2020 & 2033
- Table 33: Global Molecular Cytogenetics Industry Revenue billion Forecast, by Technique 2020 & 2033
- Table 34: Global Molecular Cytogenetics Industry Revenue billion Forecast, by Application 2020 & 2033
- Table 35: Global Molecular Cytogenetics Industry Revenue billion Forecast, by Country 2020 & 2033
- Table 36: GCC Molecular Cytogenetics Industry Revenue (billion) Forecast, by Application 2020 & 2033
- Table 37: South Africa Molecular Cytogenetics Industry Revenue (billion) Forecast, by Application 2020 & 2033
- Table 38: Rest of Middle East and Africa Molecular Cytogenetics Industry Revenue (billion) Forecast, by Application 2020 & 2033
- Table 39: Global Molecular Cytogenetics Industry Revenue billion Forecast, by Products 2020 & 2033
- Table 40: Global Molecular Cytogenetics Industry Revenue billion Forecast, by Technique 2020 & 2033
- Table 41: Global Molecular Cytogenetics Industry Revenue billion Forecast, by Application 2020 & 2033
- Table 42: Global Molecular Cytogenetics Industry Revenue billion Forecast, by Country 2020 & 2033
- Table 43: Brazil Molecular Cytogenetics Industry Revenue (billion) Forecast, by Application 2020 & 2033
- Table 44: Argentina Molecular Cytogenetics Industry Revenue (billion) Forecast, by Application 2020 & 2033
- Table 45: Rest of South America Molecular Cytogenetics Industry Revenue (billion) Forecast, by Application 2020 & 2033
Frequently Asked Questions
1. What is the projected Compound Annual Growth Rate (CAGR) of the Molecular Cytogenetics Industry?
The projected CAGR is approximately 8.9%.
2. Which companies are prominent players in the Molecular Cytogenetics Industry?
Key companies in the market include Bio-Rad Laboratories Inc, Abbott Laboratories, F Hoffmann-La Roche Ltd, Oxford Gene Technology, Quest Diagnostics, Agilent Technologies Inc, Genial Genetic Solutions Ltd, PerkinElmer Inc, Illumina Inc, Empire Genomics, Thermo Fisher Scientific, CytoTest Inc *List Not Exhaustive.
3. What are the main segments of the Molecular Cytogenetics Industry?
The market segments include Products, Technique, Application.
4. Can you provide details about the market size?
The market size is estimated to be USD 3.6 billion as of 2022.
5. What are some drivers contributing to market growth?
Growing Prevalence of Cancer and Genetic Disorders; Increasing Focus on Targeted Therapies for Cancer Treatment; Rise in Funding for Research and Clinical Diagnosis.
6. What are the notable trends driving market growth?
Cancer Segment is Expected to Show Better Growth Over the Forecast Period.
7. Are there any restraints impacting market growth?
High Cost of Treatment; Lack of Awareness about the Emerging Diagnostic Technologies in Cytogenetics.
8. Can you provide examples of recent developments in the market?
In September 2022, the Azerbaijan Thalassemia Center and BGI held a virtual signing ceremony to seal a Collaboration Agreement. The partnership aims to improve thalassemia screening in Azerbaijan through genetic technology.
9. What pricing options are available for accessing the report?
Pricing options include single-user, multi-user, and enterprise licenses priced at USD 4750, USD 5250, and USD 8750 respectively.
10. Is the market size provided in terms of value or volume?
The market size is provided in terms of value, measured in billion.
11. Are there any specific market keywords associated with the report?
Yes, the market keyword associated with the report is "Molecular Cytogenetics Industry," which aids in identifying and referencing the specific market segment covered.
12. How do I determine which pricing option suits my needs best?
The pricing options vary based on user requirements and access needs. Individual users may opt for single-user licenses, while businesses requiring broader access may choose multi-user or enterprise licenses for cost-effective access to the report.
13. Are there any additional resources or data provided in the Molecular Cytogenetics Industry report?
While the report offers comprehensive insights, it's advisable to review the specific contents or supplementary materials provided to ascertain if additional resources or data are available.
14. How can I stay updated on further developments or reports in the Molecular Cytogenetics Industry?
To stay informed about further developments, trends, and reports in the Molecular Cytogenetics Industry, consider subscribing to industry newsletters, following relevant companies and organizations, or regularly checking reputable industry news sources and publications.
Methodology
Step 1 - Identification of Relevant Samples Size from Population Database


Step 2 - Approaches for Defining Global Market Size (Value, Volume* & Price*)

Note*: In applicable scenarios
Step 3 - Data Sources
Primary Research
- Web Analytics
- Survey Reports
- Research Institute
- Latest Research Reports
- Opinion Leaders
Secondary Research
- Annual Reports
- White Paper
- Latest Press Release
- Industry Association
- Paid Database
- Investor Presentations

Step 4 - Data Triangulation
Involves using different sources of information in order to increase the validity of a study
These sources are likely to be stakeholders in a program - participants, other researchers, program staff, other community members, and so on.
Then we put all data in single framework & apply various statistical tools to find out the dynamic on the market.
During the analysis stage, feedback from the stakeholder groups would be compared to determine areas of agreement as well as areas of divergence