

Key Insights
The bio-based polymers market is experiencing robust growth, driven by increasing environmental concerns and stringent regulations regarding the use of petroleum-based plastics. The market's Compound Annual Growth Rate (CAGR) of 24.30% from 2019 to 2024 indicates significant expansion, projected to continue throughout the forecast period (2025-2033). Key drivers include the rising demand for sustainable and biodegradable materials across diverse sectors like packaging, agriculture, and healthcare. The increasing awareness of plastic pollution and its detrimental effects on the environment is fueling the adoption of bio-based polymers as a more eco-friendly alternative. Furthermore, technological advancements in bio-polymer production are leading to improved material properties and cost-effectiveness, making them increasingly competitive against traditional plastics. Market segmentation reveals a significant contribution from starch-based plastics and polylactic acid (PLA), driven by their widespread applications in packaging and food service. However, challenges remain, including the relatively higher cost compared to conventional plastics and limitations in certain performance characteristics. Overcoming these restraints through research and development efforts is crucial for further market penetration. Leading players in the market are actively investing in research and development to address these challenges and enhance the properties of bio-based polymers, further fueling market expansion. Geographic analysis suggests robust growth across North America, Europe, and Asia Pacific, with China and the United States as key contributors.
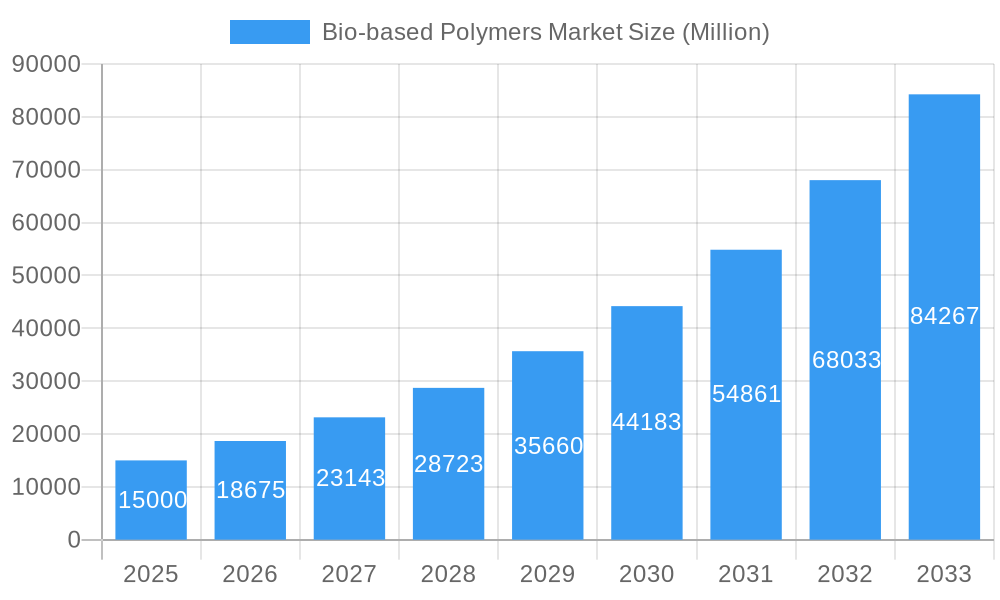
Bio-based Polymers Market Market Size (In Billion)
The future of the bio-based polymers market appears promising, with continued growth expected throughout the forecast period. Expansion into new applications, such as textiles and electronics, will further drive market demand. Collaboration between industry stakeholders, including research institutions, manufacturers, and regulatory bodies, will be essential in fostering innovation and addressing remaining challenges. This collaborative effort will involve developing cost-effective production methods, improving the performance characteristics of bio-based polymers, and creating a supportive regulatory environment to accelerate market adoption. The market will likely see increased diversification in polymer types, with materials like PHA and polyesters gaining traction due to their unique properties and suitability for specific applications. The continued focus on sustainability and circular economy principles will reinforce the bio-based polymers market's position as a vital component of a more environmentally conscious future.
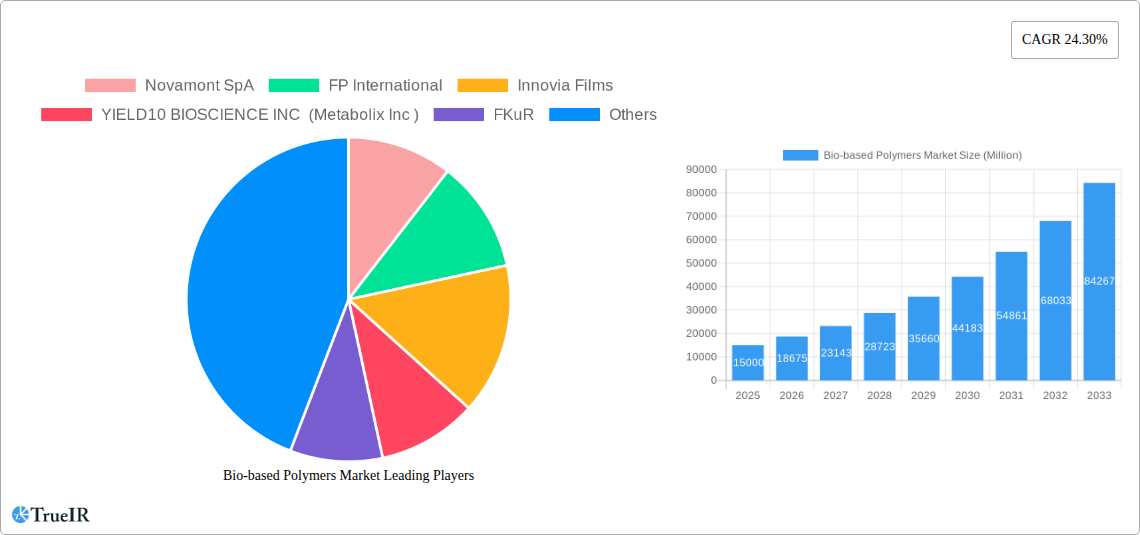
Bio-based Polymers Market Company Market Share
Bio-based Polymers Market: A Comprehensive Report (2019-2033)
This dynamic report provides a detailed analysis of the Bio-based Polymers market, offering invaluable insights for industry stakeholders, investors, and researchers. Leveraging extensive primary and secondary research, the report covers market size, segmentation, competitive landscape, growth drivers, challenges, and future outlook from 2019 to 2033. The study period spans 2019-2033, with 2025 as the base and estimated year, and the forecast period covering 2025-2033. The historical period analyzed is 2019-2024. The global market is projected to reach xx Million by 2033, exhibiting a CAGR of xx% during the forecast period.
Bio-based Polymers Market Market Structure & Competitive Landscape
The Bio-based Polymers market exhibits a moderately concentrated structure, with several key players commanding significant market share. However, the market is also characterized by a growing number of smaller, specialized companies driving innovation. The Herfindahl-Hirschman Index (HHI) for the market in 2025 is estimated at xx, indicating a moderately competitive landscape. Innovation is fueled by increasing demand for sustainable materials and stringent environmental regulations. Major regulatory impacts include the EU's Plastic Strategy and similar initiatives globally, driving adoption of bio-based alternatives. Product substitutes, such as conventional petroleum-based polymers, continue to pose a challenge, but the increasing cost of petroleum and growing environmental concerns are shifting the balance in favor of bio-based polymers.
End-user segmentation is diverse, with significant demand from packaging (xx Million in 2025), agriculture (xx Million in 2025), and healthcare sectors. The market has witnessed a moderate level of mergers and acquisitions (M&A) activity in recent years, with approximately xx M&A deals recorded between 2019 and 2024. These transactions reflect strategic efforts by major players to expand their product portfolios and market reach. Key M&A trends include vertical integration, diversification into new applications, and the acquisition of smaller innovative companies.
Bio-based Polymers Market Market Trends & Opportunities
The Bio-based Polymers market is experiencing robust growth driven by several factors. The global market size was valued at xx Million in 2025 and is projected to reach xx Million by 2033. This significant growth is fueled by increasing consumer awareness of environmental issues and a growing preference for sustainable and biodegradable products. Technological advancements, particularly in the development of new bio-based polymers with enhanced properties, are also contributing to market expansion. The market penetration rate for bio-based polymers in various applications, such as packaging and textiles, is steadily increasing. Significant technological shifts include the development of more efficient and cost-effective production processes for bio-based polymers, as well as advancements in polymer chemistry leading to materials with improved performance characteristics. The competitive dynamics are characterized by both intense competition among established players and the emergence of new entrants. This dynamic environment is driving innovation and improving the overall quality and affordability of bio-based polymers.
Dominant Markets & Segments in Bio-based Polymers Market
The packaging segment holds the largest market share within the applications category, driven by the growing demand for eco-friendly packaging solutions. Geographically, Asia-Pacific is expected to be the dominant region due to rapid economic growth, increasing population, and substantial investments in sustainable infrastructure.
Leading Regions/Countries: Asia-Pacific (China, India, Japan), Europe (Germany, France, UK), North America (US, Canada)
Growth Drivers by Segment:
- Packaging: Stringent regulations on plastic waste, growing demand for biodegradable packaging, and increasing consumer awareness.
- Agriculture: Growing demand for biodegradable mulches and films, promoting sustainable agriculture practices.
- Healthcare: Demand for biocompatible and biodegradable medical devices and implants.
Dominant Polymer Types: PLA holds a significant market share due to its versatility and established production infrastructure. However, PHA is experiencing rapid growth due to its superior biodegradability.
Key Growth Drivers by Region: Strong government support for sustainable technologies, robust industrial base, and increasing consumer demand for eco-friendly products are major drivers for growth in Asia-Pacific. In Europe and North America, stricter environmental regulations and policies are boosting market adoption.
Bio-based Polymers Market Product Analysis
Recent product innovations include the development of bio-based polymers with improved mechanical properties, such as increased strength and flexibility. These advancements are enhancing the market fit of bio-based polymers across various applications. The competitive advantage is achieved through the combination of superior performance characteristics, cost-effectiveness, and sustainability credentials. Innovations in PLA, PHA, and PBAT are pushing the boundaries of functionality and performance in applications ranging from flexible packaging to rigid containers.
Key Drivers, Barriers & Challenges in Bio-based Polymers Market
Key Drivers:
- Growing environmental concerns and increasing regulations on plastic waste.
- Rising consumer demand for sustainable and biodegradable products.
- Technological advancements leading to improved performance and cost-effectiveness.
- Government incentives and subsidies promoting the adoption of bio-based polymers.
Challenges & Restraints:
- Higher production costs compared to conventional polymers.
- Limited availability of feedstock for some bio-based polymers.
- Potential performance limitations compared to conventional counterparts in specific applications.
- Regulatory complexities and inconsistencies across different regions. This creates uncertainty for manufacturers and hinders market expansion. Supply chain issues, particularly related to feedstock availability and logistics, also pose a challenge. The highly competitive nature of the market with established players, including major petrochemical companies, further intensifies the challenges. The cost-effectiveness gap compared to conventional polymers needs to be addressed for widespread adoption. These challenges are estimated to result in a xx% reduction in overall market growth during the forecast period.
Growth Drivers in the Bio-based Polymers Market Market
The growth of the bio-based polymers market is primarily driven by increasing environmental concerns, stringent regulations aimed at reducing plastic waste, and growing consumer preference for sustainable products. Technological advancements in polymer synthesis are enhancing the properties and applications of these materials, while government incentives and subsidies further boost market growth.
Challenges Impacting Bio-based Polymers Market Growth
The key challenges hindering the growth of the bio-based polymers market include the relatively higher production costs compared to conventional polymers, the limited availability of suitable feedstock, potential performance limitations, and regulatory complexities across different regions.
Key Players Shaping the Bio-based Polymers Market Market
- Novamont SpA
- FP International
- Innovia Films
- YIELD10 BIOSCIENCE INC (Metabolix Inc)
- FKuR
- Merck KGaA
- Cardia Bioplastics
- Rodenburg Biopolymers
- Covestro AG
- NatureWorks LLC
- thyssenkrupp AG
- DuPont de Nemours Inc
- Biologische Naturverpackungen GmbH & Co KG
- Corbion
- Cortec Group Management Services LLC
- SHOWA DENKO K K
- BASF SE
Significant Bio-based Polymers Market Industry Milestones
- 2020: NatureWorks LLC launched a new PLA resin with improved heat resistance.
- 2021: BASF SE announced a significant investment in expanding its bio-based polymer production capacity.
- 2022: A major merger between two bio-based polymer producers resulted in a significant increase in market share. (Specific details to be added based on available data)
- 2023: Several new bio-based polymer formulations were introduced, targeting specific niche applications. (Specific details to be added based on available data)
Future Outlook for Bio-based Polymers Market Market
The bio-based polymers market is poised for continued strong growth, driven by the increasing focus on sustainability and the development of innovative, high-performance materials. Strategic opportunities abound, particularly in the development of new applications and the expansion into emerging markets. The market's potential is significant, with continued growth expected across various sectors as consumer and regulatory pressures for sustainable alternatives increase.
Bio-based Polymers Market Segmentation
-
1. Type
- 1.1. Starch-based Plastics
- 1.2. Poly Lactic Acid (PLA)
- 1.3. PolyHydroxy Alkanoates (PHA)
- 1.4. Polyesters (PBS, PBAT, and PCL)
- 1.5. Cellulose Derivatives
-
2. Application
- 2.1. Agriculture
- 2.2. Textile
- 2.3. Electronics
- 2.4. Packaging
- 2.5. Healthcare
- 2.6. Other Applications
Bio-based Polymers Market Segmentation By Geography
-
1. Asia Pacific
- 1.1. China
- 1.2. India
- 1.3. Japan
- 1.4. South Korea
- 1.5. Rest of Asia Pacific
-
2. North America
- 2.1. United States
- 2.2. Canada
- 2.3. Mexico
-
3. Europe
- 3.1. Germany
- 3.2. United Kingdom
- 3.3. Italy
- 3.4. France
- 3.5. Rest of Europe
-
4. Rest of World
- 4.1. Brazil
- 4.2. Saudi Arabia
- 4.3. Rest of the World
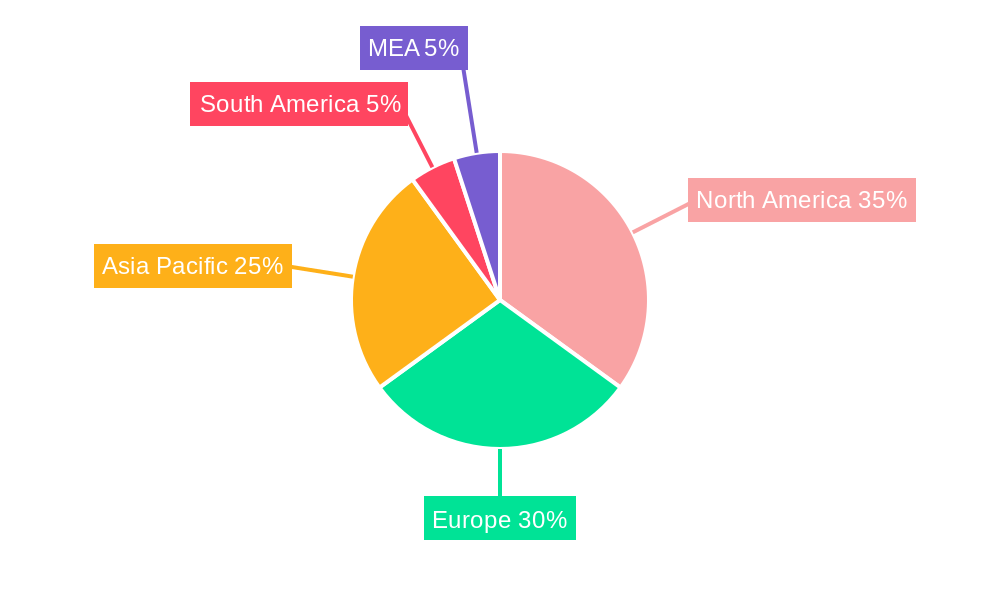
Bio-based Polymers Market Regional Market Share
Geographic Coverage of Bio-based Polymers Market
Bio-based Polymers Market REPORT HIGHLIGHTS
| Aspects | Details |
|---|---|
| Study Period | 2020-2034 |
| Base Year | 2025 |
| Estimated Year | 2026 |
| Forecast Period | 2026-2034 |
| Historical Period | 2020-2025 |
| Growth Rate | CAGR of 24.30% from 2020-2034 |
| Segmentation |
|
Table of Contents
- 1. Introduction
- 1.1. Research Scope
- 1.2. Market Segmentation
- 1.3. Research Methodology
- 1.4. Definitions and Assumptions
- 2. Executive Summary
- 2.1. Introduction
- 3. Market Dynamics
- 3.1. Introduction
- 3.2. Market Drivers
- 3.2.1. Preference toward Eco-friendly Polymers to Preserve Environment; Regulation on Non-degradable Polymers in Many Countries; Increasing Consumer Awareness in Developed and Developing Nations; Non-toxic Nature of Biodegradable Polymers
- 3.3. Market Restrains
- 3.3.1. Higher Price Compared to Petroleum-based polymers; Low Awareness in Low Income Countries
- 3.4. Market Trends
- 3.4.1. Increasing Demand from Packaging Industry
- 4. Market Factor Analysis
- 4.1. Porters Five Forces
- 4.2. Supply/Value Chain
- 4.3. PESTEL analysis
- 4.4. Market Entropy
- 4.5. Patent/Trademark Analysis
- 5. Global Bio-based Polymers Market Analysis, Insights and Forecast, 2020-2032
- 5.1. Market Analysis, Insights and Forecast - by Type
- 5.1.1. Starch-based Plastics
- 5.1.2. Poly Lactic Acid (PLA)
- 5.1.3. PolyHydroxy Alkanoates (PHA)
- 5.1.4. Polyesters (PBS, PBAT, and PCL)
- 5.1.5. Cellulose Derivatives
- 5.2. Market Analysis, Insights and Forecast - by Application
- 5.2.1. Agriculture
- 5.2.2. Textile
- 5.2.3. Electronics
- 5.2.4. Packaging
- 5.2.5. Healthcare
- 5.2.6. Other Applications
- 5.3. Market Analysis, Insights and Forecast - by Region
- 5.3.1. Asia Pacific
- 5.3.2. North America
- 5.3.3. Europe
- 5.3.4. Rest of World
- 5.1. Market Analysis, Insights and Forecast - by Type
- 6. Asia Pacific Bio-based Polymers Market Analysis, Insights and Forecast, 2020-2032
- 6.1. Market Analysis, Insights and Forecast - by Type
- 6.1.1. Starch-based Plastics
- 6.1.2. Poly Lactic Acid (PLA)
- 6.1.3. PolyHydroxy Alkanoates (PHA)
- 6.1.4. Polyesters (PBS, PBAT, and PCL)
- 6.1.5. Cellulose Derivatives
- 6.2. Market Analysis, Insights and Forecast - by Application
- 6.2.1. Agriculture
- 6.2.2. Textile
- 6.2.3. Electronics
- 6.2.4. Packaging
- 6.2.5. Healthcare
- 6.2.6. Other Applications
- 6.1. Market Analysis, Insights and Forecast - by Type
- 7. North America Bio-based Polymers Market Analysis, Insights and Forecast, 2020-2032
- 7.1. Market Analysis, Insights and Forecast - by Type
- 7.1.1. Starch-based Plastics
- 7.1.2. Poly Lactic Acid (PLA)
- 7.1.3. PolyHydroxy Alkanoates (PHA)
- 7.1.4. Polyesters (PBS, PBAT, and PCL)
- 7.1.5. Cellulose Derivatives
- 7.2. Market Analysis, Insights and Forecast - by Application
- 7.2.1. Agriculture
- 7.2.2. Textile
- 7.2.3. Electronics
- 7.2.4. Packaging
- 7.2.5. Healthcare
- 7.2.6. Other Applications
- 7.1. Market Analysis, Insights and Forecast - by Type
- 8. Europe Bio-based Polymers Market Analysis, Insights and Forecast, 2020-2032
- 8.1. Market Analysis, Insights and Forecast - by Type
- 8.1.1. Starch-based Plastics
- 8.1.2. Poly Lactic Acid (PLA)
- 8.1.3. PolyHydroxy Alkanoates (PHA)
- 8.1.4. Polyesters (PBS, PBAT, and PCL)
- 8.1.5. Cellulose Derivatives
- 8.2. Market Analysis, Insights and Forecast - by Application
- 8.2.1. Agriculture
- 8.2.2. Textile
- 8.2.3. Electronics
- 8.2.4. Packaging
- 8.2.5. Healthcare
- 8.2.6. Other Applications
- 8.1. Market Analysis, Insights and Forecast - by Type
- 9. Rest of World Bio-based Polymers Market Analysis, Insights and Forecast, 2020-2032
- 9.1. Market Analysis, Insights and Forecast - by Type
- 9.1.1. Starch-based Plastics
- 9.1.2. Poly Lactic Acid (PLA)
- 9.1.3. PolyHydroxy Alkanoates (PHA)
- 9.1.4. Polyesters (PBS, PBAT, and PCL)
- 9.1.5. Cellulose Derivatives
- 9.2. Market Analysis, Insights and Forecast - by Application
- 9.2.1. Agriculture
- 9.2.2. Textile
- 9.2.3. Electronics
- 9.2.4. Packaging
- 9.2.5. Healthcare
- 9.2.6. Other Applications
- 9.1. Market Analysis, Insights and Forecast - by Type
- 10. Competitive Analysis
- 10.1. Global Market Share Analysis 2025
- 10.2. Company Profiles
- 10.2.1 Novamont SpA
- 10.2.1.1. Overview
- 10.2.1.2. Products
- 10.2.1.3. SWOT Analysis
- 10.2.1.4. Recent Developments
- 10.2.1.5. Financials (Based on Availability)
- 10.2.2 FP International
- 10.2.2.1. Overview
- 10.2.2.2. Products
- 10.2.2.3. SWOT Analysis
- 10.2.2.4. Recent Developments
- 10.2.2.5. Financials (Based on Availability)
- 10.2.3 Innovia Films
- 10.2.3.1. Overview
- 10.2.3.2. Products
- 10.2.3.3. SWOT Analysis
- 10.2.3.4. Recent Developments
- 10.2.3.5. Financials (Based on Availability)
- 10.2.4 YIELD10 BIOSCIENCE INC (Metabolix Inc )
- 10.2.4.1. Overview
- 10.2.4.2. Products
- 10.2.4.3. SWOT Analysis
- 10.2.4.4. Recent Developments
- 10.2.4.5. Financials (Based on Availability)
- 10.2.5 FKuR
- 10.2.5.1. Overview
- 10.2.5.2. Products
- 10.2.5.3. SWOT Analysis
- 10.2.5.4. Recent Developments
- 10.2.5.5. Financials (Based on Availability)
- 10.2.6 Merck KGaA
- 10.2.6.1. Overview
- 10.2.6.2. Products
- 10.2.6.3. SWOT Analysis
- 10.2.6.4. Recent Developments
- 10.2.6.5. Financials (Based on Availability)
- 10.2.7 Cardia Bioplastics
- 10.2.7.1. Overview
- 10.2.7.2. Products
- 10.2.7.3. SWOT Analysis
- 10.2.7.4. Recent Developments
- 10.2.7.5. Financials (Based on Availability)
- 10.2.8 Rodenburg Biopolymers
- 10.2.8.1. Overview
- 10.2.8.2. Products
- 10.2.8.3. SWOT Analysis
- 10.2.8.4. Recent Developments
- 10.2.8.5. Financials (Based on Availability)
- 10.2.9 Covestro AG
- 10.2.9.1. Overview
- 10.2.9.2. Products
- 10.2.9.3. SWOT Analysis
- 10.2.9.4. Recent Developments
- 10.2.9.5. Financials (Based on Availability)
- 10.2.10 NatureWorks LLC
- 10.2.10.1. Overview
- 10.2.10.2. Products
- 10.2.10.3. SWOT Analysis
- 10.2.10.4. Recent Developments
- 10.2.10.5. Financials (Based on Availability)
- 10.2.11 thyssenkrupp AG*List Not Exhaustive
- 10.2.11.1. Overview
- 10.2.11.2. Products
- 10.2.11.3. SWOT Analysis
- 10.2.11.4. Recent Developments
- 10.2.11.5. Financials (Based on Availability)
- 10.2.12 DuPont de Nemours Inc
- 10.2.12.1. Overview
- 10.2.12.2. Products
- 10.2.12.3. SWOT Analysis
- 10.2.12.4. Recent Developments
- 10.2.12.5. Financials (Based on Availability)
- 10.2.13 Biologische Naturverpackungen GmbH & Co KG
- 10.2.13.1. Overview
- 10.2.13.2. Products
- 10.2.13.3. SWOT Analysis
- 10.2.13.4. Recent Developments
- 10.2.13.5. Financials (Based on Availability)
- 10.2.14 Corbion
- 10.2.14.1. Overview
- 10.2.14.2. Products
- 10.2.14.3. SWOT Analysis
- 10.2.14.4. Recent Developments
- 10.2.14.5. Financials (Based on Availability)
- 10.2.15 Cortec Group Management Services LLC
- 10.2.15.1. Overview
- 10.2.15.2. Products
- 10.2.15.3. SWOT Analysis
- 10.2.15.4. Recent Developments
- 10.2.15.5. Financials (Based on Availability)
- 10.2.16 SHOWA DENKO K K
- 10.2.16.1. Overview
- 10.2.16.2. Products
- 10.2.16.3. SWOT Analysis
- 10.2.16.4. Recent Developments
- 10.2.16.5. Financials (Based on Availability)
- 10.2.17 BASF SE
- 10.2.17.1. Overview
- 10.2.17.2. Products
- 10.2.17.3. SWOT Analysis
- 10.2.17.4. Recent Developments
- 10.2.17.5. Financials (Based on Availability)
- 10.2.1 Novamont SpA
List of Figures
- Figure 1: Global Bio-based Polymers Market Revenue Breakdown (Million, %) by Region 2025 & 2033
- Figure 2: Global Bio-based Polymers Market Volume Breakdown (Million, %) by Region 2025 & 2033
- Figure 3: Asia Pacific Bio-based Polymers Market Revenue (Million), by Type 2025 & 2033
- Figure 4: Asia Pacific Bio-based Polymers Market Volume (Million), by Type 2025 & 2033
- Figure 5: Asia Pacific Bio-based Polymers Market Revenue Share (%), by Type 2025 & 2033
- Figure 6: Asia Pacific Bio-based Polymers Market Volume Share (%), by Type 2025 & 2033
- Figure 7: Asia Pacific Bio-based Polymers Market Revenue (Million), by Application 2025 & 2033
- Figure 8: Asia Pacific Bio-based Polymers Market Volume (Million), by Application 2025 & 2033
- Figure 9: Asia Pacific Bio-based Polymers Market Revenue Share (%), by Application 2025 & 2033
- Figure 10: Asia Pacific Bio-based Polymers Market Volume Share (%), by Application 2025 & 2033
- Figure 11: Asia Pacific Bio-based Polymers Market Revenue (Million), by Country 2025 & 2033
- Figure 12: Asia Pacific Bio-based Polymers Market Volume (Million), by Country 2025 & 2033
- Figure 13: Asia Pacific Bio-based Polymers Market Revenue Share (%), by Country 2025 & 2033
- Figure 14: Asia Pacific Bio-based Polymers Market Volume Share (%), by Country 2025 & 2033
- Figure 15: North America Bio-based Polymers Market Revenue (Million), by Type 2025 & 2033
- Figure 16: North America Bio-based Polymers Market Volume (Million), by Type 2025 & 2033
- Figure 17: North America Bio-based Polymers Market Revenue Share (%), by Type 2025 & 2033
- Figure 18: North America Bio-based Polymers Market Volume Share (%), by Type 2025 & 2033
- Figure 19: North America Bio-based Polymers Market Revenue (Million), by Application 2025 & 2033
- Figure 20: North America Bio-based Polymers Market Volume (Million), by Application 2025 & 2033
- Figure 21: North America Bio-based Polymers Market Revenue Share (%), by Application 2025 & 2033
- Figure 22: North America Bio-based Polymers Market Volume Share (%), by Application 2025 & 2033
- Figure 23: North America Bio-based Polymers Market Revenue (Million), by Country 2025 & 2033
- Figure 24: North America Bio-based Polymers Market Volume (Million), by Country 2025 & 2033
- Figure 25: North America Bio-based Polymers Market Revenue Share (%), by Country 2025 & 2033
- Figure 26: North America Bio-based Polymers Market Volume Share (%), by Country 2025 & 2033
- Figure 27: Europe Bio-based Polymers Market Revenue (Million), by Type 2025 & 2033
- Figure 28: Europe Bio-based Polymers Market Volume (Million), by Type 2025 & 2033
- Figure 29: Europe Bio-based Polymers Market Revenue Share (%), by Type 2025 & 2033
- Figure 30: Europe Bio-based Polymers Market Volume Share (%), by Type 2025 & 2033
- Figure 31: Europe Bio-based Polymers Market Revenue (Million), by Application 2025 & 2033
- Figure 32: Europe Bio-based Polymers Market Volume (Million), by Application 2025 & 2033
- Figure 33: Europe Bio-based Polymers Market Revenue Share (%), by Application 2025 & 2033
- Figure 34: Europe Bio-based Polymers Market Volume Share (%), by Application 2025 & 2033
- Figure 35: Europe Bio-based Polymers Market Revenue (Million), by Country 2025 & 2033
- Figure 36: Europe Bio-based Polymers Market Volume (Million), by Country 2025 & 2033
- Figure 37: Europe Bio-based Polymers Market Revenue Share (%), by Country 2025 & 2033
- Figure 38: Europe Bio-based Polymers Market Volume Share (%), by Country 2025 & 2033
- Figure 39: Rest of World Bio-based Polymers Market Revenue (Million), by Type 2025 & 2033
- Figure 40: Rest of World Bio-based Polymers Market Volume (Million), by Type 2025 & 2033
- Figure 41: Rest of World Bio-based Polymers Market Revenue Share (%), by Type 2025 & 2033
- Figure 42: Rest of World Bio-based Polymers Market Volume Share (%), by Type 2025 & 2033
- Figure 43: Rest of World Bio-based Polymers Market Revenue (Million), by Application 2025 & 2033
- Figure 44: Rest of World Bio-based Polymers Market Volume (Million), by Application 2025 & 2033
- Figure 45: Rest of World Bio-based Polymers Market Revenue Share (%), by Application 2025 & 2033
- Figure 46: Rest of World Bio-based Polymers Market Volume Share (%), by Application 2025 & 2033
- Figure 47: Rest of World Bio-based Polymers Market Revenue (Million), by Country 2025 & 2033
- Figure 48: Rest of World Bio-based Polymers Market Volume (Million), by Country 2025 & 2033
- Figure 49: Rest of World Bio-based Polymers Market Revenue Share (%), by Country 2025 & 2033
- Figure 50: Rest of World Bio-based Polymers Market Volume Share (%), by Country 2025 & 2033
List of Tables
- Table 1: Global Bio-based Polymers Market Revenue Million Forecast, by Type 2020 & 2033
- Table 2: Global Bio-based Polymers Market Volume Million Forecast, by Type 2020 & 2033
- Table 3: Global Bio-based Polymers Market Revenue Million Forecast, by Application 2020 & 2033
- Table 4: Global Bio-based Polymers Market Volume Million Forecast, by Application 2020 & 2033
- Table 5: Global Bio-based Polymers Market Revenue Million Forecast, by Region 2020 & 2033
- Table 6: Global Bio-based Polymers Market Volume Million Forecast, by Region 2020 & 2033
- Table 7: Global Bio-based Polymers Market Revenue Million Forecast, by Type 2020 & 2033
- Table 8: Global Bio-based Polymers Market Volume Million Forecast, by Type 2020 & 2033
- Table 9: Global Bio-based Polymers Market Revenue Million Forecast, by Application 2020 & 2033
- Table 10: Global Bio-based Polymers Market Volume Million Forecast, by Application 2020 & 2033
- Table 11: Global Bio-based Polymers Market Revenue Million Forecast, by Country 2020 & 2033
- Table 12: Global Bio-based Polymers Market Volume Million Forecast, by Country 2020 & 2033
- Table 13: China Bio-based Polymers Market Revenue (Million) Forecast, by Application 2020 & 2033
- Table 14: China Bio-based Polymers Market Volume (Million) Forecast, by Application 2020 & 2033
- Table 15: India Bio-based Polymers Market Revenue (Million) Forecast, by Application 2020 & 2033
- Table 16: India Bio-based Polymers Market Volume (Million) Forecast, by Application 2020 & 2033
- Table 17: Japan Bio-based Polymers Market Revenue (Million) Forecast, by Application 2020 & 2033
- Table 18: Japan Bio-based Polymers Market Volume (Million) Forecast, by Application 2020 & 2033
- Table 19: South Korea Bio-based Polymers Market Revenue (Million) Forecast, by Application 2020 & 2033
- Table 20: South Korea Bio-based Polymers Market Volume (Million) Forecast, by Application 2020 & 2033
- Table 21: Rest of Asia Pacific Bio-based Polymers Market Revenue (Million) Forecast, by Application 2020 & 2033
- Table 22: Rest of Asia Pacific Bio-based Polymers Market Volume (Million) Forecast, by Application 2020 & 2033
- Table 23: Global Bio-based Polymers Market Revenue Million Forecast, by Type 2020 & 2033
- Table 24: Global Bio-based Polymers Market Volume Million Forecast, by Type 2020 & 2033
- Table 25: Global Bio-based Polymers Market Revenue Million Forecast, by Application 2020 & 2033
- Table 26: Global Bio-based Polymers Market Volume Million Forecast, by Application 2020 & 2033
- Table 27: Global Bio-based Polymers Market Revenue Million Forecast, by Country 2020 & 2033
- Table 28: Global Bio-based Polymers Market Volume Million Forecast, by Country 2020 & 2033
- Table 29: United States Bio-based Polymers Market Revenue (Million) Forecast, by Application 2020 & 2033
- Table 30: United States Bio-based Polymers Market Volume (Million) Forecast, by Application 2020 & 2033
- Table 31: Canada Bio-based Polymers Market Revenue (Million) Forecast, by Application 2020 & 2033
- Table 32: Canada Bio-based Polymers Market Volume (Million) Forecast, by Application 2020 & 2033
- Table 33: Mexico Bio-based Polymers Market Revenue (Million) Forecast, by Application 2020 & 2033
- Table 34: Mexico Bio-based Polymers Market Volume (Million) Forecast, by Application 2020 & 2033
- Table 35: Global Bio-based Polymers Market Revenue Million Forecast, by Type 2020 & 2033
- Table 36: Global Bio-based Polymers Market Volume Million Forecast, by Type 2020 & 2033
- Table 37: Global Bio-based Polymers Market Revenue Million Forecast, by Application 2020 & 2033
- Table 38: Global Bio-based Polymers Market Volume Million Forecast, by Application 2020 & 2033
- Table 39: Global Bio-based Polymers Market Revenue Million Forecast, by Country 2020 & 2033
- Table 40: Global Bio-based Polymers Market Volume Million Forecast, by Country 2020 & 2033
- Table 41: Germany Bio-based Polymers Market Revenue (Million) Forecast, by Application 2020 & 2033
- Table 42: Germany Bio-based Polymers Market Volume (Million) Forecast, by Application 2020 & 2033
- Table 43: United Kingdom Bio-based Polymers Market Revenue (Million) Forecast, by Application 2020 & 2033
- Table 44: United Kingdom Bio-based Polymers Market Volume (Million) Forecast, by Application 2020 & 2033
- Table 45: Italy Bio-based Polymers Market Revenue (Million) Forecast, by Application 2020 & 2033
- Table 46: Italy Bio-based Polymers Market Volume (Million) Forecast, by Application 2020 & 2033
- Table 47: France Bio-based Polymers Market Revenue (Million) Forecast, by Application 2020 & 2033
- Table 48: France Bio-based Polymers Market Volume (Million) Forecast, by Application 2020 & 2033
- Table 49: Rest of Europe Bio-based Polymers Market Revenue (Million) Forecast, by Application 2020 & 2033
- Table 50: Rest of Europe Bio-based Polymers Market Volume (Million) Forecast, by Application 2020 & 2033
- Table 51: Global Bio-based Polymers Market Revenue Million Forecast, by Type 2020 & 2033
- Table 52: Global Bio-based Polymers Market Volume Million Forecast, by Type 2020 & 2033
- Table 53: Global Bio-based Polymers Market Revenue Million Forecast, by Application 2020 & 2033
- Table 54: Global Bio-based Polymers Market Volume Million Forecast, by Application 2020 & 2033
- Table 55: Global Bio-based Polymers Market Revenue Million Forecast, by Country 2020 & 2033
- Table 56: Global Bio-based Polymers Market Volume Million Forecast, by Country 2020 & 2033
- Table 57: Brazil Bio-based Polymers Market Revenue (Million) Forecast, by Application 2020 & 2033
- Table 58: Brazil Bio-based Polymers Market Volume (Million) Forecast, by Application 2020 & 2033
- Table 59: Saudi Arabia Bio-based Polymers Market Revenue (Million) Forecast, by Application 2020 & 2033
- Table 60: Saudi Arabia Bio-based Polymers Market Volume (Million) Forecast, by Application 2020 & 2033
- Table 61: Rest of the World Bio-based Polymers Market Revenue (Million) Forecast, by Application 2020 & 2033
- Table 62: Rest of the World Bio-based Polymers Market Volume (Million) Forecast, by Application 2020 & 2033
Frequently Asked Questions
1. What is the projected Compound Annual Growth Rate (CAGR) of the Bio-based Polymers Market?
The projected CAGR is approximately 24.30%.
2. Which companies are prominent players in the Bio-based Polymers Market?
Key companies in the market include Novamont SpA, FP International, Innovia Films, YIELD10 BIOSCIENCE INC (Metabolix Inc ), FKuR, Merck KGaA, Cardia Bioplastics, Rodenburg Biopolymers, Covestro AG, NatureWorks LLC, thyssenkrupp AG*List Not Exhaustive, DuPont de Nemours Inc, Biologische Naturverpackungen GmbH & Co KG, Corbion, Cortec Group Management Services LLC, SHOWA DENKO K K, BASF SE.
3. What are the main segments of the Bio-based Polymers Market?
The market segments include Type, Application.
4. Can you provide details about the market size?
The market size is estimated to be USD XX Million as of 2022.
5. What are some drivers contributing to market growth?
Preference toward Eco-friendly Polymers to Preserve Environment; Regulation on Non-degradable Polymers in Many Countries; Increasing Consumer Awareness in Developed and Developing Nations; Non-toxic Nature of Biodegradable Polymers.
6. What are the notable trends driving market growth?
Increasing Demand from Packaging Industry.
7. Are there any restraints impacting market growth?
Higher Price Compared to Petroleum-based polymers; Low Awareness in Low Income Countries.
8. Can you provide examples of recent developments in the market?
N/A
9. What pricing options are available for accessing the report?
Pricing options include single-user, multi-user, and enterprise licenses priced at USD 4750, USD 5250, and USD 8750 respectively.
10. Is the market size provided in terms of value or volume?
The market size is provided in terms of value, measured in Million and volume, measured in Million.
11. Are there any specific market keywords associated with the report?
Yes, the market keyword associated with the report is "Bio-based Polymers Market," which aids in identifying and referencing the specific market segment covered.
12. How do I determine which pricing option suits my needs best?
The pricing options vary based on user requirements and access needs. Individual users may opt for single-user licenses, while businesses requiring broader access may choose multi-user or enterprise licenses for cost-effective access to the report.
13. Are there any additional resources or data provided in the Bio-based Polymers Market report?
While the report offers comprehensive insights, it's advisable to review the specific contents or supplementary materials provided to ascertain if additional resources or data are available.
14. How can I stay updated on further developments or reports in the Bio-based Polymers Market?
To stay informed about further developments, trends, and reports in the Bio-based Polymers Market, consider subscribing to industry newsletters, following relevant companies and organizations, or regularly checking reputable industry news sources and publications.
Methodology
Step 1 - Identification of Relevant Samples Size from Population Database


Step 2 - Approaches for Defining Global Market Size (Value, Volume* & Price*)

Note*: In applicable scenarios
Step 3 - Data Sources
Primary Research
- Web Analytics
- Survey Reports
- Research Institute
- Latest Research Reports
- Opinion Leaders
Secondary Research
- Annual Reports
- White Paper
- Latest Press Release
- Industry Association
- Paid Database
- Investor Presentations

Step 4 - Data Triangulation
Involves using different sources of information in order to increase the validity of a study
These sources are likely to be stakeholders in a program - participants, other researchers, program staff, other community members, and so on.
Then we put all data in single framework & apply various statistical tools to find out the dynamic on the market.
During the analysis stage, feedback from the stakeholder groups would be compared to determine areas of agreement as well as areas of divergence