

Key Insights
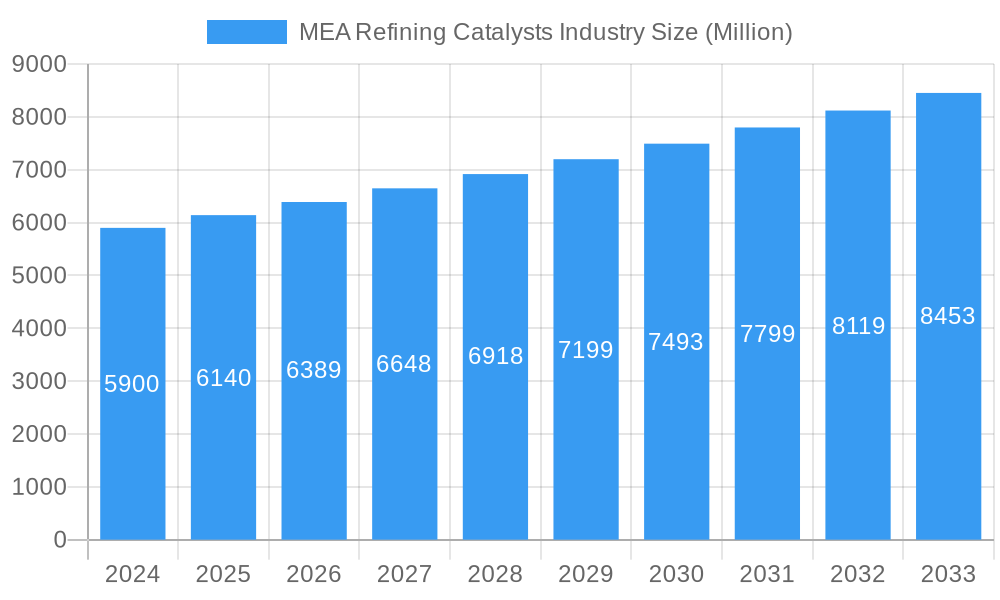
The Middle East and Africa (MEA) refining catalysts market is poised for robust growth, driven by increasing demand for refined petroleum products and a strategic focus on enhancing refinery efficiency and product quality across the region. With a market size of approximately USD 5.9 billion in 2024, the industry is expected to expand at a healthy Compound Annual Growth Rate (CAGR) of 4.1% through 2033. This growth is underpinned by significant investments in refinery upgrades and new capacity expansions, particularly in key economies like Saudi Arabia, the United Arab Emirates, and Kuwait, aimed at meeting rising domestic and international demand for fuels and petrochemicals. Furthermore, stringent environmental regulations are compelling refiners to adopt advanced catalysts that facilitate cleaner fuel production and reduce emissions, thereby contributing to market expansion. The demand for catalysts in crucial refining processes such as Fluid Catalytic Cracking (FCC), hydrotreating, and hydrocracking is expected to remain strong, as refiners strive to maximize yields of high-value products like gasoline and diesel while adhering to evolving quality standards.
MEA Refining Catalysts Industry Market Size (In Billion)
The MEA refining catalysts market is characterized by a diverse range of product types and ingredients catering to the specific needs of various refining operations. Fluid Catalytic Cracking (FCC) catalysts are anticipated to dominate the market share, owing to their critical role in converting heavy crude oil fractions into lighter, more valuable products. Hydrotreating catalysts are also experiencing significant demand as refiners work to remove sulfur and other impurities from fuels to meet increasingly stringent environmental norms. Geographically, Saudi Arabia, with its vast refining infrastructure and strategic importance in the global oil market, is projected to be the largest contributor to the market. Emerging markets and ongoing diversification efforts within the Middle East and Africa will further propel the demand for advanced refining catalysts. Key players are actively engaged in research and development to introduce innovative catalyst solutions that offer improved performance, longer lifespan, and enhanced sustainability, further shaping the competitive landscape of this dynamic industry.
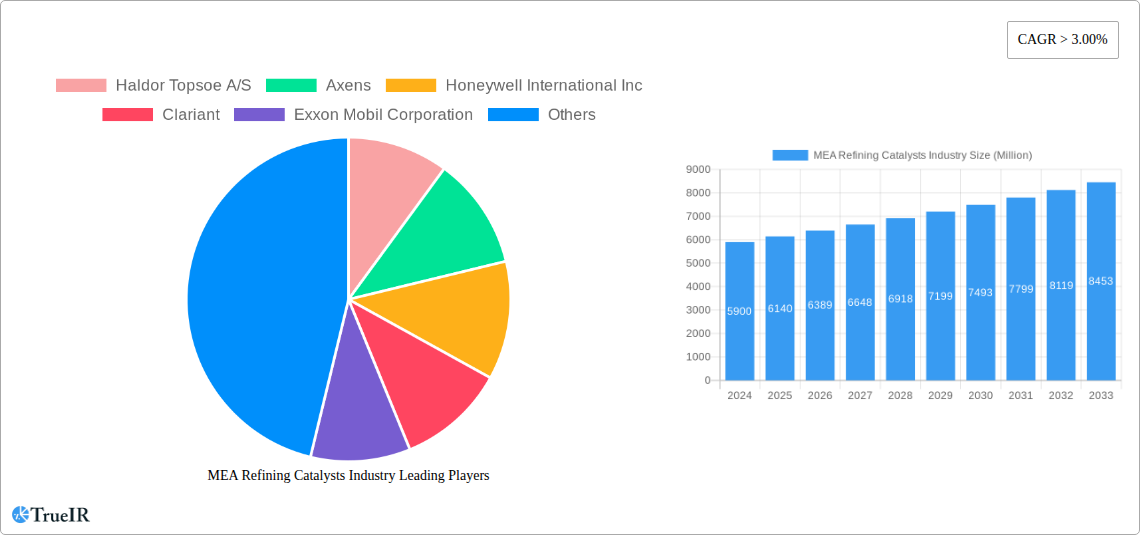
MEA Refining Catalysts Industry Company Market Share
MEA Refining Catalysts Industry Market Structure & Competitive Landscape
The MEA Refining Catalysts industry is characterized by a moderately concentrated market, with a significant presence of major global players, including Haldor Topsoe A/S, Axens, Honeywell International Inc, Clariant, Exxon Mobil Corporation, Evonik Industries AG, W R Grace & Co -Conn, BASF SE, Chevron Corporation, DuPont, Saudi Arabian Oil Co, JGC C & C, Johnson Matthey, and Albemarle Corporation. Innovation remains a pivotal driver, with companies continually investing in R&D to develop advanced catalysts that enhance efficiency, yield, and environmental compliance in refining processes. Regulatory landscapes, particularly concerning emissions and fuel quality standards, significantly influence market dynamics, pushing for the adoption of cleaner technologies. The threat of product substitutes is relatively low due to the specialized nature of refining catalysts, but advancements in alternative processing technologies could pose a long-term challenge. End-user segmentation is driven by refinery types and the specific processing units they employ. Mergers and acquisitions (M&A) are sporadic but significant, aimed at consolidating market share, acquiring new technologies, and expanding geographical reach. For instance, the historical period saw several strategic partnerships and acquisitions in the billion-dollar range, bolstering the competitive positioning of key entities. The industry is highly sensitive to crude oil prices and refining margins, which indirectly impact demand for catalysts.
MEA Refining Catalysts Industry Market Trends & Opportunities
The MEA Refining Catalysts industry is poised for substantial growth, with market size projected to reach tens of billions of dollars by 2033. This expansion is fueled by increasing global demand for refined petroleum products, coupled with the region's strategic importance as a major oil producer and exporter. Technological shifts are a dominant trend, with a growing emphasis on catalysts that enable the production of cleaner fuels (e.g., low-sulfur diesel and gasoline) and maximize the yield of high-value products from heavier crude oils. This includes advancements in hydrotreating, hydrocracking, and fluid catalytic cracking (FCC) catalysts. Consumer preferences, driven by stringent environmental regulations and a desire for more sustainable energy solutions, are pushing refineries to adopt more efficient and environmentally friendly refining processes. Competitive dynamics are intensifying, with established players vying for market share through product innovation, strategic collaborations, and a focus on providing comprehensive catalyst management services. The CAGR for the forecast period is estimated to be in the low double digits, reflecting this robust growth trajectory. Opportunities abound in the development of next-generation catalysts with improved selectivity, longer lifespan, and enhanced resistance to poisoning. Furthermore, the increasing complexity of crude oil feedstock necessitates the development of more robust and versatile catalyst solutions. The growing focus on petrochemical integration within refineries also presents new avenues for catalyst development and market penetration. As refineries in the MEA region undergo modernization and expansion projects, the demand for advanced refining catalysts is expected to skyrocket, creating significant market penetration opportunities for innovative solutions.
Dominant Markets & Segments in MEA Refining Catalysts Industry
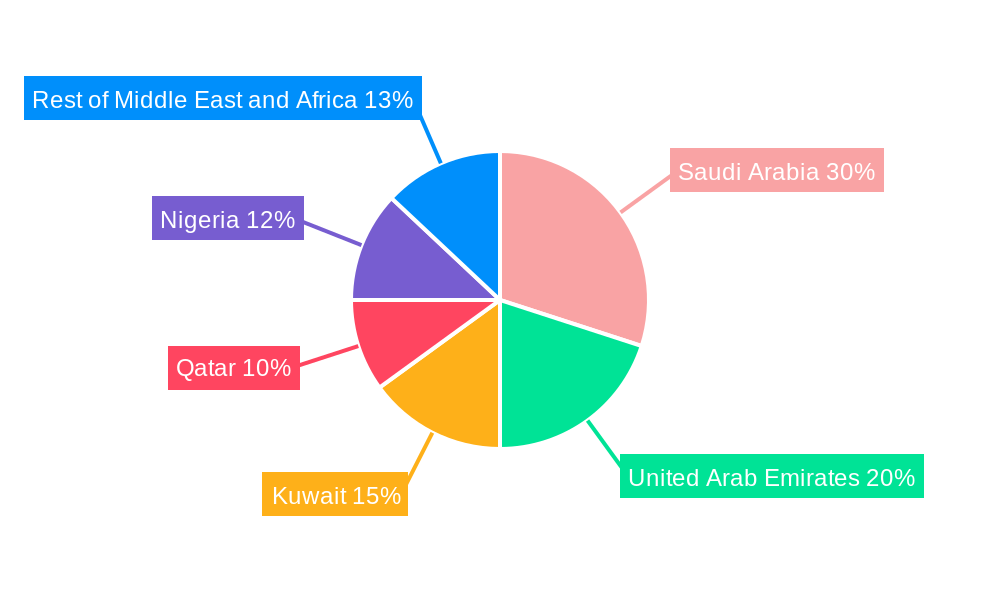
Saudi Arabia stands out as the dominant market within the MEA Refining Catalysts industry, driven by its vast refining capacity and continuous investments in upgrading existing facilities and building new ones. The Geography: Saudi Arabia segment is projected to hold the largest market share due to the presence of major refining hubs and the government's strategic initiatives to diversify its economy and enhance its petrochemical production capabilities. Kuwait and the United Arab Emirates are also significant contributors, with ongoing refinery expansions and a focus on producing higher-quality fuels.
Key growth drivers in these dominant markets include:
- Infrastructure Development: Large-scale refinery projects and expansions in Saudi Arabia, such as the Jizan Refinery and Petrochemical Complex, necessitate a massive influx of advanced refining catalysts.
- Regulatory Policies: Stringent environmental regulations, particularly those aimed at reducing sulfur content in fuels, are compelling refineries to adopt advanced hydrotreating and hydrocracking catalysts.
- Petrochemical Integration: The trend of integrating petrochemical production with refining operations is driving demand for specialized catalysts that can handle a wider range of feedstocks and produce higher-value chemical intermediates.
- Crude Oil Quality: The increasing processing of heavier and more sour crude oils in the region necessitates the use of more robust and efficient catalysts.
The Type: Fluid Catalytic Cracking Catalysts segment is a major contributor to the overall market revenue, essential for gasoline production. However, Type: Hydrotreating Catalysts are witnessing the most rapid growth due to the global push for cleaner fuels. Ingredient: Zeolite remains a critical component in many refining catalysts, particularly FCC catalysts, and its demand is closely tied to the growth of this segment. The increasing complexity of refining processes and the need for higher yields are also driving the demand for Ingredient: Metal based catalysts and specialized Ingredient: Chemical Compounds. The Rest of Middle-East and Africa region, while currently smaller in market share, presents significant untapped potential for future growth, particularly in countries like Nigeria, which are investing in refining capacity expansion.
MEA Refining Catalysts Industry Product Analysis
Product innovation in the MEA Refining Catalysts industry is laser-focused on enhancing refinery efficiency, reducing operational costs, and meeting increasingly stringent environmental regulations. Manufacturers are developing advanced Fluid Catalytic Cracking (FCC) catalysts that offer higher yields of valuable products like gasoline and light olefins, while also minimizing coke formation. Hydrotreating catalysts are being engineered for superior sulfur and nitrogen removal, enabling refineries to produce ultra-low sulfur diesel (ULSD) and other clean fuels. Hydrocracking catalysts are evolving to process heavier feedstocks and produce lighter, more valuable fractions. The competitive advantage lies in catalysts offering extended lifespan, higher activity, and improved selectivity, directly impacting a refinery's profitability and environmental footprint.
Key Drivers, Barriers & Challenges in MEA Refining Catalysts Industry
Key Drivers:
- Increasing demand for refined petroleum products: Driven by population growth and industrialization in the MEA region.
- Stringent environmental regulations: Pushing for cleaner fuels and reduced emissions, necessitating advanced catalyst technologies.
- Refinery modernization and expansion projects: Significant investments in upgrading existing facilities and building new ones.
- Shift towards heavier and sourer crude oil processing: Requiring more robust and efficient catalysts.
- Growing petrochemical integration: Creating demand for specialized catalysts.
Barriers & Challenges:
- High R&D costs for new catalyst development: Requiring substantial financial investment.
- Long lead times for catalyst development and commercialization: Potentially delaying market entry.
- Volatility in crude oil prices: Affecting refinery profitability and capital expenditure for catalyst upgrades.
- Supply chain disruptions: Particularly for raw materials, impacting production and delivery.
- Intense competition: From established global players and emerging regional manufacturers.
- Skilled workforce availability: For the operation and maintenance of advanced refining units.
Growth Drivers in the MEA Refining Catalysts Industry Market
The MEA Refining Catalysts industry is propelled by several key growth drivers. Technologically, the relentless pursuit of higher yields and cleaner fuel production is spurring innovation in catalyst formulations, particularly for hydrotreating and hydrocracking processes. Economically, the burgeoning demand for transportation fuels and petrochemicals within the region, coupled with significant government investments in expanding refining capacities, creates a robust market environment. Regulatory drivers, such as increasingly strict environmental mandates for sulfur content in fuels, directly necessitate the adoption of advanced catalysts that can achieve higher levels of desulfurization and denitrification. Furthermore, the trend of crude oil price volatility often incentivizes refineries to invest in more efficient processes that can extract maximum value from their feedstocks, further boosting catalyst demand.
Challenges Impacting MEA Refining Catalysts Industry Growth
Several challenges impact the growth of the MEA Refining Catalysts industry. Regulatory complexities, while driving innovation, can also lead to increased compliance costs and longer approval times for new catalyst technologies. Supply chain issues, especially concerning the availability and price fluctuations of key raw materials like zeolites and precious metals, can disrupt production and impact catalyst costs. Competitive pressures are intense, with established global players and emerging regional manufacturers vying for market share, often leading to price wars and reduced profit margins. Additionally, the long lifecycle of some refining infrastructure means that significant capital investment is required for catalyst upgrades, which can be constrained by economic downturns or shifts in global energy demand. The development and adoption of highly specialized catalysts also demand significant technical expertise, posing a barrier for some smaller refining operations.
Key Players Shaping the MEA Refining Catalysts Industry Market
- Haldor Topsoe A/S
- Axens
- Honeywell International Inc
- Clariant
- Exxon Mobil Corporation
- Evonik Industries AG
- W R Grace & Co -Conn
- BASF SE
- Chevron Corporation
- DuPont
- Saudi Arabian Oil Co
- JGC C & C
- Johnson Matthey
- Albemarle Corporation
Significant MEA Refining Catalysts Industry Industry Milestones
- 2019: Launch of new, highly active hydrotreating catalysts by major players, enabling deeper sulfur removal to meet stricter fuel standards.
- 2020: Strategic partnerships formed between catalyst manufacturers and national oil companies in the MEA region to co-develop tailored catalyst solutions for local crude oil feedstocks.
- 2021: Significant investment by a leading catalyst producer in expanding its manufacturing capacity within the MEA region to meet growing demand.
- 2022: Introduction of advanced zeolites for FCC applications, offering improved olefin selectivity and higher gasoline yields.
- 2023: Acquisition of a specialized catalyst technology firm by a global chemical giant to bolster its portfolio in the refining sector.
- 2024: Release of new generation hydrocracking catalysts designed to handle heavier crude oils with increased efficiency.
Future Outlook for MEA Refining Catalysts Industry Market
The future outlook for the MEA Refining Catalysts industry is exceptionally bright, driven by a confluence of factors. Continued expansion of refining capacities, coupled with a global demand for cleaner transportation fuels, will sustain a robust market for advanced catalysts. Opportunities lie in the development of catalysts that enhance flexibility for refineries to process a wider range of crude oil types and maximize the production of petrochemical feedstocks. The increasing focus on sustainability and carbon capture technologies within the refining sector will also create new avenues for catalyst innovation. Strategic collaborations, technological advancements in catalyst design, and a focus on providing integrated catalyst management services will be crucial for market leaders to capitalize on the projected growth, which is expected to see multi-billion dollar investments in the coming years.
MEA Refining Catalysts Industry Segmentation
-
1. Ingredient
- 1.1. Zeolite
- 1.2. Metal
- 1.3. Chemical Compounds
-
2. Type
- 2.1. Fluid Catalytic Cracking Catalysts
- 2.2. Reforming Catalysts
- 2.3. Hydrotreating Catalysts
- 2.4. Hydrocracking Catalysts
- 2.5. Isomerization Catalysts
- 2.6. Alkylation Catalysts
-
3. Geography
- 3.1. Saudi Arabia
- 3.2. Kuwait
- 3.3. Qatar
- 3.4. Nigeria
- 3.5. United Arab Emirates
- 3.6. Rest of Middle-East and Africa
MEA Refining Catalysts Industry Segmentation By Geography
- 1. Saudi Arabia
- 2. Kuwait
- 3. Qatar
- 4. Nigeria
- 5. United Arab Emirates
- 6. Rest of Middle East and Africa
MEA Refining Catalysts Industry Regional Market Share
Geographic Coverage of MEA Refining Catalysts Industry
MEA Refining Catalysts Industry REPORT HIGHLIGHTS
| Aspects | Details |
|---|---|
| Study Period | 2020-2034 |
| Base Year | 2025 |
| Estimated Year | 2026 |
| Forecast Period | 2026-2034 |
| Historical Period | 2020-2025 |
| Growth Rate | CAGR of 5.85% from 2020-2034 |
| Segmentation |
|
Table of Contents
- 1. Introduction
- 1.1. Research Scope
- 1.2. Market Segmentation
- 1.3. Research Objective
- 1.4. Definitions and Assumptions
- 2. Executive Summary
- 2.1. Market Snapshot
- 3. Market Dynamics
- 3.1. Market Drivers
- 3.2. Market Restrains
- 3.3. Market Trends
- 3.4. Market Opportunities
- 4. Market Factor Analysis
- 4.1. Porters Five Forces
- 4.1.1. Bargaining Power of Suppliers
- 4.1.2. Bargaining Power of Buyers
- 4.1.3. Threat of New Entrants
- 4.1.4. Threat of Substitutes
- 4.1.5. Competitive Rivalry
- 4.2. PESTEL analysis
- 4.3. BCG Analysis
- 4.3.1. Stars (High Growth, High Market Share)
- 4.3.2. Cash Cows (Low Growth, High Market Share)
- 4.3.3. Question Mark (High Growth, Low Market Share)
- 4.3.4. Dogs (Low Growth, Low Market Share)
- 4.4. Ansoff Matrix Analysis
- 4.5. Supply Chain Analysis
- 4.6. Regulatory Landscape
- 4.7. Current Market Potential and Opportunity Assessment (TAM–SAM–SOM Framework)
- 4.8. TIR Analyst Note
- 4.1. Porters Five Forces
- 5. Market Analysis, Insights and Forecast 2021-2033
- 5.1. Market Analysis, Insights and Forecast - by Ingredient
- 5.1.1. Zeolite
- 5.1.2. Metal
- 5.1.3. Chemical Compounds
- 5.2. Market Analysis, Insights and Forecast - by Type
- 5.2.1. Fluid Catalytic Cracking Catalysts
- 5.2.2. Reforming Catalysts
- 5.2.3. Hydrotreating Catalysts
- 5.2.4. Hydrocracking Catalysts
- 5.2.5. Isomerization Catalysts
- 5.2.6. Alkylation Catalysts
- 5.3. Market Analysis, Insights and Forecast - by Geography
- 5.3.1. Saudi Arabia
- 5.3.2. Kuwait
- 5.3.3. Qatar
- 5.3.4. Nigeria
- 5.3.5. United Arab Emirates
- 5.3.6. Rest of Middle-East and Africa
- 5.4. Market Analysis, Insights and Forecast - by Region
- 5.4.1. Saudi Arabia
- 5.4.2. Kuwait
- 5.4.3. Qatar
- 5.4.4. Nigeria
- 5.4.5. United Arab Emirates
- 5.4.6. Rest of Middle East and Africa
- 5.1. Market Analysis, Insights and Forecast - by Ingredient
- 6. MEA Refining Catalysts Industry Analysis, Insights and Forecast, 2021-2033
- 6.1. Market Analysis, Insights and Forecast - by Ingredient
- 6.1.1. Zeolite
- 6.1.2. Metal
- 6.1.3. Chemical Compounds
- 6.2. Market Analysis, Insights and Forecast - by Type
- 6.2.1. Fluid Catalytic Cracking Catalysts
- 6.2.2. Reforming Catalysts
- 6.2.3. Hydrotreating Catalysts
- 6.2.4. Hydrocracking Catalysts
- 6.2.5. Isomerization Catalysts
- 6.2.6. Alkylation Catalysts
- 6.3. Market Analysis, Insights and Forecast - by Geography
- 6.3.1. Saudi Arabia
- 6.3.2. Kuwait
- 6.3.3. Qatar
- 6.3.4. Nigeria
- 6.3.5. United Arab Emirates
- 6.3.6. Rest of Middle-East and Africa
- 6.1. Market Analysis, Insights and Forecast - by Ingredient
- 7. Saudi Arabia MEA Refining Catalysts Industry Analysis, Insights and Forecast, 2020-2032
- 7.1. Market Analysis, Insights and Forecast - by Ingredient
- 7.1.1. Zeolite
- 7.1.2. Metal
- 7.1.3. Chemical Compounds
- 7.2. Market Analysis, Insights and Forecast - by Type
- 7.2.1. Fluid Catalytic Cracking Catalysts
- 7.2.2. Reforming Catalysts
- 7.2.3. Hydrotreating Catalysts
- 7.2.4. Hydrocracking Catalysts
- 7.2.5. Isomerization Catalysts
- 7.2.6. Alkylation Catalysts
- 7.3. Market Analysis, Insights and Forecast - by Geography
- 7.3.1. Saudi Arabia
- 7.3.2. Kuwait
- 7.3.3. Qatar
- 7.3.4. Nigeria
- 7.3.5. United Arab Emirates
- 7.3.6. Rest of Middle-East and Africa
- 7.1. Market Analysis, Insights and Forecast - by Ingredient
- 8. Kuwait MEA Refining Catalysts Industry Analysis, Insights and Forecast, 2020-2032
- 8.1. Market Analysis, Insights and Forecast - by Ingredient
- 8.1.1. Zeolite
- 8.1.2. Metal
- 8.1.3. Chemical Compounds
- 8.2. Market Analysis, Insights and Forecast - by Type
- 8.2.1. Fluid Catalytic Cracking Catalysts
- 8.2.2. Reforming Catalysts
- 8.2.3. Hydrotreating Catalysts
- 8.2.4. Hydrocracking Catalysts
- 8.2.5. Isomerization Catalysts
- 8.2.6. Alkylation Catalysts
- 8.3. Market Analysis, Insights and Forecast - by Geography
- 8.3.1. Saudi Arabia
- 8.3.2. Kuwait
- 8.3.3. Qatar
- 8.3.4. Nigeria
- 8.3.5. United Arab Emirates
- 8.3.6. Rest of Middle-East and Africa
- 8.1. Market Analysis, Insights and Forecast - by Ingredient
- 9. Qatar MEA Refining Catalysts Industry Analysis, Insights and Forecast, 2020-2032
- 9.1. Market Analysis, Insights and Forecast - by Ingredient
- 9.1.1. Zeolite
- 9.1.2. Metal
- 9.1.3. Chemical Compounds
- 9.2. Market Analysis, Insights and Forecast - by Type
- 9.2.1. Fluid Catalytic Cracking Catalysts
- 9.2.2. Reforming Catalysts
- 9.2.3. Hydrotreating Catalysts
- 9.2.4. Hydrocracking Catalysts
- 9.2.5. Isomerization Catalysts
- 9.2.6. Alkylation Catalysts
- 9.3. Market Analysis, Insights and Forecast - by Geography
- 9.3.1. Saudi Arabia
- 9.3.2. Kuwait
- 9.3.3. Qatar
- 9.3.4. Nigeria
- 9.3.5. United Arab Emirates
- 9.3.6. Rest of Middle-East and Africa
- 9.1. Market Analysis, Insights and Forecast - by Ingredient
- 10. Nigeria MEA Refining Catalysts Industry Analysis, Insights and Forecast, 2020-2032
- 10.1. Market Analysis, Insights and Forecast - by Ingredient
- 10.1.1. Zeolite
- 10.1.2. Metal
- 10.1.3. Chemical Compounds
- 10.2. Market Analysis, Insights and Forecast - by Type
- 10.2.1. Fluid Catalytic Cracking Catalysts
- 10.2.2. Reforming Catalysts
- 10.2.3. Hydrotreating Catalysts
- 10.2.4. Hydrocracking Catalysts
- 10.2.5. Isomerization Catalysts
- 10.2.6. Alkylation Catalysts
- 10.3. Market Analysis, Insights and Forecast - by Geography
- 10.3.1. Saudi Arabia
- 10.3.2. Kuwait
- 10.3.3. Qatar
- 10.3.4. Nigeria
- 10.3.5. United Arab Emirates
- 10.3.6. Rest of Middle-East and Africa
- 10.1. Market Analysis, Insights and Forecast - by Ingredient
- 11. United Arab Emirates MEA Refining Catalysts Industry Analysis, Insights and Forecast, 2020-2032
- 11.1. Market Analysis, Insights and Forecast - by Ingredient
- 11.1.1. Zeolite
- 11.1.2. Metal
- 11.1.3. Chemical Compounds
- 11.2. Market Analysis, Insights and Forecast - by Type
- 11.2.1. Fluid Catalytic Cracking Catalysts
- 11.2.2. Reforming Catalysts
- 11.2.3. Hydrotreating Catalysts
- 11.2.4. Hydrocracking Catalysts
- 11.2.5. Isomerization Catalysts
- 11.2.6. Alkylation Catalysts
- 11.3. Market Analysis, Insights and Forecast - by Geography
- 11.3.1. Saudi Arabia
- 11.3.2. Kuwait
- 11.3.3. Qatar
- 11.3.4. Nigeria
- 11.3.5. United Arab Emirates
- 11.3.6. Rest of Middle-East and Africa
- 11.1. Market Analysis, Insights and Forecast - by Ingredient
- 12. Rest of Middle East and Africa MEA Refining Catalysts Industry Analysis, Insights and Forecast, 2020-2032
- 12.1. Market Analysis, Insights and Forecast - by Ingredient
- 12.1.1. Zeolite
- 12.1.2. Metal
- 12.1.3. Chemical Compounds
- 12.2. Market Analysis, Insights and Forecast - by Type
- 12.2.1. Fluid Catalytic Cracking Catalysts
- 12.2.2. Reforming Catalysts
- 12.2.3. Hydrotreating Catalysts
- 12.2.4. Hydrocracking Catalysts
- 12.2.5. Isomerization Catalysts
- 12.2.6. Alkylation Catalysts
- 12.3. Market Analysis, Insights and Forecast - by Geography
- 12.3.1. Saudi Arabia
- 12.3.2. Kuwait
- 12.3.3. Qatar
- 12.3.4. Nigeria
- 12.3.5. United Arab Emirates
- 12.3.6. Rest of Middle-East and Africa
- 12.1. Market Analysis, Insights and Forecast - by Ingredient
- 13. Competitive Analysis
- 13.1. Company Profiles
- 13.1.1 Haldor Topsoe A/S
- 13.1.1.1. Company Overview
- 13.1.1.2. Products
- 13.1.1.3. Company Financials
- 13.1.1.4. SWOT Analysis
- 13.1.2 Axens
- 13.1.2.1. Company Overview
- 13.1.2.2. Products
- 13.1.2.3. Company Financials
- 13.1.2.4. SWOT Analysis
- 13.1.3 Honeywell International Inc
- 13.1.3.1. Company Overview
- 13.1.3.2. Products
- 13.1.3.3. Company Financials
- 13.1.3.4. SWOT Analysis
- 13.1.4 Clariant
- 13.1.4.1. Company Overview
- 13.1.4.2. Products
- 13.1.4.3. Company Financials
- 13.1.4.4. SWOT Analysis
- 13.1.5 Exxon Mobil Corporation
- 13.1.5.1. Company Overview
- 13.1.5.2. Products
- 13.1.5.3. Company Financials
- 13.1.5.4. SWOT Analysis
- 13.1.6 Evonik Industries AG
- 13.1.6.1. Company Overview
- 13.1.6.2. Products
- 13.1.6.3. Company Financials
- 13.1.6.4. SWOT Analysis
- 13.1.7 W R Grace & Co -Conn
- 13.1.7.1. Company Overview
- 13.1.7.2. Products
- 13.1.7.3. Company Financials
- 13.1.7.4. SWOT Analysis
- 13.1.8 BASF SE
- 13.1.8.1. Company Overview
- 13.1.8.2. Products
- 13.1.8.3. Company Financials
- 13.1.8.4. SWOT Analysis
- 13.1.9 Chevron Corporation
- 13.1.9.1. Company Overview
- 13.1.9.2. Products
- 13.1.9.3. Company Financials
- 13.1.9.4. SWOT Analysis
- 13.1.10 DuPont
- 13.1.10.1. Company Overview
- 13.1.10.2. Products
- 13.1.10.3. Company Financials
- 13.1.10.4. SWOT Analysis
- 13.1.11 Saudi Arabian Oil Co
- 13.1.11.1. Company Overview
- 13.1.11.2. Products
- 13.1.11.3. Company Financials
- 13.1.11.4. SWOT Analysis
- 13.1.12 JGC C & C
- 13.1.12.1. Company Overview
- 13.1.12.2. Products
- 13.1.12.3. Company Financials
- 13.1.12.4. SWOT Analysis
- 13.1.13 Johnson Matthey
- 13.1.13.1. Company Overview
- 13.1.13.2. Products
- 13.1.13.3. Company Financials
- 13.1.13.4. SWOT Analysis
- 13.1.14 Albemarle Corporation
- 13.1.14.1. Company Overview
- 13.1.14.2. Products
- 13.1.14.3. Company Financials
- 13.1.14.4. SWOT Analysis
- 13.1.1 Haldor Topsoe A/S
- 13.2. Market Entropy
- 13.2.1 Company's Key Areas Served
- 13.2.2 Recent Developments
- 13.3. Company Market Share Analysis 2025
- 13.3.1 Top 5 Companies Market Share Analysis
- 13.3.2 Top 3 Companies Market Share Analysis
- 13.4. List of Potential Customers
- 14. Research Methodology
List of Figures
- Figure 1: MEA Refining Catalysts Industry Revenue Breakdown (billion, %) by Product 2025 & 2033
- Figure 2: MEA Refining Catalysts Industry Share (%) by Company 2025
List of Tables
- Table 1: MEA Refining Catalysts Industry Revenue billion Forecast, by Ingredient 2020 & 2033
- Table 2: MEA Refining Catalysts Industry Volume K Tons Forecast, by Ingredient 2020 & 2033
- Table 3: MEA Refining Catalysts Industry Revenue billion Forecast, by Type 2020 & 2033
- Table 4: MEA Refining Catalysts Industry Volume K Tons Forecast, by Type 2020 & 2033
- Table 5: MEA Refining Catalysts Industry Revenue billion Forecast, by Geography 2020 & 2033
- Table 6: MEA Refining Catalysts Industry Volume K Tons Forecast, by Geography 2020 & 2033
- Table 7: MEA Refining Catalysts Industry Revenue billion Forecast, by Region 2020 & 2033
- Table 8: MEA Refining Catalysts Industry Volume K Tons Forecast, by Region 2020 & 2033
- Table 9: MEA Refining Catalysts Industry Revenue billion Forecast, by Ingredient 2020 & 2033
- Table 10: MEA Refining Catalysts Industry Volume K Tons Forecast, by Ingredient 2020 & 2033
- Table 11: MEA Refining Catalysts Industry Revenue billion Forecast, by Type 2020 & 2033
- Table 12: MEA Refining Catalysts Industry Volume K Tons Forecast, by Type 2020 & 2033
- Table 13: MEA Refining Catalysts Industry Revenue billion Forecast, by Geography 2020 & 2033
- Table 14: MEA Refining Catalysts Industry Volume K Tons Forecast, by Geography 2020 & 2033
- Table 15: MEA Refining Catalysts Industry Revenue billion Forecast, by Country 2020 & 2033
- Table 16: MEA Refining Catalysts Industry Volume K Tons Forecast, by Country 2020 & 2033
- Table 17: MEA Refining Catalysts Industry Revenue billion Forecast, by Ingredient 2020 & 2033
- Table 18: MEA Refining Catalysts Industry Volume K Tons Forecast, by Ingredient 2020 & 2033
- Table 19: MEA Refining Catalysts Industry Revenue billion Forecast, by Type 2020 & 2033
- Table 20: MEA Refining Catalysts Industry Volume K Tons Forecast, by Type 2020 & 2033
- Table 21: MEA Refining Catalysts Industry Revenue billion Forecast, by Geography 2020 & 2033
- Table 22: MEA Refining Catalysts Industry Volume K Tons Forecast, by Geography 2020 & 2033
- Table 23: MEA Refining Catalysts Industry Revenue billion Forecast, by Country 2020 & 2033
- Table 24: MEA Refining Catalysts Industry Volume K Tons Forecast, by Country 2020 & 2033
- Table 25: MEA Refining Catalysts Industry Revenue billion Forecast, by Ingredient 2020 & 2033
- Table 26: MEA Refining Catalysts Industry Volume K Tons Forecast, by Ingredient 2020 & 2033
- Table 27: MEA Refining Catalysts Industry Revenue billion Forecast, by Type 2020 & 2033
- Table 28: MEA Refining Catalysts Industry Volume K Tons Forecast, by Type 2020 & 2033
- Table 29: MEA Refining Catalysts Industry Revenue billion Forecast, by Geography 2020 & 2033
- Table 30: MEA Refining Catalysts Industry Volume K Tons Forecast, by Geography 2020 & 2033
- Table 31: MEA Refining Catalysts Industry Revenue billion Forecast, by Country 2020 & 2033
- Table 32: MEA Refining Catalysts Industry Volume K Tons Forecast, by Country 2020 & 2033
- Table 33: MEA Refining Catalysts Industry Revenue billion Forecast, by Ingredient 2020 & 2033
- Table 34: MEA Refining Catalysts Industry Volume K Tons Forecast, by Ingredient 2020 & 2033
- Table 35: MEA Refining Catalysts Industry Revenue billion Forecast, by Type 2020 & 2033
- Table 36: MEA Refining Catalysts Industry Volume K Tons Forecast, by Type 2020 & 2033
- Table 37: MEA Refining Catalysts Industry Revenue billion Forecast, by Geography 2020 & 2033
- Table 38: MEA Refining Catalysts Industry Volume K Tons Forecast, by Geography 2020 & 2033
- Table 39: MEA Refining Catalysts Industry Revenue billion Forecast, by Country 2020 & 2033
- Table 40: MEA Refining Catalysts Industry Volume K Tons Forecast, by Country 2020 & 2033
- Table 41: MEA Refining Catalysts Industry Revenue billion Forecast, by Ingredient 2020 & 2033
- Table 42: MEA Refining Catalysts Industry Volume K Tons Forecast, by Ingredient 2020 & 2033
- Table 43: MEA Refining Catalysts Industry Revenue billion Forecast, by Type 2020 & 2033
- Table 44: MEA Refining Catalysts Industry Volume K Tons Forecast, by Type 2020 & 2033
- Table 45: MEA Refining Catalysts Industry Revenue billion Forecast, by Geography 2020 & 2033
- Table 46: MEA Refining Catalysts Industry Volume K Tons Forecast, by Geography 2020 & 2033
- Table 47: MEA Refining Catalysts Industry Revenue billion Forecast, by Country 2020 & 2033
- Table 48: MEA Refining Catalysts Industry Volume K Tons Forecast, by Country 2020 & 2033
- Table 49: MEA Refining Catalysts Industry Revenue billion Forecast, by Ingredient 2020 & 2033
- Table 50: MEA Refining Catalysts Industry Volume K Tons Forecast, by Ingredient 2020 & 2033
- Table 51: MEA Refining Catalysts Industry Revenue billion Forecast, by Type 2020 & 2033
- Table 52: MEA Refining Catalysts Industry Volume K Tons Forecast, by Type 2020 & 2033
- Table 53: MEA Refining Catalysts Industry Revenue billion Forecast, by Geography 2020 & 2033
- Table 54: MEA Refining Catalysts Industry Volume K Tons Forecast, by Geography 2020 & 2033
- Table 55: MEA Refining Catalysts Industry Revenue billion Forecast, by Country 2020 & 2033
- Table 56: MEA Refining Catalysts Industry Volume K Tons Forecast, by Country 2020 & 2033
Frequently Asked Questions
1. What is the projected Compound Annual Growth Rate (CAGR) of the MEA Refining Catalysts Industry?
The projected CAGR is approximately 5.85%.
2. Which companies are prominent players in the MEA Refining Catalysts Industry?
Key companies in the market include Haldor Topsoe A/S, Axens, Honeywell International Inc, Clariant, Exxon Mobil Corporation, Evonik Industries AG, W R Grace & Co -Conn, BASF SE, Chevron Corporation, DuPont, Saudi Arabian Oil Co, JGC C & C, Johnson Matthey, Albemarle Corporation.
3. What are the main segments of the MEA Refining Catalysts Industry?
The market segments include Ingredient, Type, Geography.
4. Can you provide details about the market size?
The market size is estimated to be USD 1.2 billion as of 2022.
5. What are some drivers contributing to market growth?
; Accelerating Demand For Higher Octane Fuels; Increasing Investments in Refineries.
6. What are the notable trends driving market growth?
Fluid Catalytic Cracking (FCC) Catalysts to Dominate the Market.
7. Are there any restraints impacting market growth?
; Volatility in Precious Metal Prices.
8. Can you provide examples of recent developments in the market?
N/A
9. What pricing options are available for accessing the report?
Pricing options include single-user, multi-user, and enterprise licenses priced at USD 3,950, USD 4,950, and USD 6,950 respectively.
10. Is the market size provided in terms of value or volume?
The market size is provided in terms of value, measured in billion and volume, measured in K Tons.
11. Are there any specific market keywords associated with the report?
Yes, the market keyword associated with the report is "MEA Refining Catalysts Industry," which aids in identifying and referencing the specific market segment covered.
12. How do I determine which pricing option suits my needs best?
The pricing options vary based on user requirements and access needs. Individual users may opt for single-user licenses, while businesses requiring broader access may choose multi-user or enterprise licenses for cost-effective access to the report.
13. Are there any additional resources or data provided in the MEA Refining Catalysts Industry report?
While the report offers comprehensive insights, it's advisable to review the specific contents or supplementary materials provided to ascertain if additional resources or data are available.
14. How can I stay updated on further developments or reports in the MEA Refining Catalysts Industry?
To stay informed about further developments, trends, and reports in the MEA Refining Catalysts Industry, consider subscribing to industry newsletters, following relevant companies and organizations, or regularly checking reputable industry news sources and publications.
Methodology
Step 1 - Identification of Relevant Samples Size from Population Database


Step 2 - Approaches for Defining Global Market Size (Value, Volume* & Price*)

Note*: In applicable scenarios
Step 3 - Data Sources
Primary Research
- Web Analytics
- Survey Reports
- Research Institute
- Latest Research Reports
- Opinion Leaders
Secondary Research
- Annual Reports
- White Paper
- Latest Press Release
- Industry Association
- Paid Database
- Investor Presentations

Step 4 - Data Triangulation
Involves using different sources of information in order to increase the validity of a study
These sources are likely to be stakeholders in a program - participants, other researchers, program staff, other community members, and so on.
Then we put all data in single framework & apply various statistical tools to find out the dynamic on the market.
During the analysis stage, feedback from the stakeholder groups would be compared to determine areas of agreement as well as areas of divergence