

Key Insights
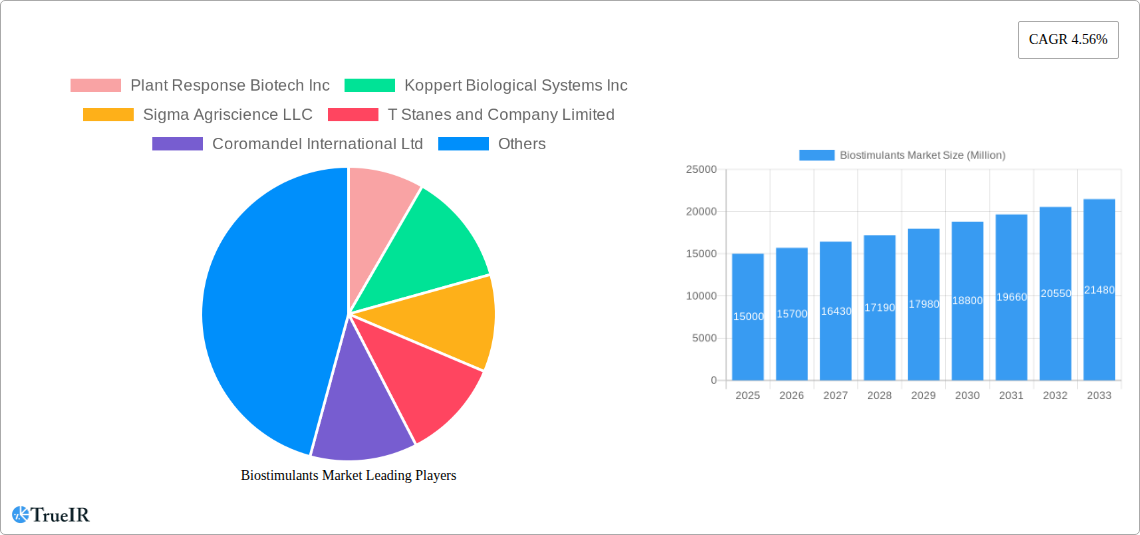
The global biostimulants market is experiencing robust growth, driven by the increasing demand for sustainable and environmentally friendly agricultural practices. With a Compound Annual Growth Rate (CAGR) of 4.56% from 2019 to 2024, the market is projected to continue this expansion, reaching a significant market size in the coming years. Several factors contribute to this positive outlook. The growing global population necessitates increased food production, leading farmers to adopt technologies that enhance crop yields and quality. Biostimulants, offering a natural and effective solution to improve nutrient uptake, stress tolerance, and overall plant health, are becoming increasingly important in this context. Furthermore, stringent regulations regarding the use of synthetic chemicals in agriculture are driving the adoption of bio-based alternatives like biostimulants. The market is segmented by form (amino acids, fulvic acid, humic acid, protein hydrolysates, seaweed extracts, and others), crop type (cash crops, horticultural crops, and row crops), and geographic region. Amino acids and seaweed extracts are currently leading segments, reflecting their proven efficacy and versatility across various crops. North America and Europe currently hold significant market shares, but the Asia-Pacific region is projected to witness substantial growth due to increasing agricultural activities and rising awareness of sustainable farming practices. Key players in the market are continuously investing in research and development to introduce innovative products and expand their market presence, further fueling market expansion.
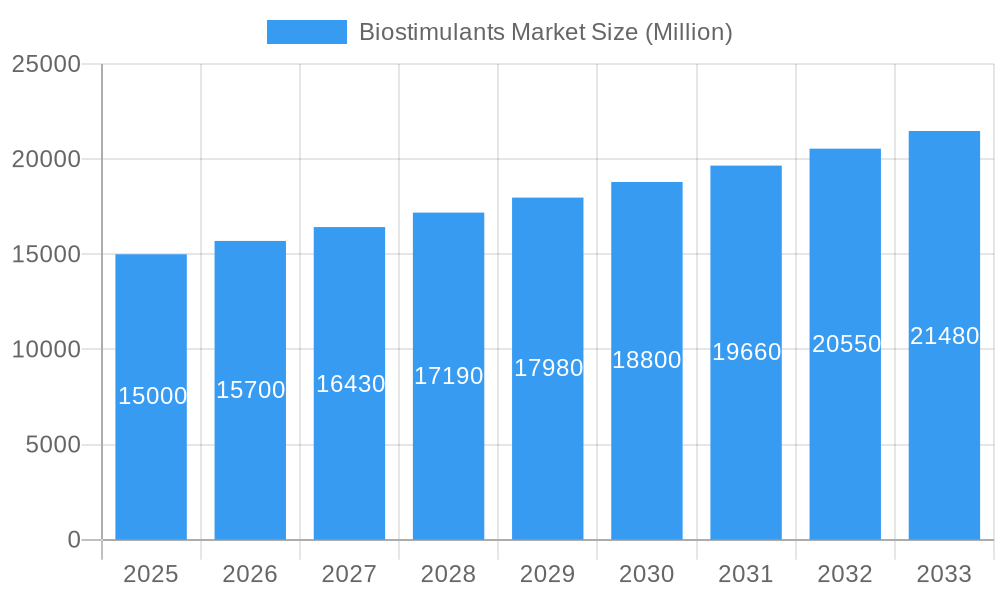
Biostimulants Market Market Size (In Billion)
The market's growth is influenced by several trends. The increasing adoption of precision agriculture techniques allows for targeted application of biostimulants, maximizing their effectiveness and minimizing environmental impact. Growing consumer preference for organically produced food is creating a strong demand for biostimulants, which are often used in organic farming practices. However, challenges remain. High initial investment costs for biostimulant application and a lack of awareness among farmers in certain regions could potentially restrain market growth. Despite these challenges, the long-term outlook for the biostimulants market remains highly positive, fueled by ongoing technological advancements, supportive government policies promoting sustainable agriculture, and the ever-increasing need for efficient and eco-friendly agricultural solutions. The market is expected to see considerable expansion across all major segments and regions throughout the forecast period (2025-2033). Competitive intensity is expected to increase as companies strive for market share, prompting further innovation and product diversification.
Biostimulants Market Company Market Share
Biostimulants Market: A Comprehensive Report (2019-2033)
This dynamic report provides a comprehensive analysis of the Biostimulants Market, offering invaluable insights for stakeholders across the agricultural value chain. Leveraging a robust methodology and incorporating the latest market trends, this report projects a market valued at xx Million by 2025, exhibiting a healthy CAGR of xx% during the forecast period (2025-2033). The study period covers 2019-2033, with 2025 serving as the base and estimated year. The historical period analyzed is 2019-2024.
Biostimulants Market Structure & Competitive Landscape
The Biostimulants market is characterized by a moderately concentrated structure, with key players such as Plant Response Biotech Inc, Koppert Biological Systems Inc, Sigma Agriscience LLC, and others vying for market share. The market concentration ratio (CR4) is estimated at xx%, indicating the presence of both large multinational corporations and smaller specialized firms. Innovation, particularly in the development of sustainable and effective biostimulant formulations, is a key driver of competition. Regulatory landscapes vary across geographies, impacting product approvals and market access. The market faces pressure from substitute products, including traditional chemical fertilizers, although the increasing awareness of sustainability and environmental concerns favors biostimulants. End-user segmentation includes cash crops, horticultural crops, and row crops, each with distinct needs and preferences. M&A activity has been significant, with several notable transactions, including the acquisition of Plant Response Inc. by The Mosaic Company in February 2022, signifying a consolidation trend in the industry. The overall volume of M&A deals within the past five years is estimated at xx transactions. This activity reflects the strategic importance of biostimulants within the broader agricultural input sector.
Biostimulants Market Trends & Opportunities
The Biostimulants market is experiencing robust growth, driven by several factors. Increasing global food demand, coupled with the need for sustainable agricultural practices, fuels the adoption of biostimulants as an environmentally friendly alternative to traditional fertilizers. Technological advancements in formulation and application methods are further enhancing the efficacy and market appeal of these products. Consumer preference for naturally grown produce is also influencing market dynamics. Furthermore, favorable government policies and initiatives promoting sustainable agriculture are creating lucrative opportunities for market expansion. The market penetration rate for biostimulants is currently estimated at xx%, with significant potential for future growth, particularly in emerging economies with large agricultural sectors. The CAGR for the market from 2025-2033 is projected at xx%. This growth is further fueled by an expanding awareness among farmers about the benefits of biostimulants in enhancing crop yields and quality, alongside a global push toward sustainable agricultural practices. Competitive dynamics are shaped by innovation, pricing strategies, and strategic partnerships, leading to a dynamic and evolving market landscape.
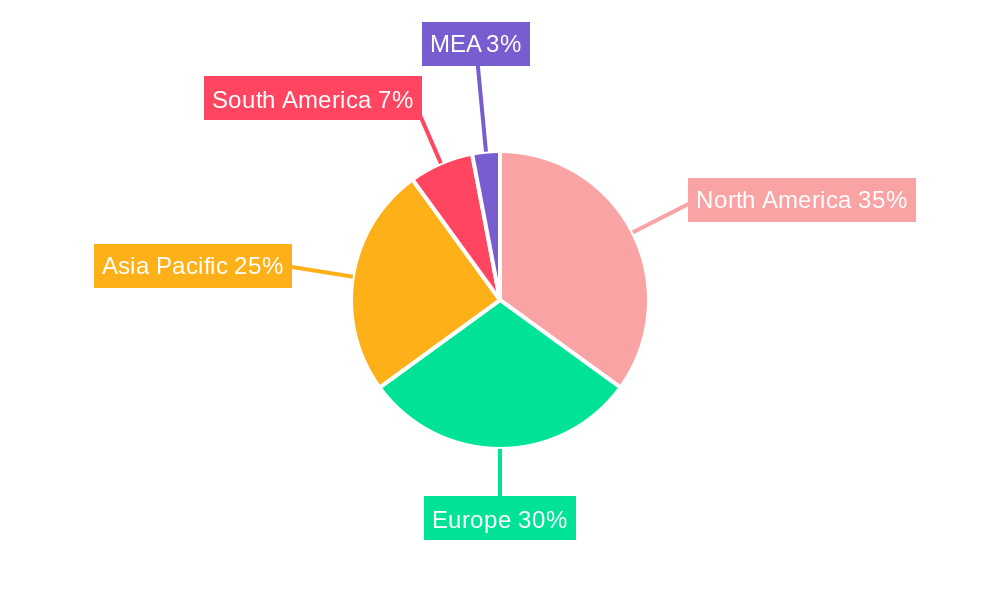
Dominant Markets & Segments in Biostimulants Market
While the global market exhibits strong growth across all regions, North America and Europe currently hold the largest market share due to established agricultural infrastructure, stringent environmental regulations, and early adoption of sustainable farming practices. Within segment analysis:
Form: Seaweed extracts and amino acids currently dominate the market, driven by their proven efficacy and established market presence. However, other biostimulant forms, such as protein hydrolysates and humic acids, are gaining traction due to technological advances and growing awareness of their benefits.
Crop Type: High-value cash crops, such as fruits and vegetables, currently represent a significant portion of market demand due to higher profit margins and increased willingness to adopt premium inputs. However, row crops are experiencing rising adoption rates driven by growing demand for sustainable solutions within the broader agricultural sector.
Key Growth Drivers:
- Favorable government policies: Many governments globally are increasingly providing incentives and support to promote the adoption of sustainable agricultural practices, including biostimulants.
- Technological advancements: Continuous innovations in biostimulant formulation and application technologies lead to enhanced efficacy and increased market acceptance.
- Growing consumer awareness: Increased awareness among consumers about sustainable food production and the environmental impact of conventional farming practices fuels higher demand for organically grown crops, for which biostimulants are an integral part.
Biostimulants Market Product Analysis
Biostimulant product innovation focuses on developing highly effective and targeted formulations addressing specific crop needs and environmental conditions. This includes utilizing advanced technologies like nanotechnology and precision application methods. Competitive advantages stem from superior product efficacy, cost-effectiveness, and sustainable production processes. The market is witnessing a shift toward more specialized and customized biostimulant solutions designed to address the specific requirements of diverse crops and farming systems. This trend reflects the ongoing efforts to maximize crop yield and quality while minimizing environmental impacts.
Key Drivers, Barriers & Challenges in Biostimulants Market
Key Drivers:
The Biostimulants market is propelled by factors like the rising demand for sustainable agricultural practices, increasing consumer preference for organic produce, technological advancements in biostimulant formulations, and favorable government policies promoting sustainable farming. Growing awareness among farmers of the economic benefits of increased crop yields and improved quality further accelerate market growth.
Challenges and Restraints:
The market faces challenges such as stringent regulatory frameworks and complex approval processes in various regions. Supply chain disruptions, particularly regarding raw materials sourcing, pose another major constraint. Furthermore, intense competition from established players and the need for effective marketing and consumer education represent significant hurdles. Price volatility and cost-effectiveness compared to conventional fertilizers remain another key concern, potentially hindering widespread adoption. The lack of standardization in product quality and labeling represents another key challenge.
Growth Drivers in the Biostimulants Market
The increasing demand for sustainable agriculture, coupled with technological advancements in biostimulant formulation and application, are key growth drivers. Government initiatives supporting sustainable farming practices further stimulate market expansion. The rising consumer preference for organically produced food is an important factor. Furthermore, the need for enhanced crop yields and quality in a changing climate fuels the growing adoption of biostimulants.
Challenges Impacting Biostimulants Market Growth
Regulatory hurdles in different geographies, including lengthy and complex approval processes, pose a significant barrier. Supply chain disruptions can impact raw material availability and product costs. Competition from established chemical fertilizer manufacturers and the need for effective marketing and consumer education represent additional challenges. Fluctuating raw material prices and the price premium associated with biostimulants compared to traditional products can limit market penetration.
Key Players Shaping the Biostimulants Market
- Plant Response Biotech Inc
- Koppert Biological Systems Inc
- Sigma Agriscience LLC
- T Stanes and Company Limited
- Coromandel International Ltd
- Haifa Group
- UPL
- Bionema
- Agriculture Solutions Inc
- Agrinos
- Trade Corporation International
- Atlántica Agrícola
- Vittia Grou
- Biolchim SpA
- Valagro
Significant Biostimulants Market Industry Milestones
- May 2021: Plant Response Inc. acquired WISErg, a startup focused on upcycling food waste into nutrient-efficient products, enhancing its product portfolio and sustainability profile.
- September 2021: Tradecorp launched Biimore, a biostimulant derived from plant fermentation, expanding the range of available biostimulant options with a unique combination of natural compounds.
- February 2022: Plant Response Inc. was acquired by The Mosaic Company, a global fertilizer manufacturer, strengthening its global reach and resources for innovation and sustainable solutions.
Future Outlook for Biostimulants Market
The Biostimulants market is poised for significant growth, driven by ongoing technological advancements, supportive government policies, and rising consumer demand for sustainable agricultural practices. Strategic partnerships, product diversification, and expansion into new markets will play a key role in shaping future market dynamics. The market exhibits significant potential for continued expansion, especially in emerging economies with large agricultural sectors. Growing awareness of the benefits of biostimulants in improving crop yields, quality, and resilience to climate change further enhances the market outlook.
Biostimulants Market Segmentation
- 1. Production Analysis
- 2. Consumption Analysis
- 3. Import Market Analysis (Value & Volume)
- 4. Export Market Analysis (Value & Volume)
- 5. Price Trend Analysis
Biostimulants Market Segmentation By Geography
-
1. North America
- 1.1. United States
- 1.2. Canada
- 1.3. Mexico
-
2. South America
- 2.1. Brazil
- 2.2. Argentina
- 2.3. Rest of South America
-
3. Europe
- 3.1. United Kingdom
- 3.2. Germany
- 3.3. France
- 3.4. Italy
- 3.5. Spain
- 3.6. Russia
- 3.7. Benelux
- 3.8. Nordics
- 3.9. Rest of Europe
-
4. Middle East & Africa
- 4.1. Turkey
- 4.2. Israel
- 4.3. GCC
- 4.4. North Africa
- 4.5. South Africa
- 4.6. Rest of Middle East & Africa
-
5. Asia Pacific
- 5.1. China
- 5.2. India
- 5.3. Japan
- 5.4. South Korea
- 5.5. ASEAN
- 5.6. Oceania
- 5.7. Rest of Asia Pacific
Biostimulants Market Regional Market Share
Geographic Coverage of Biostimulants Market
Biostimulants Market REPORT HIGHLIGHTS
| Aspects | Details |
|---|---|
| Study Period | 2020-2034 |
| Base Year | 2025 |
| Estimated Year | 2026 |
| Forecast Period | 2026-2034 |
| Historical Period | 2020-2025 |
| Growth Rate | CAGR of 4.56% from 2020-2034 |
| Segmentation |
|
Table of Contents
- 1. Introduction
- 1.1. Research Scope
- 1.2. Market Segmentation
- 1.3. Research Methodology
- 1.4. Definitions and Assumptions
- 2. Executive Summary
- 2.1. Introduction
- 3. Market Dynamics
- 3.1. Introduction
- 3.2. Market Drivers
- 3.2.1. Seed Treatment As A Solution To Enhance Yield; Growing Awareness For Seed Treatment Among The Farmers; Rising Trend Of Organic Farming
- 3.3. Market Restrains
- 3.3.1. Limitations Across Farm-Level Seed Treatment; Rising Environmental Concerns
- 3.4. Market Trends
- 3.4.1. Amino Acids is the largest Form
- 4. Market Factor Analysis
- 4.1. Porters Five Forces
- 4.2. Supply/Value Chain
- 4.3. PESTEL analysis
- 4.4. Market Entropy
- 4.5. Patent/Trademark Analysis
- 5. Global Biostimulants Market Analysis, Insights and Forecast, 2020-2032
- 5.1. Market Analysis, Insights and Forecast - by Production Analysis
- 5.2. Market Analysis, Insights and Forecast - by Consumption Analysis
- 5.3. Market Analysis, Insights and Forecast - by Import Market Analysis (Value & Volume)
- 5.4. Market Analysis, Insights and Forecast - by Export Market Analysis (Value & Volume)
- 5.5. Market Analysis, Insights and Forecast - by Price Trend Analysis
- 5.6. Market Analysis, Insights and Forecast - by Region
- 5.6.1. North America
- 5.6.2. South America
- 5.6.3. Europe
- 5.6.4. Middle East & Africa
- 5.6.5. Asia Pacific
- 5.1. Market Analysis, Insights and Forecast - by Production Analysis
- 6. North America Biostimulants Market Analysis, Insights and Forecast, 2020-2032
- 6.1. Market Analysis, Insights and Forecast - by Production Analysis
- 6.2. Market Analysis, Insights and Forecast - by Consumption Analysis
- 6.3. Market Analysis, Insights and Forecast - by Import Market Analysis (Value & Volume)
- 6.4. Market Analysis, Insights and Forecast - by Export Market Analysis (Value & Volume)
- 6.5. Market Analysis, Insights and Forecast - by Price Trend Analysis
- 6.1. Market Analysis, Insights and Forecast - by Production Analysis
- 7. South America Biostimulants Market Analysis, Insights and Forecast, 2020-2032
- 7.1. Market Analysis, Insights and Forecast - by Production Analysis
- 7.2. Market Analysis, Insights and Forecast - by Consumption Analysis
- 7.3. Market Analysis, Insights and Forecast - by Import Market Analysis (Value & Volume)
- 7.4. Market Analysis, Insights and Forecast - by Export Market Analysis (Value & Volume)
- 7.5. Market Analysis, Insights and Forecast - by Price Trend Analysis
- 7.1. Market Analysis, Insights and Forecast - by Production Analysis
- 8. Europe Biostimulants Market Analysis, Insights and Forecast, 2020-2032
- 8.1. Market Analysis, Insights and Forecast - by Production Analysis
- 8.2. Market Analysis, Insights and Forecast - by Consumption Analysis
- 8.3. Market Analysis, Insights and Forecast - by Import Market Analysis (Value & Volume)
- 8.4. Market Analysis, Insights and Forecast - by Export Market Analysis (Value & Volume)
- 8.5. Market Analysis, Insights and Forecast - by Price Trend Analysis
- 8.1. Market Analysis, Insights and Forecast - by Production Analysis
- 9. Middle East & Africa Biostimulants Market Analysis, Insights and Forecast, 2020-2032
- 9.1. Market Analysis, Insights and Forecast - by Production Analysis
- 9.2. Market Analysis, Insights and Forecast - by Consumption Analysis
- 9.3. Market Analysis, Insights and Forecast - by Import Market Analysis (Value & Volume)
- 9.4. Market Analysis, Insights and Forecast - by Export Market Analysis (Value & Volume)
- 9.5. Market Analysis, Insights and Forecast - by Price Trend Analysis
- 9.1. Market Analysis, Insights and Forecast - by Production Analysis
- 10. Asia Pacific Biostimulants Market Analysis, Insights and Forecast, 2020-2032
- 10.1. Market Analysis, Insights and Forecast - by Production Analysis
- 10.2. Market Analysis, Insights and Forecast - by Consumption Analysis
- 10.3. Market Analysis, Insights and Forecast - by Import Market Analysis (Value & Volume)
- 10.4. Market Analysis, Insights and Forecast - by Export Market Analysis (Value & Volume)
- 10.5. Market Analysis, Insights and Forecast - by Price Trend Analysis
- 10.1. Market Analysis, Insights and Forecast - by Production Analysis
- 11. Competitive Analysis
- 11.1. Global Market Share Analysis 2025
- 11.2. Company Profiles
- 11.2.1 Plant Response Biotech Inc
- 11.2.1.1. Overview
- 11.2.1.2. Products
- 11.2.1.3. SWOT Analysis
- 11.2.1.4. Recent Developments
- 11.2.1.5. Financials (Based on Availability)
- 11.2.2 Koppert Biological Systems Inc
- 11.2.2.1. Overview
- 11.2.2.2. Products
- 11.2.2.3. SWOT Analysis
- 11.2.2.4. Recent Developments
- 11.2.2.5. Financials (Based on Availability)
- 11.2.3 Sigma Agriscience LLC
- 11.2.3.1. Overview
- 11.2.3.2. Products
- 11.2.3.3. SWOT Analysis
- 11.2.3.4. Recent Developments
- 11.2.3.5. Financials (Based on Availability)
- 11.2.4 T Stanes and Company Limited
- 11.2.4.1. Overview
- 11.2.4.2. Products
- 11.2.4.3. SWOT Analysis
- 11.2.4.4. Recent Developments
- 11.2.4.5. Financials (Based on Availability)
- 11.2.5 Coromandel International Ltd
- 11.2.5.1. Overview
- 11.2.5.2. Products
- 11.2.5.3. SWOT Analysis
- 11.2.5.4. Recent Developments
- 11.2.5.5. Financials (Based on Availability)
- 11.2.6 Haifa Group
- 11.2.6.1. Overview
- 11.2.6.2. Products
- 11.2.6.3. SWOT Analysis
- 11.2.6.4. Recent Developments
- 11.2.6.5. Financials (Based on Availability)
- 11.2.7 UPL
- 11.2.7.1. Overview
- 11.2.7.2. Products
- 11.2.7.3. SWOT Analysis
- 11.2.7.4. Recent Developments
- 11.2.7.5. Financials (Based on Availability)
- 11.2.8 Bionema
- 11.2.8.1. Overview
- 11.2.8.2. Products
- 11.2.8.3. SWOT Analysis
- 11.2.8.4. Recent Developments
- 11.2.8.5. Financials (Based on Availability)
- 11.2.9 Agriculture Solutions Inc
- 11.2.9.1. Overview
- 11.2.9.2. Products
- 11.2.9.3. SWOT Analysis
- 11.2.9.4. Recent Developments
- 11.2.9.5. Financials (Based on Availability)
- 11.2.10 Agrinos
- 11.2.10.1. Overview
- 11.2.10.2. Products
- 11.2.10.3. SWOT Analysis
- 11.2.10.4. Recent Developments
- 11.2.10.5. Financials (Based on Availability)
- 11.2.11 Trade Corporation International
- 11.2.11.1. Overview
- 11.2.11.2. Products
- 11.2.11.3. SWOT Analysis
- 11.2.11.4. Recent Developments
- 11.2.11.5. Financials (Based on Availability)
- 11.2.12 Atlántica Agrícola
- 11.2.12.1. Overview
- 11.2.12.2. Products
- 11.2.12.3. SWOT Analysis
- 11.2.12.4. Recent Developments
- 11.2.12.5. Financials (Based on Availability)
- 11.2.13 Vittia Grou
- 11.2.13.1. Overview
- 11.2.13.2. Products
- 11.2.13.3. SWOT Analysis
- 11.2.13.4. Recent Developments
- 11.2.13.5. Financials (Based on Availability)
- 11.2.14 Biolchim SpA
- 11.2.14.1. Overview
- 11.2.14.2. Products
- 11.2.14.3. SWOT Analysis
- 11.2.14.4. Recent Developments
- 11.2.14.5. Financials (Based on Availability)
- 11.2.15 Valagro
- 11.2.15.1. Overview
- 11.2.15.2. Products
- 11.2.15.3. SWOT Analysis
- 11.2.15.4. Recent Developments
- 11.2.15.5. Financials (Based on Availability)
- 11.2.1 Plant Response Biotech Inc
List of Figures
- Figure 1: Global Biostimulants Market Revenue Breakdown (Million, %) by Region 2025 & 2033
- Figure 2: North America Biostimulants Market Revenue (Million), by Production Analysis 2025 & 2033
- Figure 3: North America Biostimulants Market Revenue Share (%), by Production Analysis 2025 & 2033
- Figure 4: North America Biostimulants Market Revenue (Million), by Consumption Analysis 2025 & 2033
- Figure 5: North America Biostimulants Market Revenue Share (%), by Consumption Analysis 2025 & 2033
- Figure 6: North America Biostimulants Market Revenue (Million), by Import Market Analysis (Value & Volume) 2025 & 2033
- Figure 7: North America Biostimulants Market Revenue Share (%), by Import Market Analysis (Value & Volume) 2025 & 2033
- Figure 8: North America Biostimulants Market Revenue (Million), by Export Market Analysis (Value & Volume) 2025 & 2033
- Figure 9: North America Biostimulants Market Revenue Share (%), by Export Market Analysis (Value & Volume) 2025 & 2033
- Figure 10: North America Biostimulants Market Revenue (Million), by Price Trend Analysis 2025 & 2033
- Figure 11: North America Biostimulants Market Revenue Share (%), by Price Trend Analysis 2025 & 2033
- Figure 12: North America Biostimulants Market Revenue (Million), by Country 2025 & 2033
- Figure 13: North America Biostimulants Market Revenue Share (%), by Country 2025 & 2033
- Figure 14: South America Biostimulants Market Revenue (Million), by Production Analysis 2025 & 2033
- Figure 15: South America Biostimulants Market Revenue Share (%), by Production Analysis 2025 & 2033
- Figure 16: South America Biostimulants Market Revenue (Million), by Consumption Analysis 2025 & 2033
- Figure 17: South America Biostimulants Market Revenue Share (%), by Consumption Analysis 2025 & 2033
- Figure 18: South America Biostimulants Market Revenue (Million), by Import Market Analysis (Value & Volume) 2025 & 2033
- Figure 19: South America Biostimulants Market Revenue Share (%), by Import Market Analysis (Value & Volume) 2025 & 2033
- Figure 20: South America Biostimulants Market Revenue (Million), by Export Market Analysis (Value & Volume) 2025 & 2033
- Figure 21: South America Biostimulants Market Revenue Share (%), by Export Market Analysis (Value & Volume) 2025 & 2033
- Figure 22: South America Biostimulants Market Revenue (Million), by Price Trend Analysis 2025 & 2033
- Figure 23: South America Biostimulants Market Revenue Share (%), by Price Trend Analysis 2025 & 2033
- Figure 24: South America Biostimulants Market Revenue (Million), by Country 2025 & 2033
- Figure 25: South America Biostimulants Market Revenue Share (%), by Country 2025 & 2033
- Figure 26: Europe Biostimulants Market Revenue (Million), by Production Analysis 2025 & 2033
- Figure 27: Europe Biostimulants Market Revenue Share (%), by Production Analysis 2025 & 2033
- Figure 28: Europe Biostimulants Market Revenue (Million), by Consumption Analysis 2025 & 2033
- Figure 29: Europe Biostimulants Market Revenue Share (%), by Consumption Analysis 2025 & 2033
- Figure 30: Europe Biostimulants Market Revenue (Million), by Import Market Analysis (Value & Volume) 2025 & 2033
- Figure 31: Europe Biostimulants Market Revenue Share (%), by Import Market Analysis (Value & Volume) 2025 & 2033
- Figure 32: Europe Biostimulants Market Revenue (Million), by Export Market Analysis (Value & Volume) 2025 & 2033
- Figure 33: Europe Biostimulants Market Revenue Share (%), by Export Market Analysis (Value & Volume) 2025 & 2033
- Figure 34: Europe Biostimulants Market Revenue (Million), by Price Trend Analysis 2025 & 2033
- Figure 35: Europe Biostimulants Market Revenue Share (%), by Price Trend Analysis 2025 & 2033
- Figure 36: Europe Biostimulants Market Revenue (Million), by Country 2025 & 2033
- Figure 37: Europe Biostimulants Market Revenue Share (%), by Country 2025 & 2033
- Figure 38: Middle East & Africa Biostimulants Market Revenue (Million), by Production Analysis 2025 & 2033
- Figure 39: Middle East & Africa Biostimulants Market Revenue Share (%), by Production Analysis 2025 & 2033
- Figure 40: Middle East & Africa Biostimulants Market Revenue (Million), by Consumption Analysis 2025 & 2033
- Figure 41: Middle East & Africa Biostimulants Market Revenue Share (%), by Consumption Analysis 2025 & 2033
- Figure 42: Middle East & Africa Biostimulants Market Revenue (Million), by Import Market Analysis (Value & Volume) 2025 & 2033
- Figure 43: Middle East & Africa Biostimulants Market Revenue Share (%), by Import Market Analysis (Value & Volume) 2025 & 2033
- Figure 44: Middle East & Africa Biostimulants Market Revenue (Million), by Export Market Analysis (Value & Volume) 2025 & 2033
- Figure 45: Middle East & Africa Biostimulants Market Revenue Share (%), by Export Market Analysis (Value & Volume) 2025 & 2033
- Figure 46: Middle East & Africa Biostimulants Market Revenue (Million), by Price Trend Analysis 2025 & 2033
- Figure 47: Middle East & Africa Biostimulants Market Revenue Share (%), by Price Trend Analysis 2025 & 2033
- Figure 48: Middle East & Africa Biostimulants Market Revenue (Million), by Country 2025 & 2033
- Figure 49: Middle East & Africa Biostimulants Market Revenue Share (%), by Country 2025 & 2033
- Figure 50: Asia Pacific Biostimulants Market Revenue (Million), by Production Analysis 2025 & 2033
- Figure 51: Asia Pacific Biostimulants Market Revenue Share (%), by Production Analysis 2025 & 2033
- Figure 52: Asia Pacific Biostimulants Market Revenue (Million), by Consumption Analysis 2025 & 2033
- Figure 53: Asia Pacific Biostimulants Market Revenue Share (%), by Consumption Analysis 2025 & 2033
- Figure 54: Asia Pacific Biostimulants Market Revenue (Million), by Import Market Analysis (Value & Volume) 2025 & 2033
- Figure 55: Asia Pacific Biostimulants Market Revenue Share (%), by Import Market Analysis (Value & Volume) 2025 & 2033
- Figure 56: Asia Pacific Biostimulants Market Revenue (Million), by Export Market Analysis (Value & Volume) 2025 & 2033
- Figure 57: Asia Pacific Biostimulants Market Revenue Share (%), by Export Market Analysis (Value & Volume) 2025 & 2033
- Figure 58: Asia Pacific Biostimulants Market Revenue (Million), by Price Trend Analysis 2025 & 2033
- Figure 59: Asia Pacific Biostimulants Market Revenue Share (%), by Price Trend Analysis 2025 & 2033
- Figure 60: Asia Pacific Biostimulants Market Revenue (Million), by Country 2025 & 2033
- Figure 61: Asia Pacific Biostimulants Market Revenue Share (%), by Country 2025 & 2033
List of Tables
- Table 1: Global Biostimulants Market Revenue Million Forecast, by Production Analysis 2020 & 2033
- Table 2: Global Biostimulants Market Revenue Million Forecast, by Consumption Analysis 2020 & 2033
- Table 3: Global Biostimulants Market Revenue Million Forecast, by Import Market Analysis (Value & Volume) 2020 & 2033
- Table 4: Global Biostimulants Market Revenue Million Forecast, by Export Market Analysis (Value & Volume) 2020 & 2033
- Table 5: Global Biostimulants Market Revenue Million Forecast, by Price Trend Analysis 2020 & 2033
- Table 6: Global Biostimulants Market Revenue Million Forecast, by Region 2020 & 2033
- Table 7: Global Biostimulants Market Revenue Million Forecast, by Production Analysis 2020 & 2033
- Table 8: Global Biostimulants Market Revenue Million Forecast, by Consumption Analysis 2020 & 2033
- Table 9: Global Biostimulants Market Revenue Million Forecast, by Import Market Analysis (Value & Volume) 2020 & 2033
- Table 10: Global Biostimulants Market Revenue Million Forecast, by Export Market Analysis (Value & Volume) 2020 & 2033
- Table 11: Global Biostimulants Market Revenue Million Forecast, by Price Trend Analysis 2020 & 2033
- Table 12: Global Biostimulants Market Revenue Million Forecast, by Country 2020 & 2033
- Table 13: United States Biostimulants Market Revenue (Million) Forecast, by Application 2020 & 2033
- Table 14: Canada Biostimulants Market Revenue (Million) Forecast, by Application 2020 & 2033
- Table 15: Mexico Biostimulants Market Revenue (Million) Forecast, by Application 2020 & 2033
- Table 16: Global Biostimulants Market Revenue Million Forecast, by Production Analysis 2020 & 2033
- Table 17: Global Biostimulants Market Revenue Million Forecast, by Consumption Analysis 2020 & 2033
- Table 18: Global Biostimulants Market Revenue Million Forecast, by Import Market Analysis (Value & Volume) 2020 & 2033
- Table 19: Global Biostimulants Market Revenue Million Forecast, by Export Market Analysis (Value & Volume) 2020 & 2033
- Table 20: Global Biostimulants Market Revenue Million Forecast, by Price Trend Analysis 2020 & 2033
- Table 21: Global Biostimulants Market Revenue Million Forecast, by Country 2020 & 2033
- Table 22: Brazil Biostimulants Market Revenue (Million) Forecast, by Application 2020 & 2033
- Table 23: Argentina Biostimulants Market Revenue (Million) Forecast, by Application 2020 & 2033
- Table 24: Rest of South America Biostimulants Market Revenue (Million) Forecast, by Application 2020 & 2033
- Table 25: Global Biostimulants Market Revenue Million Forecast, by Production Analysis 2020 & 2033
- Table 26: Global Biostimulants Market Revenue Million Forecast, by Consumption Analysis 2020 & 2033
- Table 27: Global Biostimulants Market Revenue Million Forecast, by Import Market Analysis (Value & Volume) 2020 & 2033
- Table 28: Global Biostimulants Market Revenue Million Forecast, by Export Market Analysis (Value & Volume) 2020 & 2033
- Table 29: Global Biostimulants Market Revenue Million Forecast, by Price Trend Analysis 2020 & 2033
- Table 30: Global Biostimulants Market Revenue Million Forecast, by Country 2020 & 2033
- Table 31: United Kingdom Biostimulants Market Revenue (Million) Forecast, by Application 2020 & 2033
- Table 32: Germany Biostimulants Market Revenue (Million) Forecast, by Application 2020 & 2033
- Table 33: France Biostimulants Market Revenue (Million) Forecast, by Application 2020 & 2033
- Table 34: Italy Biostimulants Market Revenue (Million) Forecast, by Application 2020 & 2033
- Table 35: Spain Biostimulants Market Revenue (Million) Forecast, by Application 2020 & 2033
- Table 36: Russia Biostimulants Market Revenue (Million) Forecast, by Application 2020 & 2033
- Table 37: Benelux Biostimulants Market Revenue (Million) Forecast, by Application 2020 & 2033
- Table 38: Nordics Biostimulants Market Revenue (Million) Forecast, by Application 2020 & 2033
- Table 39: Rest of Europe Biostimulants Market Revenue (Million) Forecast, by Application 2020 & 2033
- Table 40: Global Biostimulants Market Revenue Million Forecast, by Production Analysis 2020 & 2033
- Table 41: Global Biostimulants Market Revenue Million Forecast, by Consumption Analysis 2020 & 2033
- Table 42: Global Biostimulants Market Revenue Million Forecast, by Import Market Analysis (Value & Volume) 2020 & 2033
- Table 43: Global Biostimulants Market Revenue Million Forecast, by Export Market Analysis (Value & Volume) 2020 & 2033
- Table 44: Global Biostimulants Market Revenue Million Forecast, by Price Trend Analysis 2020 & 2033
- Table 45: Global Biostimulants Market Revenue Million Forecast, by Country 2020 & 2033
- Table 46: Turkey Biostimulants Market Revenue (Million) Forecast, by Application 2020 & 2033
- Table 47: Israel Biostimulants Market Revenue (Million) Forecast, by Application 2020 & 2033
- Table 48: GCC Biostimulants Market Revenue (Million) Forecast, by Application 2020 & 2033
- Table 49: North Africa Biostimulants Market Revenue (Million) Forecast, by Application 2020 & 2033
- Table 50: South Africa Biostimulants Market Revenue (Million) Forecast, by Application 2020 & 2033
- Table 51: Rest of Middle East & Africa Biostimulants Market Revenue (Million) Forecast, by Application 2020 & 2033
- Table 52: Global Biostimulants Market Revenue Million Forecast, by Production Analysis 2020 & 2033
- Table 53: Global Biostimulants Market Revenue Million Forecast, by Consumption Analysis 2020 & 2033
- Table 54: Global Biostimulants Market Revenue Million Forecast, by Import Market Analysis (Value & Volume) 2020 & 2033
- Table 55: Global Biostimulants Market Revenue Million Forecast, by Export Market Analysis (Value & Volume) 2020 & 2033
- Table 56: Global Biostimulants Market Revenue Million Forecast, by Price Trend Analysis 2020 & 2033
- Table 57: Global Biostimulants Market Revenue Million Forecast, by Country 2020 & 2033
- Table 58: China Biostimulants Market Revenue (Million) Forecast, by Application 2020 & 2033
- Table 59: India Biostimulants Market Revenue (Million) Forecast, by Application 2020 & 2033
- Table 60: Japan Biostimulants Market Revenue (Million) Forecast, by Application 2020 & 2033
- Table 61: South Korea Biostimulants Market Revenue (Million) Forecast, by Application 2020 & 2033
- Table 62: ASEAN Biostimulants Market Revenue (Million) Forecast, by Application 2020 & 2033
- Table 63: Oceania Biostimulants Market Revenue (Million) Forecast, by Application 2020 & 2033
- Table 64: Rest of Asia Pacific Biostimulants Market Revenue (Million) Forecast, by Application 2020 & 2033
Frequently Asked Questions
1. What is the projected Compound Annual Growth Rate (CAGR) of the Biostimulants Market?
The projected CAGR is approximately 4.56%.
2. Which companies are prominent players in the Biostimulants Market?
Key companies in the market include Plant Response Biotech Inc, Koppert Biological Systems Inc, Sigma Agriscience LLC, T Stanes and Company Limited, Coromandel International Ltd, Haifa Group, UPL, Bionema, Agriculture Solutions Inc, Agrinos, Trade Corporation International, Atlántica Agrícola, Vittia Grou, Biolchim SpA, Valagro.
3. What are the main segments of the Biostimulants Market?
The market segments include Production Analysis, Consumption Analysis, Import Market Analysis (Value & Volume), Export Market Analysis (Value & Volume), Price Trend Analysis.
4. Can you provide details about the market size?
The market size is estimated to be USD XX Million as of 2022.
5. What are some drivers contributing to market growth?
Seed Treatment As A Solution To Enhance Yield; Growing Awareness For Seed Treatment Among The Farmers; Rising Trend Of Organic Farming.
6. What are the notable trends driving market growth?
Amino Acids is the largest Form.
7. Are there any restraints impacting market growth?
Limitations Across Farm-Level Seed Treatment; Rising Environmental Concerns.
8. Can you provide examples of recent developments in the market?
February 2022: Plant Response Inc. was acquired by The Mosaic Company, which is a global fertilizer manufacturer. This acquisition strengthened the company's global presence. Through the acquisition, the company develops new products and solutions for the customers in a sustainable way.September 2021: Tradecorp launched Biimore worldwide, a biostimulant obtained from a plant fermentation process. Biimore is made up of a unique combination of primary and secondary compounds, L-α amino acids, vitamins, sugars, and traces of other natural compounds.May 2021: Plant Response Inc. announced its acquisition of WISErg, which is a startup that upcycles nutrients from recovered food for use in fertilizer and nutrient-efficient products that enhance plant and soil health.
9. What pricing options are available for accessing the report?
Pricing options include single-user, multi-user, and enterprise licenses priced at USD 3800, USD 4500, and USD 5800 respectively.
10. Is the market size provided in terms of value or volume?
The market size is provided in terms of value, measured in Million.
11. Are there any specific market keywords associated with the report?
Yes, the market keyword associated with the report is "Biostimulants Market," which aids in identifying and referencing the specific market segment covered.
12. How do I determine which pricing option suits my needs best?
The pricing options vary based on user requirements and access needs. Individual users may opt for single-user licenses, while businesses requiring broader access may choose multi-user or enterprise licenses for cost-effective access to the report.
13. Are there any additional resources or data provided in the Biostimulants Market report?
While the report offers comprehensive insights, it's advisable to review the specific contents or supplementary materials provided to ascertain if additional resources or data are available.
14. How can I stay updated on further developments or reports in the Biostimulants Market?
To stay informed about further developments, trends, and reports in the Biostimulants Market, consider subscribing to industry newsletters, following relevant companies and organizations, or regularly checking reputable industry news sources and publications.
Methodology
Step 1 - Identification of Relevant Samples Size from Population Database


Step 2 - Approaches for Defining Global Market Size (Value, Volume* & Price*)

Note*: In applicable scenarios
Step 3 - Data Sources
Primary Research
- Web Analytics
- Survey Reports
- Research Institute
- Latest Research Reports
- Opinion Leaders
Secondary Research
- Annual Reports
- White Paper
- Latest Press Release
- Industry Association
- Paid Database
- Investor Presentations

Step 4 - Data Triangulation
Involves using different sources of information in order to increase the validity of a study
These sources are likely to be stakeholders in a program - participants, other researchers, program staff, other community members, and so on.
Then we put all data in single framework & apply various statistical tools to find out the dynamic on the market.
During the analysis stage, feedback from the stakeholder groups would be compared to determine areas of agreement as well as areas of divergence