

Key Insights
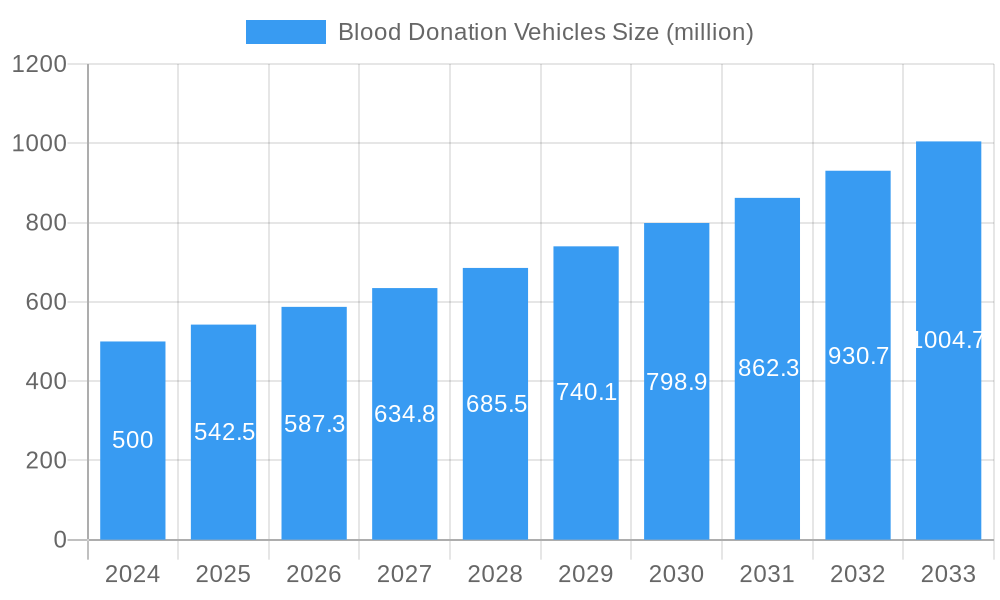
The global Blood Donation Vehicles market is poised for significant expansion, currently valued at an estimated $0.5 billion in 2024. This robust growth is driven by an anticipated Compound Annual Growth Rate (CAGR) of 8.5% over the forecast period extending to 2033. The increasing demand for mobile blood donation units, attributed to their ability to reach underserved populations and enhance convenience for donors, serves as a primary catalyst. Furthermore, the growing awareness campaigns promoting blood donation, coupled with governmental initiatives aimed at bolstering blood bank infrastructure, are contributing to market expansion. Technological advancements in vehicle design, incorporating enhanced patient comfort and safety features, are also playing a crucial role in driving adoption. The market's trajectory is further bolstered by the growing prevalence of chronic diseases requiring frequent blood transfusions and the continuous need for blood in surgical procedures and emergency situations.
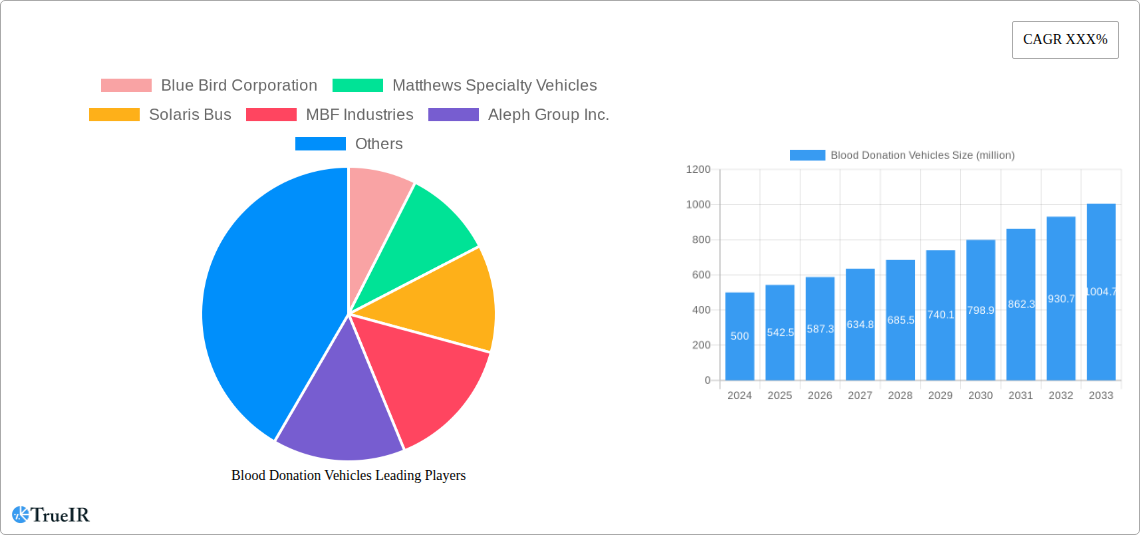
Blood Donation Vehicles Market Size (In Million)
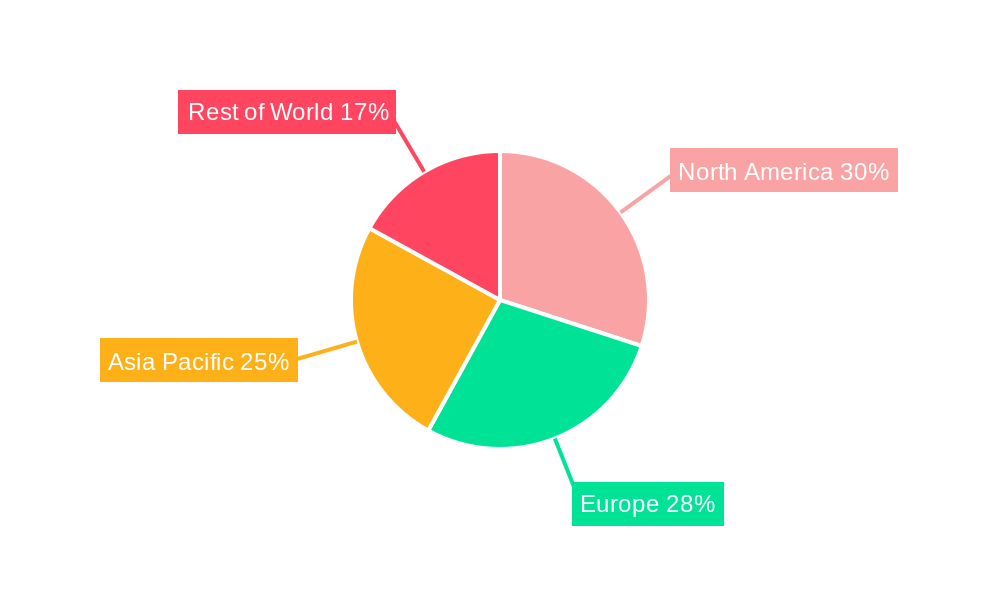
The market segmentation reveals a dynamic landscape. In terms of application, Hospitals are expected to dominate, leveraging these vehicles for efficient on-site blood collection and outreach programs. Blood Centers, as the core entities managing blood supply chains, will also represent a substantial segment, optimizing their collection efforts. "Others," encompassing mobile clinics and community health initiatives, will showcase considerable growth as well. The "Type" segmentation indicates a shift towards more sustainable solutions, with New Energy vehicles gaining traction alongside traditional Gasoline and Diesel models. This transition is driven by environmental concerns and evolving regulatory landscapes. Geographically, North America and Europe are leading the market, driven by developed healthcare infrastructures and proactive blood donation drives. However, the Asia Pacific region, particularly China and India, is projected to witness the fastest growth due to a burgeoning population, increasing healthcare expenditure, and a rising demand for blood products. Key players like Blue Bird Corporation, Matthews Specialty Vehicles, and NISSAN are actively investing in innovation and expanding their product portfolios to cater to the diverse needs of this growing market.
Blood Donation Vehicles Company Market Share
Blood Donation Vehicles Market: A Comprehensive Analysis and Future Outlook (2019-2033)
This in-depth report provides a panoramic view of the global Blood Donation Vehicles market, analyzing historical performance, current trends, and future trajectories. Spanning a study period from 2019 to 2033, with a base year of 2025 and a forecast period from 2025 to 2033, this analysis offers invaluable insights for industry stakeholders. The report meticulously examines market structure, competitive landscape, key trends, dominant segments, product innovations, growth drivers, challenges, key players, significant milestones, and future outlook. We leverage high-volume keywords and detailed quantitative data to ensure maximum SEO optimization and engagement for industry audiences.
Blood Donation Vehicles Market Structure & Competitive Landscape
The global Blood Donation Vehicles market exhibits a moderately consolidated structure, with a few key players holding a significant market share. Innovation is primarily driven by advancements in vehicle technology, enhanced donor comfort features, and increased operational efficiency. Regulatory impacts, such as stringent vehicle safety standards and health regulations for blood collection, play a crucial role in shaping product development and market entry. Product substitutes, while not direct replacements for specialized blood donation vehicles, include mobile health clinics and fixed blood donation centers, which can influence demand. End-user segmentation primarily revolves around Hospitals, Blood Centers, and Other applications, each with distinct requirements and procurement cycles. Mergers and Acquisitions (M&A) trends are indicative of strategic consolidation and expansion efforts, with an estimated XX M&A deals recorded during the historical period, signaling a dynamic competitive environment. The market concentration ratio is estimated to be around XX%, indicating the presence of both large established players and smaller niche manufacturers.
- Innovation Drivers:
- Advanced medical equipment integration
- Enhanced climate control and sanitation systems
- Improved vehicle chassis and fuel efficiency
- Connectivity and data management solutions
- Regulatory Impacts:
- Adherence to international safety and health standards
- Emission control regulations for vehicle types
- Certifications for medical equipment installation
- End-User Segmentation:
- Hospitals: Requiring mobile units for outreach and emergency blood collection.
- Blood Centers: Seeking efficient and high-capacity vehicles for regular mobile drives.
- Others: Including non-governmental organizations and specialized medical services.
- M&A Trends:
- Acquisition of smaller manufacturers by larger entities for market expansion.
- Strategic partnerships for technology development and distribution.
Blood Donation Vehicles Market Trends & Opportunities
The global Blood Donation Vehicles market is poised for significant growth, projected to reach a valuation exceeding XX billion by 2033, demonstrating a Compound Annual Growth Rate (CAGR) of approximately XX% during the forecast period. This robust expansion is fueled by a confluence of factors, including rising healthcare awareness, increasing demand for blood and blood products globally, and the growing need for accessible blood donation services in remote and underserved areas. Technological advancements are a key trend, with manufacturers continuously integrating state-of-the-art medical equipment, improved climate control, and enhanced donor comfort features into their vehicles. The shift towards New Energy vehicles is also gaining momentum, driven by environmental concerns and evolving government policies promoting sustainable transportation. Consumer preferences are increasingly leaning towards vehicles that offer a seamless and comfortable donor experience, prompting manufacturers to focus on interior design, privacy, and advanced amenities. The competitive dynamics within the market are characterized by intense innovation, strategic collaborations, and a growing emphasis on after-sales service and support. Market penetration rates for specialized blood donation vehicles are steadily increasing as healthcare infrastructure develops and mobile blood donation campaigns become more prevalent. The market opportunities lie in emerging economies with developing healthcare systems, the adoption of advanced technologies by established players, and the increasing focus on preventative healthcare initiatives. The ongoing global health initiatives and the critical need for a stable blood supply chain are fundamentally shaping the market's trajectory. Furthermore, the increasing prevalence of chronic diseases and the aging global population contribute to a sustained demand for blood transfusions, directly impacting the need for efficient blood collection infrastructure, including specialized vehicles. The digitalization of healthcare is also creating opportunities for smart blood donation vehicles equipped with real-time data monitoring and communication capabilities, enhancing operational efficiency and donor management. The trend towards greater public-private partnerships in healthcare delivery further stimulates the demand for mobile medical units, including blood donation vehicles, to extend reach and impact.
Dominant Markets & Segments in Blood Donation Vehicles
The global Blood Donation Vehicles market demonstrates clear regional dominance, with North America emerging as the leading market, followed closely by Europe. This dominance is attributed to well-established healthcare infrastructures, robust government support for blood donation initiatives, and a high level of public awareness regarding the importance of blood donation. Within North America, the United States accounts for a substantial market share due to its extensive network of blood centers and hospitals, coupled with consistent demand for blood products.
Dominant Region Analysis:
- North America: Characterized by high per capita healthcare spending, advanced technological adoption, and strong regulatory frameworks supporting blood collection.
- Europe: Driven by proactive public health policies, significant government funding for healthcare, and a well-organized network of blood transfusion services.
Dominant Application Segments:
- Blood Center: This segment holds the largest market share due to the primary function of blood centers being blood collection, processing, and distribution, necessitating specialized mobile units for outreach.
- Key Growth Drivers: Need for expanded donor reach, efficiency in collection drives, and meeting constant demand for blood.
- Hospital: Hospitals utilize blood donation vehicles for internal blood drives, emergency blood collection, and to supplement their blood bank inventories, especially in remote or disaster-stricken areas.
- Key Growth Drivers: Supporting hospital blood requirements, providing convenient donation options for staff and patients, and serving as mobile transfusion units in emergencies.
- Others: This segment includes various organizations and institutions that may require blood donation vehicles for specific campaigns or medical services.
- Key Growth Drivers: Corporate social responsibility initiatives, educational outreach programs, and specialized medical missions.
- Blood Center: This segment holds the largest market share due to the primary function of blood centers being blood collection, processing, and distribution, necessitating specialized mobile units for outreach.
Dominant Type Segments:
- Diesel: Currently dominates the market due to its established reliability, power, and cost-effectiveness, especially for heavy-duty applications and longer operational ranges.
- Key Growth Drivers: Proven performance, extensive refueling infrastructure, and lower initial investment compared to some alternatives.
- New Energy: This segment is experiencing rapid growth, driven by increasing environmental consciousness, supportive government incentives for electric vehicles, and advancements in battery technology.
- Key Growth Drivers: Government subsidies and tax credits, reduced operational costs (fuel and maintenance), and growing corporate sustainability initiatives.
- Gasoline: While less prevalent than diesel, gasoline-powered vehicles are still utilized in some regions or for specific applications where lower upfront costs and availability are prioritized.
- Key Growth Drivers: Lower initial purchase price in certain markets and established maintenance infrastructure in specific geographical areas.
- Diesel: Currently dominates the market due to its established reliability, power, and cost-effectiveness, especially for heavy-duty applications and longer operational ranges.
Blood Donation Vehicles Product Analysis
Product innovations in the Blood Donation Vehicles market are primarily focused on enhancing donor comfort and maximizing operational efficiency. Manufacturers are integrating advanced climate control systems, comfortable seating arrangements, and hygienic interiors to improve the donor experience. Technological advancements include the incorporation of state-of-the-art blood collection equipment, real-time monitoring systems for vital signs, and improved data management capabilities for seamless record-keeping. Competitive advantages often lie in the customization options offered, the reliability and durability of the vehicle chassis, and the integration of specialized medical equipment tailored to specific needs.
Key Drivers, Barriers & Challenges in Blood Donation Vehicles
Key Drivers: The blood donation vehicles market is propelled by several critical factors. Technological advancements in medical equipment and vehicle design are enhancing efficiency and donor experience. Growing global demand for blood products, driven by aging populations and chronic diseases, directly fuels the need for more collection vehicles. Supportive government policies, including subsidies for new energy vehicles and initiatives promoting blood donation, are significant growth catalysts. The increasing emphasis on public health awareness campaigns further boosts the demand for accessible blood donation services.
Barriers & Challenges: Despite the positive outlook, the market faces certain challenges. High initial investment costs for specialized vehicles can be a significant barrier, particularly for smaller organizations. Stringent regulatory requirements and the need for specialized certifications for medical equipment can slow down production and market entry. Supply chain disruptions for critical components, as witnessed in recent global events, can impact manufacturing timelines and costs. Furthermore, intense competition among manufacturers and the need for continuous innovation to stay ahead also present challenges.
Growth Drivers in the Blood Donation Vehicles Market
The growth of the Blood Donation Vehicles market is significantly influenced by a combination of technological, economic, and policy-driven factors. Technological innovations, such as the integration of advanced refrigeration systems for blood storage, improved patient monitoring tools, and user-friendly interfaces for phlebotomists, are enhancing the functionality and appeal of these vehicles. Economically, the increasing global healthcare expenditure and the growing awareness of the critical role of blood donation in saving lives are creating a sustained demand. Policy-wise, governments worldwide are increasingly recognizing the importance of a robust blood supply and are implementing favorable policies, including tax incentives for manufacturers of specialized vehicles and promotional campaigns for blood donation, which directly contribute to market expansion. The rising demand for blood in transfusions for surgeries, cancer treatments, and chronic illness management provides a consistent economic impetus for the market.
Challenges Impacting Blood Donation Vehicles Growth
Several barriers and restraints pose challenges to the growth of the Blood Donation Vehicles market. The substantial initial capital outlay required for acquiring these specialized vehicles can be prohibitive for many organizations, particularly in developing economies. Navigating complex and evolving regulatory landscapes, including vehicle safety standards and medical equipment certifications, can be a time-consuming and costly process for manufacturers. Furthermore, the global supply chain for critical components, such as specialized medical equipment and advanced vehicle chassis, remains vulnerable to disruptions, impacting production schedules and increasing costs. Competitive pressures from established players and the need for continuous R&D to incorporate the latest technological advancements also present ongoing challenges for market participants.
Key Players Shaping the Blood Donation Vehicles Market
- Blue Bird Corporation
- Matthews Specialty Vehicles
- Solaris Bus
- MBF Industries
- Aleph Group Inc.
- NISSAN
- La Boit Specialty Vehicles
- CLW Group
- China SEEHO Medical
Significant Blood Donation Vehicles Industry Milestones
- 2019: Introduction of advanced New Energy blood donation vehicles by leading manufacturers, focusing on reduced emissions and operational costs.
- 2020: Increased demand for mobile blood donation units due to disruptions in traditional donation methods caused by global health events.
- 2021: Significant investments in R&D for enhanced donor comfort features and improved medical equipment integration in new vehicle models.
- 2022: Strategic partnerships formed between vehicle manufacturers and medical equipment suppliers to offer integrated solutions.
- 2023: Expansion of blood donation vehicle fleets in emerging economies driven by government health initiatives and growing awareness.
Future Outlook for Blood Donation Vehicles Market
The future outlook for the Blood Donation Vehicles market is exceptionally promising, fueled by sustained demand for blood products and ongoing advancements in medical and automotive technologies. Strategic opportunities lie in the expansion of New Energy vehicle options, offering enhanced sustainability and reduced operational expenses. The increasing adoption of smart vehicle technologies, enabling real-time data analytics and remote monitoring, will further optimize collection efficiency. Furthermore, the growing focus on mobile healthcare solutions in underserved regions presents a significant untapped market potential, driving the need for versatile and technologically advanced blood donation vehicles. The market is expected to witness continued innovation, with manufacturers striving to create more comfortable, efficient, and accessible blood donation experiences.
Blood Donation Vehicles Segmentation
-
1. Application
- 1.1. Hospital
- 1.2. Blood Center
- 1.3. Others
-
2. Type
- 2.1. Gasoline
- 2.2. Diesel
- 2.3. New Energy
Blood Donation Vehicles Segmentation By Geography
-
1. North America
- 1.1. United States
- 1.2. Canada
- 1.3. Mexico
-
2. South America
- 2.1. Brazil
- 2.2. Argentina
- 2.3. Rest of South America
-
3. Europe
- 3.1. United Kingdom
- 3.2. Germany
- 3.3. France
- 3.4. Italy
- 3.5. Spain
- 3.6. Russia
- 3.7. Benelux
- 3.8. Nordics
- 3.9. Rest of Europe
-
4. Middle East & Africa
- 4.1. Turkey
- 4.2. Israel
- 4.3. GCC
- 4.4. North Africa
- 4.5. South Africa
- 4.6. Rest of Middle East & Africa
-
5. Asia Pacific
- 5.1. China
- 5.2. India
- 5.3. Japan
- 5.4. South Korea
- 5.5. ASEAN
- 5.6. Oceania
- 5.7. Rest of Asia Pacific
Blood Donation Vehicles Regional Market Share
Geographic Coverage of Blood Donation Vehicles
Blood Donation Vehicles REPORT HIGHLIGHTS
| Aspects | Details |
|---|---|
| Study Period | 2020-2034 |
| Base Year | 2025 |
| Estimated Year | 2026 |
| Forecast Period | 2026-2034 |
| Historical Period | 2020-2025 |
| Growth Rate | CAGR of 8.5% from 2020-2034 |
| Segmentation |
|
Table of Contents
- 1. Introduction
- 1.1. Research Scope
- 1.2. Market Segmentation
- 1.3. Research Methodology
- 1.4. Definitions and Assumptions
- 2. Executive Summary
- 2.1. Introduction
- 3. Market Dynamics
- 3.1. Introduction
- 3.2. Market Drivers
- 3.3. Market Restrains
- 3.4. Market Trends
- 4. Market Factor Analysis
- 4.1. Porters Five Forces
- 4.2. Supply/Value Chain
- 4.3. PESTEL analysis
- 4.4. Market Entropy
- 4.5. Patent/Trademark Analysis
- 5. Global Blood Donation Vehicles Analysis, Insights and Forecast, 2020-2032
- 5.1. Market Analysis, Insights and Forecast - by Application
- 5.1.1. Hospital
- 5.1.2. Blood Center
- 5.1.3. Others
- 5.2. Market Analysis, Insights and Forecast - by Type
- 5.2.1. Gasoline
- 5.2.2. Diesel
- 5.2.3. New Energy
- 5.3. Market Analysis, Insights and Forecast - by Region
- 5.3.1. North America
- 5.3.2. South America
- 5.3.3. Europe
- 5.3.4. Middle East & Africa
- 5.3.5. Asia Pacific
- 5.1. Market Analysis, Insights and Forecast - by Application
- 6. North America Blood Donation Vehicles Analysis, Insights and Forecast, 2020-2032
- 6.1. Market Analysis, Insights and Forecast - by Application
- 6.1.1. Hospital
- 6.1.2. Blood Center
- 6.1.3. Others
- 6.2. Market Analysis, Insights and Forecast - by Type
- 6.2.1. Gasoline
- 6.2.2. Diesel
- 6.2.3. New Energy
- 6.1. Market Analysis, Insights and Forecast - by Application
- 7. South America Blood Donation Vehicles Analysis, Insights and Forecast, 2020-2032
- 7.1. Market Analysis, Insights and Forecast - by Application
- 7.1.1. Hospital
- 7.1.2. Blood Center
- 7.1.3. Others
- 7.2. Market Analysis, Insights and Forecast - by Type
- 7.2.1. Gasoline
- 7.2.2. Diesel
- 7.2.3. New Energy
- 7.1. Market Analysis, Insights and Forecast - by Application
- 8. Europe Blood Donation Vehicles Analysis, Insights and Forecast, 2020-2032
- 8.1. Market Analysis, Insights and Forecast - by Application
- 8.1.1. Hospital
- 8.1.2. Blood Center
- 8.1.3. Others
- 8.2. Market Analysis, Insights and Forecast - by Type
- 8.2.1. Gasoline
- 8.2.2. Diesel
- 8.2.3. New Energy
- 8.1. Market Analysis, Insights and Forecast - by Application
- 9. Middle East & Africa Blood Donation Vehicles Analysis, Insights and Forecast, 2020-2032
- 9.1. Market Analysis, Insights and Forecast - by Application
- 9.1.1. Hospital
- 9.1.2. Blood Center
- 9.1.3. Others
- 9.2. Market Analysis, Insights and Forecast - by Type
- 9.2.1. Gasoline
- 9.2.2. Diesel
- 9.2.3. New Energy
- 9.1. Market Analysis, Insights and Forecast - by Application
- 10. Asia Pacific Blood Donation Vehicles Analysis, Insights and Forecast, 2020-2032
- 10.1. Market Analysis, Insights and Forecast - by Application
- 10.1.1. Hospital
- 10.1.2. Blood Center
- 10.1.3. Others
- 10.2. Market Analysis, Insights and Forecast - by Type
- 10.2.1. Gasoline
- 10.2.2. Diesel
- 10.2.3. New Energy
- 10.1. Market Analysis, Insights and Forecast - by Application
- 11. Competitive Analysis
- 11.1. Global Market Share Analysis 2025
- 11.2. Company Profiles
- 11.2.1 Blue Bird Corporation
- 11.2.1.1. Overview
- 11.2.1.2. Products
- 11.2.1.3. SWOT Analysis
- 11.2.1.4. Recent Developments
- 11.2.1.5. Financials (Based on Availability)
- 11.2.2 Matthews Specialty Vehicles
- 11.2.2.1. Overview
- 11.2.2.2. Products
- 11.2.2.3. SWOT Analysis
- 11.2.2.4. Recent Developments
- 11.2.2.5. Financials (Based on Availability)
- 11.2.3 Solaris Bus
- 11.2.3.1. Overview
- 11.2.3.2. Products
- 11.2.3.3. SWOT Analysis
- 11.2.3.4. Recent Developments
- 11.2.3.5. Financials (Based on Availability)
- 11.2.4 MBF Industries
- 11.2.4.1. Overview
- 11.2.4.2. Products
- 11.2.4.3. SWOT Analysis
- 11.2.4.4. Recent Developments
- 11.2.4.5. Financials (Based on Availability)
- 11.2.5 Aleph Group Inc.
- 11.2.5.1. Overview
- 11.2.5.2. Products
- 11.2.5.3. SWOT Analysis
- 11.2.5.4. Recent Developments
- 11.2.5.5. Financials (Based on Availability)
- 11.2.6 NISSAN
- 11.2.6.1. Overview
- 11.2.6.2. Products
- 11.2.6.3. SWOT Analysis
- 11.2.6.4. Recent Developments
- 11.2.6.5. Financials (Based on Availability)
- 11.2.7 La Boit Specialty Vehicles
- 11.2.7.1. Overview
- 11.2.7.2. Products
- 11.2.7.3. SWOT Analysis
- 11.2.7.4. Recent Developments
- 11.2.7.5. Financials (Based on Availability)
- 11.2.8 CLW Group
- 11.2.8.1. Overview
- 11.2.8.2. Products
- 11.2.8.3. SWOT Analysis
- 11.2.8.4. Recent Developments
- 11.2.8.5. Financials (Based on Availability)
- 11.2.9 China SEEHO Medical
- 11.2.9.1. Overview
- 11.2.9.2. Products
- 11.2.9.3. SWOT Analysis
- 11.2.9.4. Recent Developments
- 11.2.9.5. Financials (Based on Availability)
- 11.2.1 Blue Bird Corporation
List of Figures
- Figure 1: Global Blood Donation Vehicles Revenue Breakdown (undefined, %) by Region 2025 & 2033
- Figure 2: North America Blood Donation Vehicles Revenue (undefined), by Application 2025 & 2033
- Figure 3: North America Blood Donation Vehicles Revenue Share (%), by Application 2025 & 2033
- Figure 4: North America Blood Donation Vehicles Revenue (undefined), by Type 2025 & 2033
- Figure 5: North America Blood Donation Vehicles Revenue Share (%), by Type 2025 & 2033
- Figure 6: North America Blood Donation Vehicles Revenue (undefined), by Country 2025 & 2033
- Figure 7: North America Blood Donation Vehicles Revenue Share (%), by Country 2025 & 2033
- Figure 8: South America Blood Donation Vehicles Revenue (undefined), by Application 2025 & 2033
- Figure 9: South America Blood Donation Vehicles Revenue Share (%), by Application 2025 & 2033
- Figure 10: South America Blood Donation Vehicles Revenue (undefined), by Type 2025 & 2033
- Figure 11: South America Blood Donation Vehicles Revenue Share (%), by Type 2025 & 2033
- Figure 12: South America Blood Donation Vehicles Revenue (undefined), by Country 2025 & 2033
- Figure 13: South America Blood Donation Vehicles Revenue Share (%), by Country 2025 & 2033
- Figure 14: Europe Blood Donation Vehicles Revenue (undefined), by Application 2025 & 2033
- Figure 15: Europe Blood Donation Vehicles Revenue Share (%), by Application 2025 & 2033
- Figure 16: Europe Blood Donation Vehicles Revenue (undefined), by Type 2025 & 2033
- Figure 17: Europe Blood Donation Vehicles Revenue Share (%), by Type 2025 & 2033
- Figure 18: Europe Blood Donation Vehicles Revenue (undefined), by Country 2025 & 2033
- Figure 19: Europe Blood Donation Vehicles Revenue Share (%), by Country 2025 & 2033
- Figure 20: Middle East & Africa Blood Donation Vehicles Revenue (undefined), by Application 2025 & 2033
- Figure 21: Middle East & Africa Blood Donation Vehicles Revenue Share (%), by Application 2025 & 2033
- Figure 22: Middle East & Africa Blood Donation Vehicles Revenue (undefined), by Type 2025 & 2033
- Figure 23: Middle East & Africa Blood Donation Vehicles Revenue Share (%), by Type 2025 & 2033
- Figure 24: Middle East & Africa Blood Donation Vehicles Revenue (undefined), by Country 2025 & 2033
- Figure 25: Middle East & Africa Blood Donation Vehicles Revenue Share (%), by Country 2025 & 2033
- Figure 26: Asia Pacific Blood Donation Vehicles Revenue (undefined), by Application 2025 & 2033
- Figure 27: Asia Pacific Blood Donation Vehicles Revenue Share (%), by Application 2025 & 2033
- Figure 28: Asia Pacific Blood Donation Vehicles Revenue (undefined), by Type 2025 & 2033
- Figure 29: Asia Pacific Blood Donation Vehicles Revenue Share (%), by Type 2025 & 2033
- Figure 30: Asia Pacific Blood Donation Vehicles Revenue (undefined), by Country 2025 & 2033
- Figure 31: Asia Pacific Blood Donation Vehicles Revenue Share (%), by Country 2025 & 2033
List of Tables
- Table 1: Global Blood Donation Vehicles Revenue undefined Forecast, by Application 2020 & 2033
- Table 2: Global Blood Donation Vehicles Revenue undefined Forecast, by Type 2020 & 2033
- Table 3: Global Blood Donation Vehicles Revenue undefined Forecast, by Region 2020 & 2033
- Table 4: Global Blood Donation Vehicles Revenue undefined Forecast, by Application 2020 & 2033
- Table 5: Global Blood Donation Vehicles Revenue undefined Forecast, by Type 2020 & 2033
- Table 6: Global Blood Donation Vehicles Revenue undefined Forecast, by Country 2020 & 2033
- Table 7: United States Blood Donation Vehicles Revenue (undefined) Forecast, by Application 2020 & 2033
- Table 8: Canada Blood Donation Vehicles Revenue (undefined) Forecast, by Application 2020 & 2033
- Table 9: Mexico Blood Donation Vehicles Revenue (undefined) Forecast, by Application 2020 & 2033
- Table 10: Global Blood Donation Vehicles Revenue undefined Forecast, by Application 2020 & 2033
- Table 11: Global Blood Donation Vehicles Revenue undefined Forecast, by Type 2020 & 2033
- Table 12: Global Blood Donation Vehicles Revenue undefined Forecast, by Country 2020 & 2033
- Table 13: Brazil Blood Donation Vehicles Revenue (undefined) Forecast, by Application 2020 & 2033
- Table 14: Argentina Blood Donation Vehicles Revenue (undefined) Forecast, by Application 2020 & 2033
- Table 15: Rest of South America Blood Donation Vehicles Revenue (undefined) Forecast, by Application 2020 & 2033
- Table 16: Global Blood Donation Vehicles Revenue undefined Forecast, by Application 2020 & 2033
- Table 17: Global Blood Donation Vehicles Revenue undefined Forecast, by Type 2020 & 2033
- Table 18: Global Blood Donation Vehicles Revenue undefined Forecast, by Country 2020 & 2033
- Table 19: United Kingdom Blood Donation Vehicles Revenue (undefined) Forecast, by Application 2020 & 2033
- Table 20: Germany Blood Donation Vehicles Revenue (undefined) Forecast, by Application 2020 & 2033
- Table 21: France Blood Donation Vehicles Revenue (undefined) Forecast, by Application 2020 & 2033
- Table 22: Italy Blood Donation Vehicles Revenue (undefined) Forecast, by Application 2020 & 2033
- Table 23: Spain Blood Donation Vehicles Revenue (undefined) Forecast, by Application 2020 & 2033
- Table 24: Russia Blood Donation Vehicles Revenue (undefined) Forecast, by Application 2020 & 2033
- Table 25: Benelux Blood Donation Vehicles Revenue (undefined) Forecast, by Application 2020 & 2033
- Table 26: Nordics Blood Donation Vehicles Revenue (undefined) Forecast, by Application 2020 & 2033
- Table 27: Rest of Europe Blood Donation Vehicles Revenue (undefined) Forecast, by Application 2020 & 2033
- Table 28: Global Blood Donation Vehicles Revenue undefined Forecast, by Application 2020 & 2033
- Table 29: Global Blood Donation Vehicles Revenue undefined Forecast, by Type 2020 & 2033
- Table 30: Global Blood Donation Vehicles Revenue undefined Forecast, by Country 2020 & 2033
- Table 31: Turkey Blood Donation Vehicles Revenue (undefined) Forecast, by Application 2020 & 2033
- Table 32: Israel Blood Donation Vehicles Revenue (undefined) Forecast, by Application 2020 & 2033
- Table 33: GCC Blood Donation Vehicles Revenue (undefined) Forecast, by Application 2020 & 2033
- Table 34: North Africa Blood Donation Vehicles Revenue (undefined) Forecast, by Application 2020 & 2033
- Table 35: South Africa Blood Donation Vehicles Revenue (undefined) Forecast, by Application 2020 & 2033
- Table 36: Rest of Middle East & Africa Blood Donation Vehicles Revenue (undefined) Forecast, by Application 2020 & 2033
- Table 37: Global Blood Donation Vehicles Revenue undefined Forecast, by Application 2020 & 2033
- Table 38: Global Blood Donation Vehicles Revenue undefined Forecast, by Type 2020 & 2033
- Table 39: Global Blood Donation Vehicles Revenue undefined Forecast, by Country 2020 & 2033
- Table 40: China Blood Donation Vehicles Revenue (undefined) Forecast, by Application 2020 & 2033
- Table 41: India Blood Donation Vehicles Revenue (undefined) Forecast, by Application 2020 & 2033
- Table 42: Japan Blood Donation Vehicles Revenue (undefined) Forecast, by Application 2020 & 2033
- Table 43: South Korea Blood Donation Vehicles Revenue (undefined) Forecast, by Application 2020 & 2033
- Table 44: ASEAN Blood Donation Vehicles Revenue (undefined) Forecast, by Application 2020 & 2033
- Table 45: Oceania Blood Donation Vehicles Revenue (undefined) Forecast, by Application 2020 & 2033
- Table 46: Rest of Asia Pacific Blood Donation Vehicles Revenue (undefined) Forecast, by Application 2020 & 2033
Frequently Asked Questions
1. What is the projected Compound Annual Growth Rate (CAGR) of the Blood Donation Vehicles?
The projected CAGR is approximately 8.5%.
2. Which companies are prominent players in the Blood Donation Vehicles?
Key companies in the market include Blue Bird Corporation, Matthews Specialty Vehicles, Solaris Bus, MBF Industries, Aleph Group Inc., NISSAN, La Boit Specialty Vehicles, CLW Group, China SEEHO Medical.
3. What are the main segments of the Blood Donation Vehicles?
The market segments include Application, Type.
4. Can you provide details about the market size?
The market size is estimated to be USD XXX N/A as of 2022.
5. What are some drivers contributing to market growth?
N/A
6. What are the notable trends driving market growth?
N/A
7. Are there any restraints impacting market growth?
N/A
8. Can you provide examples of recent developments in the market?
N/A
9. What pricing options are available for accessing the report?
Pricing options include single-user, multi-user, and enterprise licenses priced at USD 2900.00, USD 4350.00, and USD 5800.00 respectively.
10. Is the market size provided in terms of value or volume?
The market size is provided in terms of value, measured in N/A.
11. Are there any specific market keywords associated with the report?
Yes, the market keyword associated with the report is "Blood Donation Vehicles," which aids in identifying and referencing the specific market segment covered.
12. How do I determine which pricing option suits my needs best?
The pricing options vary based on user requirements and access needs. Individual users may opt for single-user licenses, while businesses requiring broader access may choose multi-user or enterprise licenses for cost-effective access to the report.
13. Are there any additional resources or data provided in the Blood Donation Vehicles report?
While the report offers comprehensive insights, it's advisable to review the specific contents or supplementary materials provided to ascertain if additional resources or data are available.
14. How can I stay updated on further developments or reports in the Blood Donation Vehicles?
To stay informed about further developments, trends, and reports in the Blood Donation Vehicles, consider subscribing to industry newsletters, following relevant companies and organizations, or regularly checking reputable industry news sources and publications.
Methodology
Step 1 - Identification of Relevant Samples Size from Population Database


Step 2 - Approaches for Defining Global Market Size (Value, Volume* & Price*)

Note*: In applicable scenarios
Step 3 - Data Sources
Primary Research
- Web Analytics
- Survey Reports
- Research Institute
- Latest Research Reports
- Opinion Leaders
Secondary Research
- Annual Reports
- White Paper
- Latest Press Release
- Industry Association
- Paid Database
- Investor Presentations

Step 4 - Data Triangulation
Involves using different sources of information in order to increase the validity of a study
These sources are likely to be stakeholders in a program - participants, other researchers, program staff, other community members, and so on.
Then we put all data in single framework & apply various statistical tools to find out the dynamic on the market.
During the analysis stage, feedback from the stakeholder groups would be compared to determine areas of agreement as well as areas of divergence