

Key Insights
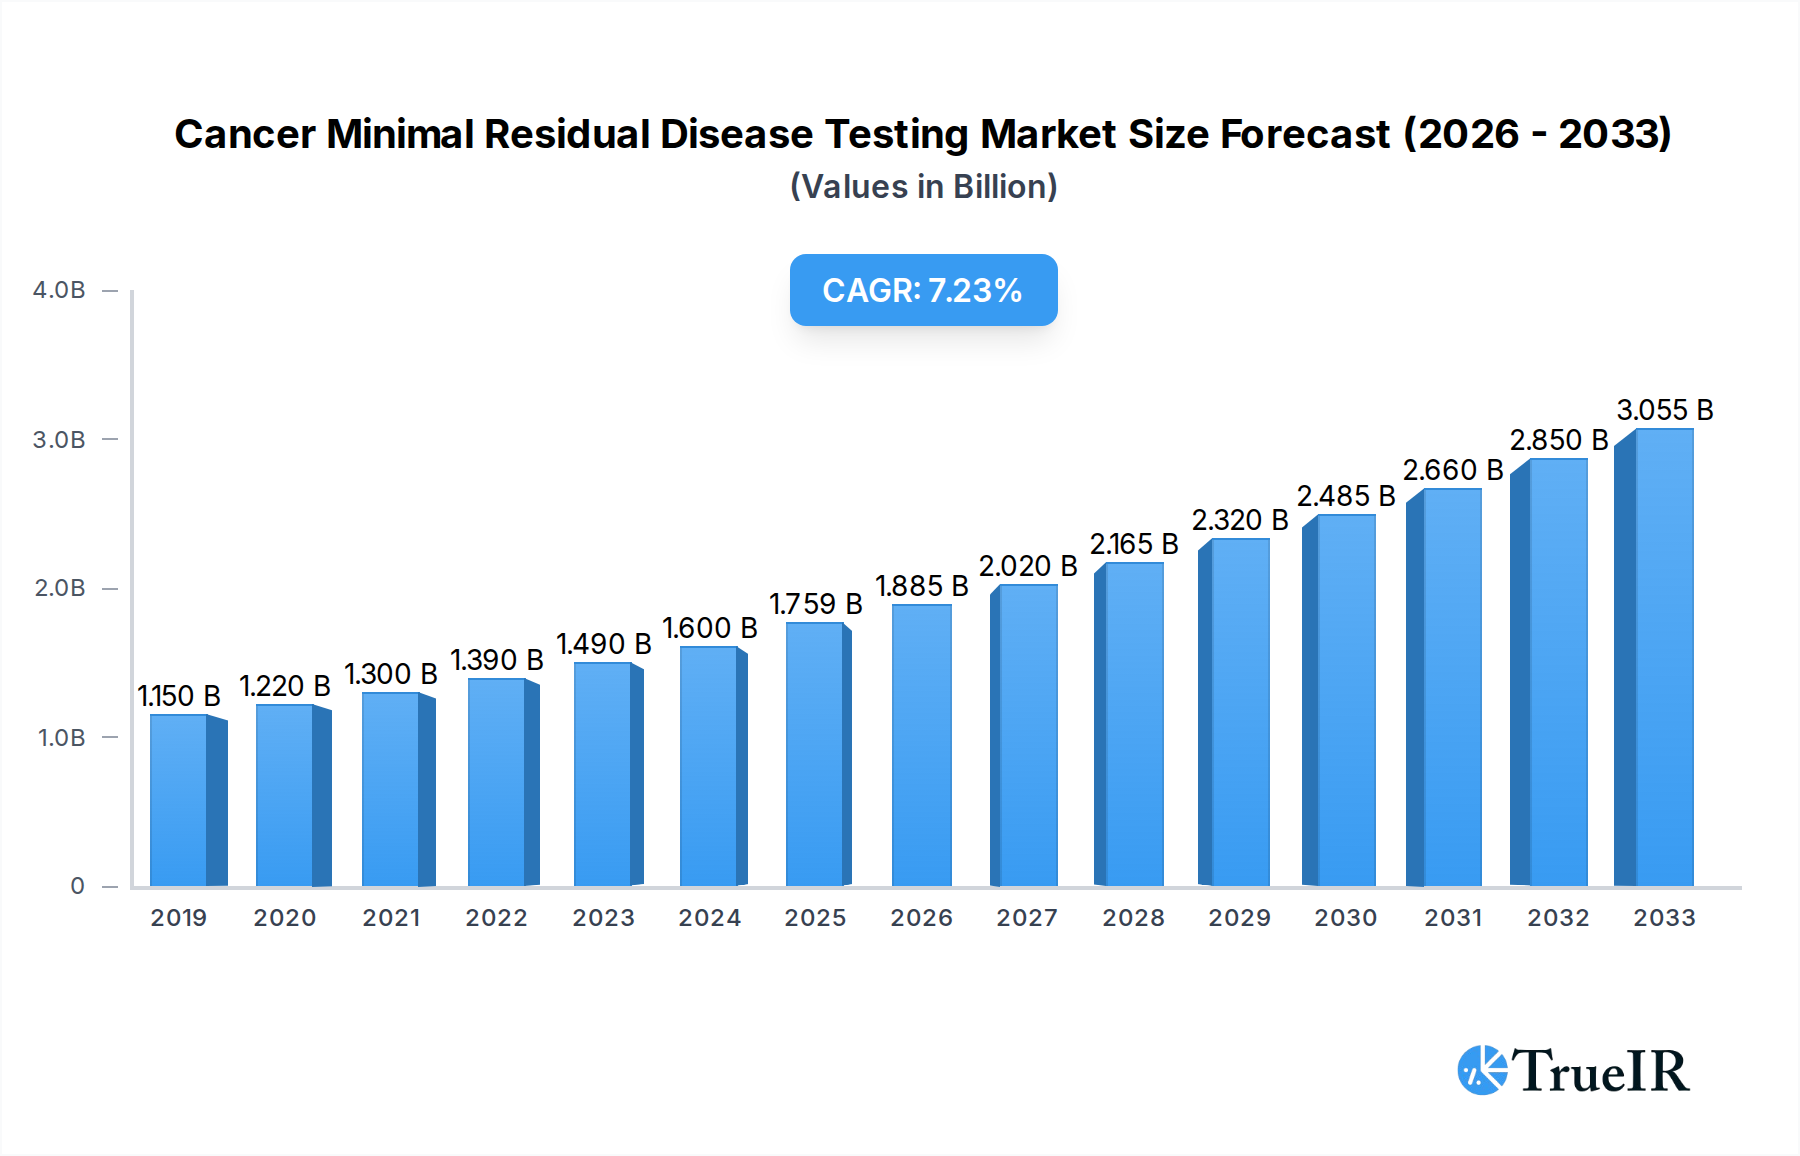
The Cancer Minimal Residual Disease (MRD) Testing market is poised for significant expansion, projected to reach approximately $1759 million by 2025 and grow at a robust Compound Annual Growth Rate (CAGR) of 7% through 2033. This dynamic growth is underpinned by several key drivers, most notably the increasing global incidence of cancer and the subsequent demand for more precise and sensitive diagnostic tools. The advancements in molecular biology and diagnostic technologies have been instrumental, with the adoption of sophisticated techniques like Next-Generation Sequencing (NGS) and Polymerase Chain Reaction (PCR) revolutionizing MRD detection. These technologies enable the identification of minuscule traces of cancer cells that may remain after initial treatment, allowing for early detection of relapse and enabling personalized treatment strategies. Hematological malignancies, including leukemia and lymphoma, are currently the primary application areas benefiting from MRD testing due to the established effectiveness of these methods in these cancer types. The trend towards precision medicine and the growing emphasis on improving patient outcomes and survival rates are further fueling market expansion. As clinical guidelines increasingly incorporate MRD testing into treatment protocols, its adoption is expected to accelerate across a wider spectrum of cancers.

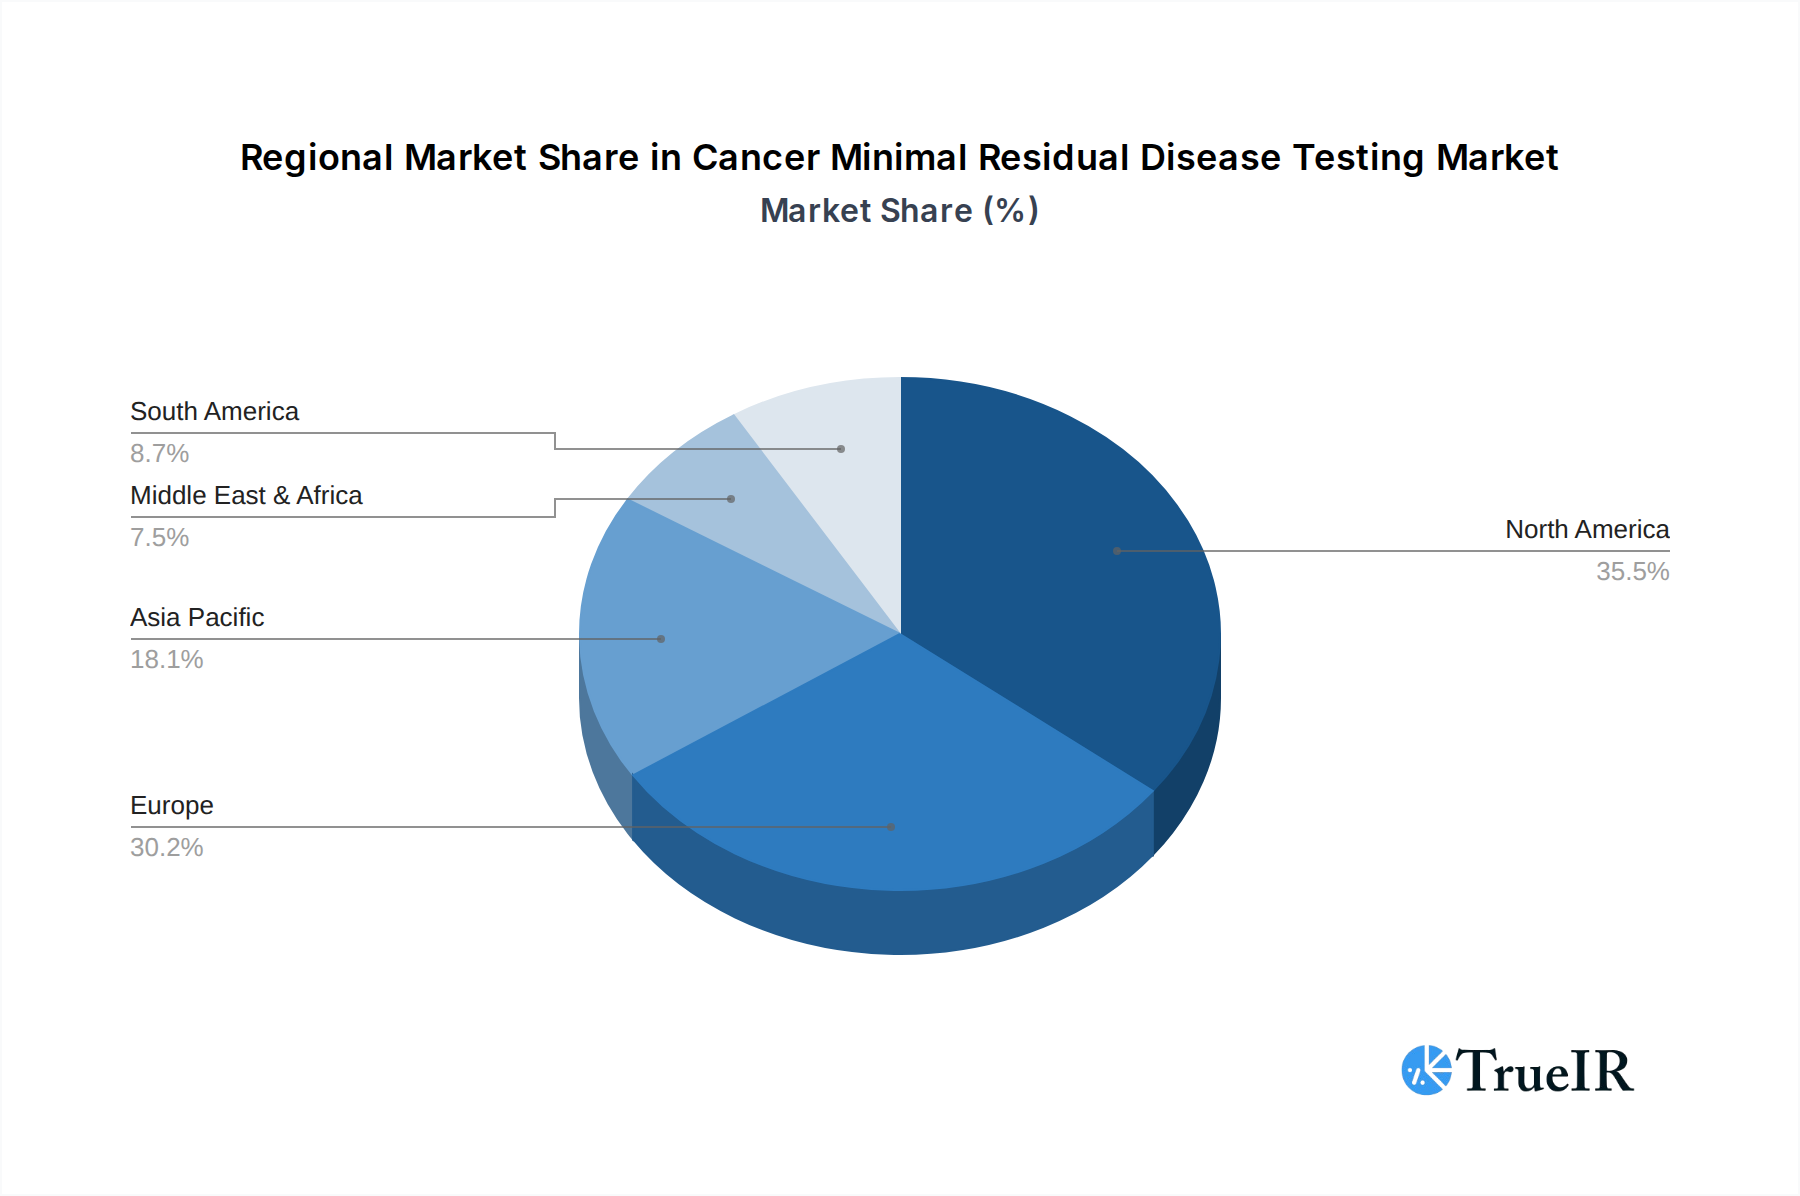
Cancer Minimal Residual Disease Testing Market Size (In Billion)
The market also presents considerable opportunities driven by ongoing research and development, leading to the introduction of novel testing platforms and an expanding range of applications beyond traditional hematological cancers. The solid tumor segment, in particular, is a rapidly evolving area with significant growth potential as research efforts focus on adapting MRD testing methodologies to detect residual disease in these complex cancers. While the market benefits from strong growth drivers, certain restraints such as the high cost of advanced diagnostic technologies and the need for specialized infrastructure and trained personnel may pose challenges. However, ongoing efforts to reduce costs and improve accessibility are expected to mitigate these limitations. Geographically, North America and Europe currently dominate the market due to advanced healthcare infrastructure and high R&D investments. However, the Asia Pacific region is anticipated to witness the fastest growth, driven by a large patient population, increasing healthcare expenditure, and rising awareness about advanced cancer diagnostics. The competitive landscape is characterized by the presence of several established players and emerging innovators, all vying for market share through product development, strategic partnerships, and geographical expansion.
Cancer Minimal Residual Disease Testing Company Market Share
Cancer Minimal Residual Disease (MRD) Testing Market: Comprehensive Industry Analysis 2019-2033
This in-depth report provides a strategic analysis of the global Cancer Minimal Residual Disease (MRD) Testing market, offering unparalleled insights into its structure, trends, competitive landscape, and future trajectory. Covering the period from 2019 to 2033, with a base year of 2025 and a forecast period spanning 2025-2033, this report is an essential resource for stakeholders seeking to capitalize on the expanding opportunities within this critical oncological segment. We explore the market's evolution driven by advancements in diagnostic technologies, increasing adoption in clinical practice, and the growing demand for personalized cancer treatment strategies.
Cancer Minimal Residual Disease Testing Market Structure & Competitive Landscape
The Cancer Minimal Residual Disease (MRD) Testing market exhibits a moderately concentrated structure, with key players investing heavily in research and development to drive innovation. Primary innovation drivers include the relentless pursuit of higher sensitivity and specificity in MRD detection methods, leading to advancements in molecular diagnostics and flow cytometry. Regulatory impacts are significant, with evolving guidelines from bodies like the FDA and EMA shaping market access and product approvals. Product substitutes, while present in traditional diagnostic methods, are increasingly being superseded by more accurate MRD testing solutions. End-user segmentation highlights the critical role of oncologists, hematologists, and clinical laboratories. Merger and acquisition (M&A) trends are prevalent, as larger companies seek to consolidate market share and acquire novel technologies. For instance, an estimated 25 M&A deals were observed in the historical period (2019-2024), reflecting strategic consolidation. The market concentration ratio (CR4) is estimated at 45% for the base year 2025, indicating a significant presence of the top four players.
Cancer Minimal Residual Disease Testing Market Trends & Opportunities
The global Cancer Minimal Residual Disease (MRD) Testing market is poised for substantial growth, projected to expand from an estimated market size of USD 3,200 million in 2025 to USD 8,500 million by 2033, exhibiting a compound annual growth rate (CAGR) of approximately 13.0% during the forecast period (2025–2033). This upward trajectory is underpinned by a confluence of factors, including the increasing incidence of various cancers globally, a growing emphasis on precision medicine, and the continuous evolution of diagnostic technologies. Next-Generation Sequencing (NGS) is emerging as a dominant technology, offering unparalleled sensitivity and the ability to detect a broad spectrum of genetic alterations associated with MRD. Polymerase Chain Reaction (PCR)-based methods also remain crucial, particularly for specific gene targets, providing rapid and cost-effective solutions. The market penetration rate for MRD testing in hematological malignancies is expected to reach 75% by 2033, driven by established clinical guidelines and proven benefits in treatment stratification and relapse monitoring. In solid tumors, market penetration is currently lower but anticipated to experience a CAGR of 15.5% as novel applications and biomarkers are validated.
Consumer preferences are shifting towards non-invasive or minimally invasive testing methods, further fueling the demand for advanced molecular diagnostics. The competitive dynamics are characterized by intense innovation, with companies actively developing next-generation assays and platforms designed to improve turnaround times and reduce costs. Strategic partnerships between diagnostic companies, pharmaceutical firms, and academic research institutions are becoming increasingly common, fostering collaborative efforts to accelerate the translation of laboratory discoveries into clinical applications. The rising awareness among healthcare professionals and patients regarding the prognostic and predictive value of MRD testing is a significant market driver. The increasing availability of reimbursement policies for MRD testing in various regions is also contributing to market expansion. Furthermore, the integration of artificial intelligence and machine learning in data analysis from MRD tests is expected to unlock new insights and enhance diagnostic accuracy, creating further opportunities for market growth.
Dominant Markets & Segments in Cancer Minimal Residual Disease Testing
The Hematological Malignancies segment is the dominant force within the Cancer Minimal Residual Disease (MRD) Testing market, encompassing leukemia and lymphoma, due to the well-established clinical utility and early adoption of MRD assessment in these blood cancers. Within this segment, Leukemia accounts for an estimated 45% of the total MRD testing volume in 2025, followed by Lymphoma at approximately 35%. The prevalence of these conditions, coupled with the proven impact of MRD monitoring on treatment decisions and patient outcomes, has solidified their leading position.
Next-Generation Sequencing (NGS) is the fastest-growing and most impactful technology type in the MRD testing market. Its ability to provide high sensitivity, broad target coverage, and multiplexing capabilities makes it indispensable for detecting even trace amounts of cancer cells. The NGS segment is projected to grow at a CAGR of 16.5% from 2025 to 2033. Polymerase Chain Reaction (PCR) remains a significant and widely used technology, particularly for specific genetic targets and in settings where rapid turnaround is critical. It is expected to maintain a strong market share, with an estimated 25% of the market in 2025. Flow Cytometry continues to be a valuable tool, especially for immunophenotypic analysis, and is projected to hold a market share of 20% in 2025.
Geographically, North America is expected to remain the leading market for Cancer MRD Testing, driven by advanced healthcare infrastructure, high R&D investment, and robust regulatory support for innovative diagnostic technologies. The United States, in particular, represents a substantial portion of this market. Europe follows as the second-largest market, with strong contributions from countries like Germany, the UK, and France, which have well-developed healthcare systems and a growing focus on personalized oncology. Asia Pacific is emerging as a rapidly growing region, fueled by increasing healthcare expenditure, a rising cancer burden, and government initiatives to improve diagnostic capabilities. Key growth drivers in these dominant regions include:
- Government initiatives and funding: Increased public health investment and research grants supporting cancer diagnostics.
- Advanced healthcare infrastructure: Presence of world-class medical centers and diagnostic laboratories.
- High cancer prevalence and awareness: Growing incidence rates and increased patient and physician awareness of cancer detection and monitoring.
- Favorable reimbursement policies: Expanding coverage for MRD testing by insurance providers.
- Technological adoption: Early and widespread adoption of advanced diagnostic platforms like NGS and PCR.
Cancer Minimal Residual Disease Testing Product Analysis
Product innovation in Cancer MRD Testing is primarily focused on enhancing assay sensitivity, reducing turnaround times, and expanding the range of detectable targets for both hematological malignancies and solid tumors. Key advancements include the development of highly multiplexed NGS panels capable of simultaneously identifying multiple genetic mutations, and more sensitive PCR-based assays for highly specific biomarker detection. Companies are also developing liquid biopsy solutions for non-invasive MRD monitoring, offering significant competitive advantages by enabling serial testing without requiring invasive procedures. The market fit is driven by the increasing demand for precise patient stratification, personalized treatment selection, and early relapse detection, all of which are critical for improving cancer survival rates.
Key Drivers, Barriers & Challenges in Cancer Minimal Residual Disease Testing
Key Drivers: The Cancer Minimal Residual Disease (MRD) Testing market is propelled by several significant drivers. Technologically, the ongoing evolution of Next-Generation Sequencing (NGS) and advanced Polymerase Chain Reaction (PCR) techniques offers unprecedented sensitivity and specificity in detecting residual cancer cells. Economically, the increasing healthcare expenditure globally and the growing adoption of precision medicine approaches are fueling investment in advanced diagnostics. Policy-driven factors, such as evolving regulatory approvals and expanding reimbursement policies for MRD testing in various cancer types, are crucial enablers. For example, the increasing inclusion of MRD testing in treatment guidelines for Acute Myeloid Leukemia (AML) by organizations like the National Comprehensive Cancer Network (NCCN) has been a major driver.
Barriers & Challenges: Despite robust growth potential, the market faces significant challenges. Regulatory complexities and the time-consuming approval processes for new MRD assays can hinder market entry. Supply chain issues, particularly for specialized reagents and advanced instrumentation, can impact production and availability. Competitive pressures among established players and emerging companies also intensify, demanding continuous innovation and cost-effectiveness. For instance, the high cost of NGS-based MRD testing can be a barrier to widespread adoption in resource-limited settings. Furthermore, the lack of standardized protocols across different laboratories and the need for specialized expertise for data interpretation present ongoing hurdles.
Growth Drivers in the Cancer Minimal Residual Disease Testing Market
The Cancer Minimal Residual Disease (MRD) Testing market is experiencing robust growth, primarily driven by technological advancements, particularly in Next-Generation Sequencing (NGS) and Polymerase Chain Reaction (PCR). These technologies enable highly sensitive and specific detection of minimal residual disease, crucial for optimizing cancer treatment and monitoring. The expanding understanding of MRD's prognostic and predictive value in both hematological malignancies and solid tumors is a significant catalyst. Furthermore, increasing adoption of precision medicine, a growing global cancer burden, and supportive reimbursement policies are creating favorable market conditions. The development of standardized, cost-effective, and user-friendly MRD testing platforms is also a key growth driver.
Challenges Impacting Cancer Minimal Residual Disease Testing Growth
Several challenges are impacting the growth trajectory of the Cancer Minimal Residual Disease (MRD) Testing market. Regulatory hurdles and the lengthy approval pathways for novel diagnostic assays can slow down market penetration. Supply chain disruptions for critical reagents and components can affect manufacturing and timely delivery. Intense competitive pressures necessitate continuous innovation and cost optimization. The high cost associated with advanced MRD technologies, such as NGS, can also be a barrier to widespread accessibility, particularly in emerging economies. Additionally, the need for specialized expertise for data interpretation and the lack of universal standardization in testing protocols present ongoing obstacles to market expansion.
Key Players Shaping the Cancer Minimal Residual Disease Testing Market
- Adaptive Biotechnologies Corporation
- ArcherDX, Inc. (Invitae Corporation)
- Asuragen
- Arup Laboratories
- Bio-Rad Laboratories
- Cergentis B.V.
- F. Hoffmann- La Roche Ltd
- Guardant Health
- ICON plc
- Invivoscribe
- Laboratory Corporation of America Holdings
- Mission Bio
- Natera, Inc.
- NeoGenomics Laboratories
- Opko Health
- Quest Diagnostics Incorporated
- Sysmex Corporation
- Genetron Health
Significant Cancer Minimal Residual Disease Testing Industry Milestones
- 2019: Increased regulatory scrutiny and guidance on MRD testing for hematological malignancies by FDA.
- 2020: Launch of novel NGS-based MRD panels for solid tumors, expanding application scope.
- 2021: Significant investment rounds for companies developing AI-powered MRD data analysis platforms.
- 2021 (October): Merger of ArcherDX with Invitae Corporation, consolidating NGS capabilities.
- 2022: Expansion of reimbursement coverage for MRD testing in specific leukemia subtypes in several European countries.
- 2023: Introduction of highly sensitive droplet digital PCR (ddPCR) assays for more precise MRD quantification.
- 2023 (November): Acquisition of Cergentis B.V. by a leading diagnostics conglomerate, strengthening its portfolio in genomic profiling.
- 2024: Publication of landmark studies demonstrating the utility of MRD testing in guiding adjuvant therapy decisions for early-stage solid tumors.
Future Outlook for Cancer Minimal Residual Disease Testing Market
The future outlook for the Cancer Minimal Residual Disease (MRD) Testing market is exceptionally promising, driven by an anticipated surge in diagnostic adoption and technological refinement. Strategic opportunities lie in the expansion of MRD testing into a wider range of solid tumors, the development of more accessible and cost-effective technologies, and the integration of MRD data with other biomarkers for comprehensive patient management. The increasing emphasis on personalized cancer care and the growing demand for early relapse detection will continue to fuel market growth. Continued innovation in liquid biopsy techniques and the increasing sophistication of bioinformatics and AI-driven data analysis will further enhance the clinical utility and market potential of MRD testing, solidifying its role as a cornerstone of modern oncology.
Cancer Minimal Residual Disease Testing Segmentation
-
1. Application
- 1.1. Hematological Malignancies
- 1.2. Leukemia
- 1.3. Lymphoma
- 1.4. Solid Tumors
- 1.5. Other
-
2. Type
- 2.1. Flow Cytometry
- 2.2. Polymerase Chain Reaction (PCR)
- 2.3. Next-Generation Sequencing (NGS)
- 2.4. Other
Cancer Minimal Residual Disease Testing Segmentation By Geography
-
1. North America
- 1.1. United States
- 1.2. Canada
- 1.3. Mexico
-
2. South America
- 2.1. Brazil
- 2.2. Argentina
- 2.3. Rest of South America
-
3. Europe
- 3.1. United Kingdom
- 3.2. Germany
- 3.3. France
- 3.4. Italy
- 3.5. Spain
- 3.6. Russia
- 3.7. Benelux
- 3.8. Nordics
- 3.9. Rest of Europe
-
4. Middle East & Africa
- 4.1. Turkey
- 4.2. Israel
- 4.3. GCC
- 4.4. North Africa
- 4.5. South Africa
- 4.6. Rest of Middle East & Africa
-
5. Asia Pacific
- 5.1. China
- 5.2. India
- 5.3. Japan
- 5.4. South Korea
- 5.5. ASEAN
- 5.6. Oceania
- 5.7. Rest of Asia Pacific
Cancer Minimal Residual Disease Testing Regional Market Share
Geographic Coverage of Cancer Minimal Residual Disease Testing
Cancer Minimal Residual Disease Testing REPORT HIGHLIGHTS
| Aspects | Details |
|---|---|
| Study Period | 2020-2034 |
| Base Year | 2025 |
| Estimated Year | 2026 |
| Forecast Period | 2026-2034 |
| Historical Period | 2020-2025 |
| Growth Rate | CAGR of 7% from 2020-2034 |
| Segmentation |
|
Table of Contents
- 1. Introduction
- 1.1. Research Scope
- 1.2. Market Segmentation
- 1.3. Research Methodology
- 1.4. Definitions and Assumptions
- 2. Executive Summary
- 2.1. Introduction
- 3. Market Dynamics
- 3.1. Introduction
- 3.2. Market Drivers
- 3.3. Market Restrains
- 3.4. Market Trends
- 4. Market Factor Analysis
- 4.1. Porters Five Forces
- 4.2. Supply/Value Chain
- 4.3. PESTEL analysis
- 4.4. Market Entropy
- 4.5. Patent/Trademark Analysis
- 5. Global Cancer Minimal Residual Disease Testing Analysis, Insights and Forecast, 2020-2032
- 5.1. Market Analysis, Insights and Forecast - by Application
- 5.1.1. Hematological Malignancies
- 5.1.2. Leukemia
- 5.1.3. Lymphoma
- 5.1.4. Solid Tumors
- 5.1.5. Other
- 5.2. Market Analysis, Insights and Forecast - by Type
- 5.2.1. Flow Cytometry
- 5.2.2. Polymerase Chain Reaction (PCR)
- 5.2.3. Next-Generation Sequencing (NGS)
- 5.2.4. Other
- 5.3. Market Analysis, Insights and Forecast - by Region
- 5.3.1. North America
- 5.3.2. South America
- 5.3.3. Europe
- 5.3.4. Middle East & Africa
- 5.3.5. Asia Pacific
- 5.1. Market Analysis, Insights and Forecast - by Application
- 6. North America Cancer Minimal Residual Disease Testing Analysis, Insights and Forecast, 2020-2032
- 6.1. Market Analysis, Insights and Forecast - by Application
- 6.1.1. Hematological Malignancies
- 6.1.2. Leukemia
- 6.1.3. Lymphoma
- 6.1.4. Solid Tumors
- 6.1.5. Other
- 6.2. Market Analysis, Insights and Forecast - by Type
- 6.2.1. Flow Cytometry
- 6.2.2. Polymerase Chain Reaction (PCR)
- 6.2.3. Next-Generation Sequencing (NGS)
- 6.2.4. Other
- 6.1. Market Analysis, Insights and Forecast - by Application
- 7. South America Cancer Minimal Residual Disease Testing Analysis, Insights and Forecast, 2020-2032
- 7.1. Market Analysis, Insights and Forecast - by Application
- 7.1.1. Hematological Malignancies
- 7.1.2. Leukemia
- 7.1.3. Lymphoma
- 7.1.4. Solid Tumors
- 7.1.5. Other
- 7.2. Market Analysis, Insights and Forecast - by Type
- 7.2.1. Flow Cytometry
- 7.2.2. Polymerase Chain Reaction (PCR)
- 7.2.3. Next-Generation Sequencing (NGS)
- 7.2.4. Other
- 7.1. Market Analysis, Insights and Forecast - by Application
- 8. Europe Cancer Minimal Residual Disease Testing Analysis, Insights and Forecast, 2020-2032
- 8.1. Market Analysis, Insights and Forecast - by Application
- 8.1.1. Hematological Malignancies
- 8.1.2. Leukemia
- 8.1.3. Lymphoma
- 8.1.4. Solid Tumors
- 8.1.5. Other
- 8.2. Market Analysis, Insights and Forecast - by Type
- 8.2.1. Flow Cytometry
- 8.2.2. Polymerase Chain Reaction (PCR)
- 8.2.3. Next-Generation Sequencing (NGS)
- 8.2.4. Other
- 8.1. Market Analysis, Insights and Forecast - by Application
- 9. Middle East & Africa Cancer Minimal Residual Disease Testing Analysis, Insights and Forecast, 2020-2032
- 9.1. Market Analysis, Insights and Forecast - by Application
- 9.1.1. Hematological Malignancies
- 9.1.2. Leukemia
- 9.1.3. Lymphoma
- 9.1.4. Solid Tumors
- 9.1.5. Other
- 9.2. Market Analysis, Insights and Forecast - by Type
- 9.2.1. Flow Cytometry
- 9.2.2. Polymerase Chain Reaction (PCR)
- 9.2.3. Next-Generation Sequencing (NGS)
- 9.2.4. Other
- 9.1. Market Analysis, Insights and Forecast - by Application
- 10. Asia Pacific Cancer Minimal Residual Disease Testing Analysis, Insights and Forecast, 2020-2032
- 10.1. Market Analysis, Insights and Forecast - by Application
- 10.1.1. Hematological Malignancies
- 10.1.2. Leukemia
- 10.1.3. Lymphoma
- 10.1.4. Solid Tumors
- 10.1.5. Other
- 10.2. Market Analysis, Insights and Forecast - by Type
- 10.2.1. Flow Cytometry
- 10.2.2. Polymerase Chain Reaction (PCR)
- 10.2.3. Next-Generation Sequencing (NGS)
- 10.2.4. Other
- 10.1. Market Analysis, Insights and Forecast - by Application
- 11. Competitive Analysis
- 11.1. Global Market Share Analysis 2025
- 11.2. Company Profiles
- 11.2.1 Adaptive Biotechnologies Corporation
- 11.2.1.1. Overview
- 11.2.1.2. Products
- 11.2.1.3. SWOT Analysis
- 11.2.1.4. Recent Developments
- 11.2.1.5. Financials (Based on Availability)
- 11.2.2 ArcherDX Inc. (Invitae Corporation)
- 11.2.2.1. Overview
- 11.2.2.2. Products
- 11.2.2.3. SWOT Analysis
- 11.2.2.4. Recent Developments
- 11.2.2.5. Financials (Based on Availability)
- 11.2.3 Asuragen
- 11.2.3.1. Overview
- 11.2.3.2. Products
- 11.2.3.3. SWOT Analysis
- 11.2.3.4. Recent Developments
- 11.2.3.5. Financials (Based on Availability)
- 11.2.4 Arup Laboratories
- 11.2.4.1. Overview
- 11.2.4.2. Products
- 11.2.4.3. SWOT Analysis
- 11.2.4.4. Recent Developments
- 11.2.4.5. Financials (Based on Availability)
- 11.2.5 Bio-Rad Laboratories
- 11.2.5.1. Overview
- 11.2.5.2. Products
- 11.2.5.3. SWOT Analysis
- 11.2.5.4. Recent Developments
- 11.2.5.5. Financials (Based on Availability)
- 11.2.6 Cergentis B.V.
- 11.2.6.1. Overview
- 11.2.6.2. Products
- 11.2.6.3. SWOT Analysis
- 11.2.6.4. Recent Developments
- 11.2.6.5. Financials (Based on Availability)
- 11.2.7 F. Hoffmann- La Roche Ltd
- 11.2.7.1. Overview
- 11.2.7.2. Products
- 11.2.7.3. SWOT Analysis
- 11.2.7.4. Recent Developments
- 11.2.7.5. Financials (Based on Availability)
- 11.2.8 Guardant Health
- 11.2.8.1. Overview
- 11.2.8.2. Products
- 11.2.8.3. SWOT Analysis
- 11.2.8.4. Recent Developments
- 11.2.8.5. Financials (Based on Availability)
- 11.2.9 ICON plc
- 11.2.9.1. Overview
- 11.2.9.2. Products
- 11.2.9.3. SWOT Analysis
- 11.2.9.4. Recent Developments
- 11.2.9.5. Financials (Based on Availability)
- 11.2.10 Invivoscribe
- 11.2.10.1. Overview
- 11.2.10.2. Products
- 11.2.10.3. SWOT Analysis
- 11.2.10.4. Recent Developments
- 11.2.10.5. Financials (Based on Availability)
- 11.2.11 Laboratory Corporation of America Holdings
- 11.2.11.1. Overview
- 11.2.11.2. Products
- 11.2.11.3. SWOT Analysis
- 11.2.11.4. Recent Developments
- 11.2.11.5. Financials (Based on Availability)
- 11.2.12 Mission Bio
- 11.2.12.1. Overview
- 11.2.12.2. Products
- 11.2.12.3. SWOT Analysis
- 11.2.12.4. Recent Developments
- 11.2.12.5. Financials (Based on Availability)
- 11.2.13 Natera Inc.
- 11.2.13.1. Overview
- 11.2.13.2. Products
- 11.2.13.3. SWOT Analysis
- 11.2.13.4. Recent Developments
- 11.2.13.5. Financials (Based on Availability)
- 11.2.14 NeoGenomics Laboratories
- 11.2.14.1. Overview
- 11.2.14.2. Products
- 11.2.14.3. SWOT Analysis
- 11.2.14.4. Recent Developments
- 11.2.14.5. Financials (Based on Availability)
- 11.2.15 Opko Health
- 11.2.15.1. Overview
- 11.2.15.2. Products
- 11.2.15.3. SWOT Analysis
- 11.2.15.4. Recent Developments
- 11.2.15.5. Financials (Based on Availability)
- 11.2.16 Quest Diagnostics Incorporated
- 11.2.16.1. Overview
- 11.2.16.2. Products
- 11.2.16.3. SWOT Analysis
- 11.2.16.4. Recent Developments
- 11.2.16.5. Financials (Based on Availability)
- 11.2.17 Sysmex Corporation
- 11.2.17.1. Overview
- 11.2.17.2. Products
- 11.2.17.3. SWOT Analysis
- 11.2.17.4. Recent Developments
- 11.2.17.5. Financials (Based on Availability)
- 11.2.18 Genetron Health
- 11.2.18.1. Overview
- 11.2.18.2. Products
- 11.2.18.3. SWOT Analysis
- 11.2.18.4. Recent Developments
- 11.2.18.5. Financials (Based on Availability)
- 11.2.1 Adaptive Biotechnologies Corporation
List of Figures
- Figure 1: Global Cancer Minimal Residual Disease Testing Revenue Breakdown (million, %) by Region 2025 & 2033
- Figure 2: Global Cancer Minimal Residual Disease Testing Volume Breakdown (K, %) by Region 2025 & 2033
- Figure 3: North America Cancer Minimal Residual Disease Testing Revenue (million), by Application 2025 & 2033
- Figure 4: North America Cancer Minimal Residual Disease Testing Volume (K), by Application 2025 & 2033
- Figure 5: North America Cancer Minimal Residual Disease Testing Revenue Share (%), by Application 2025 & 2033
- Figure 6: North America Cancer Minimal Residual Disease Testing Volume Share (%), by Application 2025 & 2033
- Figure 7: North America Cancer Minimal Residual Disease Testing Revenue (million), by Type 2025 & 2033
- Figure 8: North America Cancer Minimal Residual Disease Testing Volume (K), by Type 2025 & 2033
- Figure 9: North America Cancer Minimal Residual Disease Testing Revenue Share (%), by Type 2025 & 2033
- Figure 10: North America Cancer Minimal Residual Disease Testing Volume Share (%), by Type 2025 & 2033
- Figure 11: North America Cancer Minimal Residual Disease Testing Revenue (million), by Country 2025 & 2033
- Figure 12: North America Cancer Minimal Residual Disease Testing Volume (K), by Country 2025 & 2033
- Figure 13: North America Cancer Minimal Residual Disease Testing Revenue Share (%), by Country 2025 & 2033
- Figure 14: North America Cancer Minimal Residual Disease Testing Volume Share (%), by Country 2025 & 2033
- Figure 15: South America Cancer Minimal Residual Disease Testing Revenue (million), by Application 2025 & 2033
- Figure 16: South America Cancer Minimal Residual Disease Testing Volume (K), by Application 2025 & 2033
- Figure 17: South America Cancer Minimal Residual Disease Testing Revenue Share (%), by Application 2025 & 2033
- Figure 18: South America Cancer Minimal Residual Disease Testing Volume Share (%), by Application 2025 & 2033
- Figure 19: South America Cancer Minimal Residual Disease Testing Revenue (million), by Type 2025 & 2033
- Figure 20: South America Cancer Minimal Residual Disease Testing Volume (K), by Type 2025 & 2033
- Figure 21: South America Cancer Minimal Residual Disease Testing Revenue Share (%), by Type 2025 & 2033
- Figure 22: South America Cancer Minimal Residual Disease Testing Volume Share (%), by Type 2025 & 2033
- Figure 23: South America Cancer Minimal Residual Disease Testing Revenue (million), by Country 2025 & 2033
- Figure 24: South America Cancer Minimal Residual Disease Testing Volume (K), by Country 2025 & 2033
- Figure 25: South America Cancer Minimal Residual Disease Testing Revenue Share (%), by Country 2025 & 2033
- Figure 26: South America Cancer Minimal Residual Disease Testing Volume Share (%), by Country 2025 & 2033
- Figure 27: Europe Cancer Minimal Residual Disease Testing Revenue (million), by Application 2025 & 2033
- Figure 28: Europe Cancer Minimal Residual Disease Testing Volume (K), by Application 2025 & 2033
- Figure 29: Europe Cancer Minimal Residual Disease Testing Revenue Share (%), by Application 2025 & 2033
- Figure 30: Europe Cancer Minimal Residual Disease Testing Volume Share (%), by Application 2025 & 2033
- Figure 31: Europe Cancer Minimal Residual Disease Testing Revenue (million), by Type 2025 & 2033
- Figure 32: Europe Cancer Minimal Residual Disease Testing Volume (K), by Type 2025 & 2033
- Figure 33: Europe Cancer Minimal Residual Disease Testing Revenue Share (%), by Type 2025 & 2033
- Figure 34: Europe Cancer Minimal Residual Disease Testing Volume Share (%), by Type 2025 & 2033
- Figure 35: Europe Cancer Minimal Residual Disease Testing Revenue (million), by Country 2025 & 2033
- Figure 36: Europe Cancer Minimal Residual Disease Testing Volume (K), by Country 2025 & 2033
- Figure 37: Europe Cancer Minimal Residual Disease Testing Revenue Share (%), by Country 2025 & 2033
- Figure 38: Europe Cancer Minimal Residual Disease Testing Volume Share (%), by Country 2025 & 2033
- Figure 39: Middle East & Africa Cancer Minimal Residual Disease Testing Revenue (million), by Application 2025 & 2033
- Figure 40: Middle East & Africa Cancer Minimal Residual Disease Testing Volume (K), by Application 2025 & 2033
- Figure 41: Middle East & Africa Cancer Minimal Residual Disease Testing Revenue Share (%), by Application 2025 & 2033
- Figure 42: Middle East & Africa Cancer Minimal Residual Disease Testing Volume Share (%), by Application 2025 & 2033
- Figure 43: Middle East & Africa Cancer Minimal Residual Disease Testing Revenue (million), by Type 2025 & 2033
- Figure 44: Middle East & Africa Cancer Minimal Residual Disease Testing Volume (K), by Type 2025 & 2033
- Figure 45: Middle East & Africa Cancer Minimal Residual Disease Testing Revenue Share (%), by Type 2025 & 2033
- Figure 46: Middle East & Africa Cancer Minimal Residual Disease Testing Volume Share (%), by Type 2025 & 2033
- Figure 47: Middle East & Africa Cancer Minimal Residual Disease Testing Revenue (million), by Country 2025 & 2033
- Figure 48: Middle East & Africa Cancer Minimal Residual Disease Testing Volume (K), by Country 2025 & 2033
- Figure 49: Middle East & Africa Cancer Minimal Residual Disease Testing Revenue Share (%), by Country 2025 & 2033
- Figure 50: Middle East & Africa Cancer Minimal Residual Disease Testing Volume Share (%), by Country 2025 & 2033
- Figure 51: Asia Pacific Cancer Minimal Residual Disease Testing Revenue (million), by Application 2025 & 2033
- Figure 52: Asia Pacific Cancer Minimal Residual Disease Testing Volume (K), by Application 2025 & 2033
- Figure 53: Asia Pacific Cancer Minimal Residual Disease Testing Revenue Share (%), by Application 2025 & 2033
- Figure 54: Asia Pacific Cancer Minimal Residual Disease Testing Volume Share (%), by Application 2025 & 2033
- Figure 55: Asia Pacific Cancer Minimal Residual Disease Testing Revenue (million), by Type 2025 & 2033
- Figure 56: Asia Pacific Cancer Minimal Residual Disease Testing Volume (K), by Type 2025 & 2033
- Figure 57: Asia Pacific Cancer Minimal Residual Disease Testing Revenue Share (%), by Type 2025 & 2033
- Figure 58: Asia Pacific Cancer Minimal Residual Disease Testing Volume Share (%), by Type 2025 & 2033
- Figure 59: Asia Pacific Cancer Minimal Residual Disease Testing Revenue (million), by Country 2025 & 2033
- Figure 60: Asia Pacific Cancer Minimal Residual Disease Testing Volume (K), by Country 2025 & 2033
- Figure 61: Asia Pacific Cancer Minimal Residual Disease Testing Revenue Share (%), by Country 2025 & 2033
- Figure 62: Asia Pacific Cancer Minimal Residual Disease Testing Volume Share (%), by Country 2025 & 2033
List of Tables
- Table 1: Global Cancer Minimal Residual Disease Testing Revenue million Forecast, by Application 2020 & 2033
- Table 2: Global Cancer Minimal Residual Disease Testing Volume K Forecast, by Application 2020 & 2033
- Table 3: Global Cancer Minimal Residual Disease Testing Revenue million Forecast, by Type 2020 & 2033
- Table 4: Global Cancer Minimal Residual Disease Testing Volume K Forecast, by Type 2020 & 2033
- Table 5: Global Cancer Minimal Residual Disease Testing Revenue million Forecast, by Region 2020 & 2033
- Table 6: Global Cancer Minimal Residual Disease Testing Volume K Forecast, by Region 2020 & 2033
- Table 7: Global Cancer Minimal Residual Disease Testing Revenue million Forecast, by Application 2020 & 2033
- Table 8: Global Cancer Minimal Residual Disease Testing Volume K Forecast, by Application 2020 & 2033
- Table 9: Global Cancer Minimal Residual Disease Testing Revenue million Forecast, by Type 2020 & 2033
- Table 10: Global Cancer Minimal Residual Disease Testing Volume K Forecast, by Type 2020 & 2033
- Table 11: Global Cancer Minimal Residual Disease Testing Revenue million Forecast, by Country 2020 & 2033
- Table 12: Global Cancer Minimal Residual Disease Testing Volume K Forecast, by Country 2020 & 2033
- Table 13: United States Cancer Minimal Residual Disease Testing Revenue (million) Forecast, by Application 2020 & 2033
- Table 14: United States Cancer Minimal Residual Disease Testing Volume (K) Forecast, by Application 2020 & 2033
- Table 15: Canada Cancer Minimal Residual Disease Testing Revenue (million) Forecast, by Application 2020 & 2033
- Table 16: Canada Cancer Minimal Residual Disease Testing Volume (K) Forecast, by Application 2020 & 2033
- Table 17: Mexico Cancer Minimal Residual Disease Testing Revenue (million) Forecast, by Application 2020 & 2033
- Table 18: Mexico Cancer Minimal Residual Disease Testing Volume (K) Forecast, by Application 2020 & 2033
- Table 19: Global Cancer Minimal Residual Disease Testing Revenue million Forecast, by Application 2020 & 2033
- Table 20: Global Cancer Minimal Residual Disease Testing Volume K Forecast, by Application 2020 & 2033
- Table 21: Global Cancer Minimal Residual Disease Testing Revenue million Forecast, by Type 2020 & 2033
- Table 22: Global Cancer Minimal Residual Disease Testing Volume K Forecast, by Type 2020 & 2033
- Table 23: Global Cancer Minimal Residual Disease Testing Revenue million Forecast, by Country 2020 & 2033
- Table 24: Global Cancer Minimal Residual Disease Testing Volume K Forecast, by Country 2020 & 2033
- Table 25: Brazil Cancer Minimal Residual Disease Testing Revenue (million) Forecast, by Application 2020 & 2033
- Table 26: Brazil Cancer Minimal Residual Disease Testing Volume (K) Forecast, by Application 2020 & 2033
- Table 27: Argentina Cancer Minimal Residual Disease Testing Revenue (million) Forecast, by Application 2020 & 2033
- Table 28: Argentina Cancer Minimal Residual Disease Testing Volume (K) Forecast, by Application 2020 & 2033
- Table 29: Rest of South America Cancer Minimal Residual Disease Testing Revenue (million) Forecast, by Application 2020 & 2033
- Table 30: Rest of South America Cancer Minimal Residual Disease Testing Volume (K) Forecast, by Application 2020 & 2033
- Table 31: Global Cancer Minimal Residual Disease Testing Revenue million Forecast, by Application 2020 & 2033
- Table 32: Global Cancer Minimal Residual Disease Testing Volume K Forecast, by Application 2020 & 2033
- Table 33: Global Cancer Minimal Residual Disease Testing Revenue million Forecast, by Type 2020 & 2033
- Table 34: Global Cancer Minimal Residual Disease Testing Volume K Forecast, by Type 2020 & 2033
- Table 35: Global Cancer Minimal Residual Disease Testing Revenue million Forecast, by Country 2020 & 2033
- Table 36: Global Cancer Minimal Residual Disease Testing Volume K Forecast, by Country 2020 & 2033
- Table 37: United Kingdom Cancer Minimal Residual Disease Testing Revenue (million) Forecast, by Application 2020 & 2033
- Table 38: United Kingdom Cancer Minimal Residual Disease Testing Volume (K) Forecast, by Application 2020 & 2033
- Table 39: Germany Cancer Minimal Residual Disease Testing Revenue (million) Forecast, by Application 2020 & 2033
- Table 40: Germany Cancer Minimal Residual Disease Testing Volume (K) Forecast, by Application 2020 & 2033
- Table 41: France Cancer Minimal Residual Disease Testing Revenue (million) Forecast, by Application 2020 & 2033
- Table 42: France Cancer Minimal Residual Disease Testing Volume (K) Forecast, by Application 2020 & 2033
- Table 43: Italy Cancer Minimal Residual Disease Testing Revenue (million) Forecast, by Application 2020 & 2033
- Table 44: Italy Cancer Minimal Residual Disease Testing Volume (K) Forecast, by Application 2020 & 2033
- Table 45: Spain Cancer Minimal Residual Disease Testing Revenue (million) Forecast, by Application 2020 & 2033
- Table 46: Spain Cancer Minimal Residual Disease Testing Volume (K) Forecast, by Application 2020 & 2033
- Table 47: Russia Cancer Minimal Residual Disease Testing Revenue (million) Forecast, by Application 2020 & 2033
- Table 48: Russia Cancer Minimal Residual Disease Testing Volume (K) Forecast, by Application 2020 & 2033
- Table 49: Benelux Cancer Minimal Residual Disease Testing Revenue (million) Forecast, by Application 2020 & 2033
- Table 50: Benelux Cancer Minimal Residual Disease Testing Volume (K) Forecast, by Application 2020 & 2033
- Table 51: Nordics Cancer Minimal Residual Disease Testing Revenue (million) Forecast, by Application 2020 & 2033
- Table 52: Nordics Cancer Minimal Residual Disease Testing Volume (K) Forecast, by Application 2020 & 2033
- Table 53: Rest of Europe Cancer Minimal Residual Disease Testing Revenue (million) Forecast, by Application 2020 & 2033
- Table 54: Rest of Europe Cancer Minimal Residual Disease Testing Volume (K) Forecast, by Application 2020 & 2033
- Table 55: Global Cancer Minimal Residual Disease Testing Revenue million Forecast, by Application 2020 & 2033
- Table 56: Global Cancer Minimal Residual Disease Testing Volume K Forecast, by Application 2020 & 2033
- Table 57: Global Cancer Minimal Residual Disease Testing Revenue million Forecast, by Type 2020 & 2033
- Table 58: Global Cancer Minimal Residual Disease Testing Volume K Forecast, by Type 2020 & 2033
- Table 59: Global Cancer Minimal Residual Disease Testing Revenue million Forecast, by Country 2020 & 2033
- Table 60: Global Cancer Minimal Residual Disease Testing Volume K Forecast, by Country 2020 & 2033
- Table 61: Turkey Cancer Minimal Residual Disease Testing Revenue (million) Forecast, by Application 2020 & 2033
- Table 62: Turkey Cancer Minimal Residual Disease Testing Volume (K) Forecast, by Application 2020 & 2033
- Table 63: Israel Cancer Minimal Residual Disease Testing Revenue (million) Forecast, by Application 2020 & 2033
- Table 64: Israel Cancer Minimal Residual Disease Testing Volume (K) Forecast, by Application 2020 & 2033
- Table 65: GCC Cancer Minimal Residual Disease Testing Revenue (million) Forecast, by Application 2020 & 2033
- Table 66: GCC Cancer Minimal Residual Disease Testing Volume (K) Forecast, by Application 2020 & 2033
- Table 67: North Africa Cancer Minimal Residual Disease Testing Revenue (million) Forecast, by Application 2020 & 2033
- Table 68: North Africa Cancer Minimal Residual Disease Testing Volume (K) Forecast, by Application 2020 & 2033
- Table 69: South Africa Cancer Minimal Residual Disease Testing Revenue (million) Forecast, by Application 2020 & 2033
- Table 70: South Africa Cancer Minimal Residual Disease Testing Volume (K) Forecast, by Application 2020 & 2033
- Table 71: Rest of Middle East & Africa Cancer Minimal Residual Disease Testing Revenue (million) Forecast, by Application 2020 & 2033
- Table 72: Rest of Middle East & Africa Cancer Minimal Residual Disease Testing Volume (K) Forecast, by Application 2020 & 2033
- Table 73: Global Cancer Minimal Residual Disease Testing Revenue million Forecast, by Application 2020 & 2033
- Table 74: Global Cancer Minimal Residual Disease Testing Volume K Forecast, by Application 2020 & 2033
- Table 75: Global Cancer Minimal Residual Disease Testing Revenue million Forecast, by Type 2020 & 2033
- Table 76: Global Cancer Minimal Residual Disease Testing Volume K Forecast, by Type 2020 & 2033
- Table 77: Global Cancer Minimal Residual Disease Testing Revenue million Forecast, by Country 2020 & 2033
- Table 78: Global Cancer Minimal Residual Disease Testing Volume K Forecast, by Country 2020 & 2033
- Table 79: China Cancer Minimal Residual Disease Testing Revenue (million) Forecast, by Application 2020 & 2033
- Table 80: China Cancer Minimal Residual Disease Testing Volume (K) Forecast, by Application 2020 & 2033
- Table 81: India Cancer Minimal Residual Disease Testing Revenue (million) Forecast, by Application 2020 & 2033
- Table 82: India Cancer Minimal Residual Disease Testing Volume (K) Forecast, by Application 2020 & 2033
- Table 83: Japan Cancer Minimal Residual Disease Testing Revenue (million) Forecast, by Application 2020 & 2033
- Table 84: Japan Cancer Minimal Residual Disease Testing Volume (K) Forecast, by Application 2020 & 2033
- Table 85: South Korea Cancer Minimal Residual Disease Testing Revenue (million) Forecast, by Application 2020 & 2033
- Table 86: South Korea Cancer Minimal Residual Disease Testing Volume (K) Forecast, by Application 2020 & 2033
- Table 87: ASEAN Cancer Minimal Residual Disease Testing Revenue (million) Forecast, by Application 2020 & 2033
- Table 88: ASEAN Cancer Minimal Residual Disease Testing Volume (K) Forecast, by Application 2020 & 2033
- Table 89: Oceania Cancer Minimal Residual Disease Testing Revenue (million) Forecast, by Application 2020 & 2033
- Table 90: Oceania Cancer Minimal Residual Disease Testing Volume (K) Forecast, by Application 2020 & 2033
- Table 91: Rest of Asia Pacific Cancer Minimal Residual Disease Testing Revenue (million) Forecast, by Application 2020 & 2033
- Table 92: Rest of Asia Pacific Cancer Minimal Residual Disease Testing Volume (K) Forecast, by Application 2020 & 2033
Frequently Asked Questions
1. What is the projected Compound Annual Growth Rate (CAGR) of the Cancer Minimal Residual Disease Testing?
The projected CAGR is approximately 7%.
2. Which companies are prominent players in the Cancer Minimal Residual Disease Testing?
Key companies in the market include Adaptive Biotechnologies Corporation, ArcherDX, Inc. (Invitae Corporation), Asuragen, Arup Laboratories, Bio-Rad Laboratories, Cergentis B.V., F. Hoffmann- La Roche Ltd, Guardant Health, ICON plc, Invivoscribe, Laboratory Corporation of America Holdings, Mission Bio, Natera, Inc., NeoGenomics Laboratories, Opko Health, Quest Diagnostics Incorporated, Sysmex Corporation, Genetron Health.
3. What are the main segments of the Cancer Minimal Residual Disease Testing?
The market segments include Application, Type.
4. Can you provide details about the market size?
The market size is estimated to be USD 1759 million as of 2022.
5. What are some drivers contributing to market growth?
N/A
6. What are the notable trends driving market growth?
N/A
7. Are there any restraints impacting market growth?
N/A
8. Can you provide examples of recent developments in the market?
N/A
9. What pricing options are available for accessing the report?
Pricing options include single-user, multi-user, and enterprise licenses priced at USD 3950.00, USD 5925.00, and USD 7900.00 respectively.
10. Is the market size provided in terms of value or volume?
The market size is provided in terms of value, measured in million and volume, measured in K.
11. Are there any specific market keywords associated with the report?
Yes, the market keyword associated with the report is "Cancer Minimal Residual Disease Testing," which aids in identifying and referencing the specific market segment covered.
12. How do I determine which pricing option suits my needs best?
The pricing options vary based on user requirements and access needs. Individual users may opt for single-user licenses, while businesses requiring broader access may choose multi-user or enterprise licenses for cost-effective access to the report.
13. Are there any additional resources or data provided in the Cancer Minimal Residual Disease Testing report?
While the report offers comprehensive insights, it's advisable to review the specific contents or supplementary materials provided to ascertain if additional resources or data are available.
14. How can I stay updated on further developments or reports in the Cancer Minimal Residual Disease Testing?
To stay informed about further developments, trends, and reports in the Cancer Minimal Residual Disease Testing, consider subscribing to industry newsletters, following relevant companies and organizations, or regularly checking reputable industry news sources and publications.
Methodology
Step 1 - Identification of Relevant Samples Size from Population Database


Step 2 - Approaches for Defining Global Market Size (Value, Volume* & Price*)

Note*: In applicable scenarios
Step 3 - Data Sources
Primary Research
- Web Analytics
- Survey Reports
- Research Institute
- Latest Research Reports
- Opinion Leaders
Secondary Research
- Annual Reports
- White Paper
- Latest Press Release
- Industry Association
- Paid Database
- Investor Presentations

Step 4 - Data Triangulation
Involves using different sources of information in order to increase the validity of a study
These sources are likely to be stakeholders in a program - participants, other researchers, program staff, other community members, and so on.
Then we put all data in single framework & apply various statistical tools to find out the dynamic on the market.
During the analysis stage, feedback from the stakeholder groups would be compared to determine areas of agreement as well as areas of divergence