

Key Insights
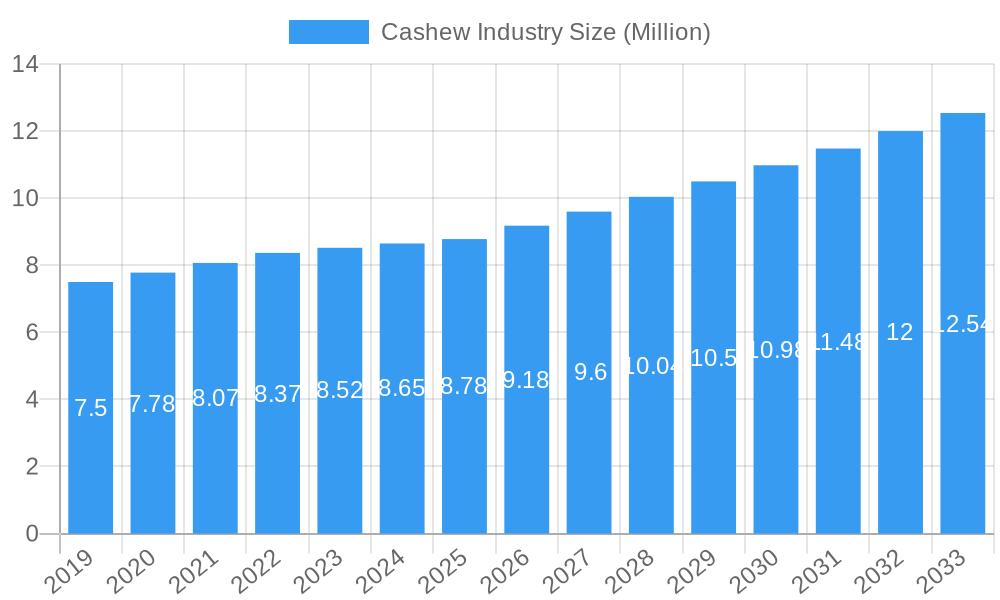
The global cashew industry, valued at $7.82 billion in 2025, is projected to experience steady growth, with a compound annual growth rate (CAGR) of 3.31% from 2025 to 2033. This growth is fueled by several key factors. Increasing consumer demand for healthy snacks and the versatility of cashews in various food applications, including snacks, beverages, processed foods, dairy alternatives, and meat substitutes, are significant drivers. The rising popularity of plant-based diets and the growing awareness of the nutritional benefits of cashews further contribute to market expansion. Different processing methods (raw, roasted, salted, flavored) and forms (wholes, pieces) cater to diverse consumer preferences, driving market segmentation. Geographic expansion, particularly in rapidly developing economies in Asia-Pacific, also plays a crucial role in market growth. However, price fluctuations in raw cashew materials and potential supply chain disruptions due to weather patterns or geopolitical factors pose challenges to the industry's consistent growth. Competition among major players like Sunmark Food Ingredients, Royal Nuts, Dole Food Company, Olam International, and Cashew Nut Processing Factory is intense, pushing innovation in product offerings and processing techniques.
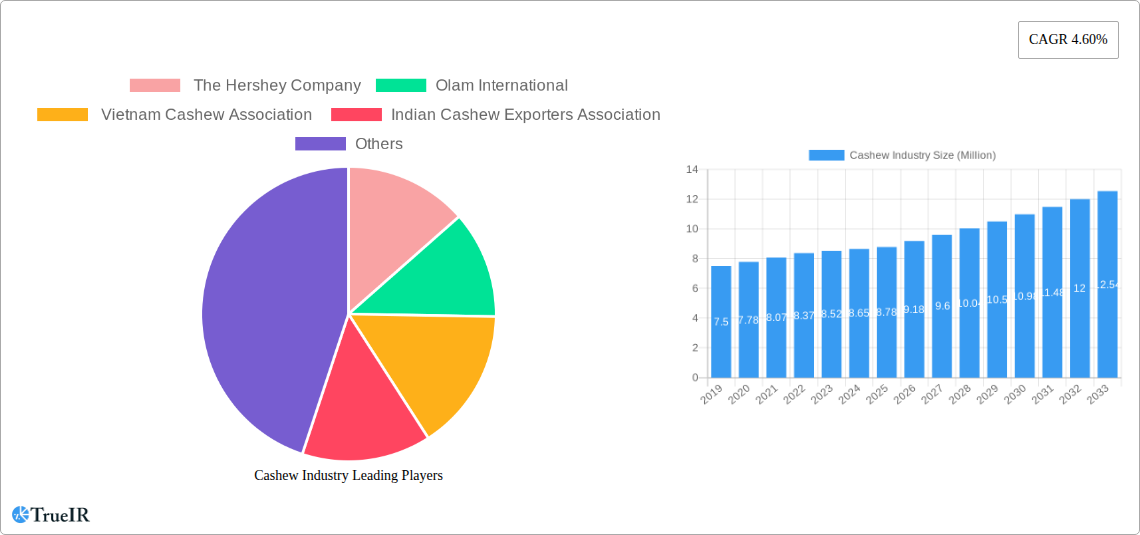
Cashew Industry Market Size (In Billion)
The industry's segmentation by grade (White Wholes, Scorched Wholes, Dessert Wholes, White Pieces, Scorched Pieces, Dessert Pieces), type, and application reflects its adaptability and potential for diversification. Future growth will likely be influenced by sustainable sourcing practices, increased focus on organic and fair-trade cashews, and product innovations catering to specific dietary needs and preferences. Further research into the nutritional properties and potential health benefits of cashews could drive even greater market expansion. Regional variations in consumption patterns will also shape market dynamics. North America and Europe are expected to remain key markets, but the Asia-Pacific region holds considerable potential for future growth due to its expanding middle class and rising disposable incomes. The industry's ongoing commitment to quality control, efficient supply chains, and responsible sourcing will be crucial in navigating future challenges and sustaining its upward trajectory.
Cashew Industry Company Market Share
Cashew Industry Market Report: 2019-2033
This comprehensive report provides a detailed analysis of the global cashew industry, covering market structure, trends, opportunities, and challenges from 2019 to 2033. With a focus on key players like Sunmark Food Ingredients, Royal Nuts, Dole Food Company, Olam International, and Cashew Nut Processing Factory, this report is an essential resource for industry professionals, investors, and anyone seeking to understand this dynamic market. The report leverages extensive data and insights to forecast future growth, offering invaluable strategic guidance for navigating the complexities of the cashew market. The study period covers 2019-2033, with 2025 as the base and estimated year.
Cashew Industry Market Structure & Competitive Landscape
The global cashew industry presents a moderately concentrated market structure, dominated by a few large multinational corporations alongside a multitude of smaller, regional players. While precise concentration ratios are unavailable publicly, the market demonstrates opportunities for both significant consolidation and substantial expansion. Innovation within the industry is primarily driven by advancements in processing technologies, the creation of novel product formats (including flavored cashews, cashew milk, cashew cheeses, and other cashew-derived ingredients), and a growing emphasis on sustainable and ethical sourcing practices. Market dynamics are heavily influenced by regulatory factors, encompassing stringent food safety regulations and evolving international trade policies. Competitive pressures arise from substitute products, such as other nuts and seeds, particularly within price-sensitive consumer markets. Furthermore, the increasing popularity of alternative plant-based protein sources contributes to competitive intensity.
End-user segmentation is highly diverse, encompassing the snack food, beverage, processed food, dairy alternative, and meat alternative sectors. A detailed market share breakdown for each segment, along with growth projections based on current consumer trends and emerging applications, is available in the full report. Mergers and acquisitions (M&A) activity has shown moderate growth in recent years, with a notable increase in major deals between 2019 and 2024. This activity underscores the strategic efforts of major players to expand market share, geographic reach, and product diversification. The strategic focus of many companies is on vertical integration to ensure control over the supply chain, from cultivation to processing and distribution.
Cashew Industry Market Trends & Opportunities
The global cashew market is experiencing robust and sustained growth, driven by escalating consumer demand, particularly in rapidly developing economies. Market valuation surpassed USD 300 billion in 2022 and is projected to reach [Insert Projected Value] by 2033, representing a Compound Annual Growth Rate (CAGR) of [Insert CAGR Percentage]%. This remarkable growth trajectory is fueled by several key factors: rising disposable incomes, a global shift toward healthier snacking options, and the burgeoning popularity of plant-based alternatives to traditional dairy and meat products. Technological advancements in processing and packaging are enhancing product quality, extending shelf life, and boosting overall efficiency while concurrently reducing production costs. Consumer preferences are progressively shifting toward more convenient, value-added products, such as roasted, salted, and flavored cashews, thereby stimulating innovation and diversification within product development. The market remains intensely competitive, with companies prioritizing brand building, product differentiation, and the optimization of their supply chains to achieve a competitive advantage. Significant variations exist in market penetration rates across different regions and segments, presenting substantial opportunities for expansion in underserved markets, particularly in Africa and Southeast Asia.
Dominant Markets & Segments in Cashew Industry
The cashew market demonstrates regional variations in dominance. India and Vietnam remain key producers and processors, driving a substantial portion of global supply. However, several other regions are emerging as significant players, with Africa's expanding production capacity notably impacting market dynamics.
Key Growth Drivers:
- Favorable government policies: Several governments are actively supporting the cashew industry through subsidies, investment incentives, and infrastructure development.
- Technological advancements: Improved processing technologies, automation, and efficient farming practices significantly enhance productivity and product quality.
- Rising consumer demand: The expanding global middle class and shifting consumer preferences toward healthy snacks drive demand for cashews.
In terms of segments, the Roasted and Salted cashew types account for a significant market share, while Snacks represent the leading application segment. Within grades, White Wholes dominate due to their superior quality and appearance, although other grades, including Scorched Wholes and Pieces, also hold considerable market value. The demand for Dairy alternatives and Meat substitutes using cashews is growing rapidly, which opens up new opportunities for the cashew market.
Cashew Industry Product Analysis
Significant product innovation within the cashew industry centers around enhancing flavor profiles, creating convenient and sustainable packaging formats, and developing a wider range of value-added cashew-based products. This includes the expansion of cashew milk, cashew butter, cashew cheese, cashew flour, and other cashew-derived ingredients. These innovations directly address evolving consumer preferences for healthier, more convenient, and more sustainable food options, broadening the applications of cashews across various food and beverage categories. The development of cashew-based alternatives to dairy and meat products is capitalizing on the growing consumer interest in health, sustainability, and ethical sourcing. A key competitive advantage for producers and processors lies in achieving optimal product quality, maintaining supply chain efficiency, and employing effective branding and marketing strategies to connect with consumers.
Key Drivers, Barriers & Challenges in Cashew Industry
Key Drivers: Growing global demand for healthy snacks, increased consumer awareness of cashew's nutritional benefits, rising disposable incomes in emerging markets, and expansion of cashew-based products (milk, butter, etc.) are significant drivers.
Challenges and Restraints: Fluctuations in raw cashew prices, dependence on weather conditions for production, limited processing capacity in certain regions, stringent food safety and quality regulations, and increasing competition from other nut products pose significant challenges. Supply chain disruptions, particularly those related to logistics and transportation, can significantly impact market availability and pricing. Estimates suggest that supply chain issues have led to a xx% increase in cashew prices in the past year.
Growth Drivers in the Cashew Industry Market
Technological advancements in processing and farming practices, favorable government policies promoting cashew production and exports, and growing consumer preference for healthy and convenient snacks are key growth drivers. The expanding market for cashew-based products (dairy and meat alternatives) further fuels this positive trajectory.
Challenges Impacting Cashew Industry Growth
Fluctuations in raw material prices, susceptibility to climate change impacting yield, limited processing capacity in certain regions, and intense competition from substitutes present significant challenges. Regulatory hurdles and trade barriers also impact growth, along with complex supply chain dynamics that affect overall efficiency and cost.
Key Players Shaping the Cashew Industry Market
- Sunmark Food Ingredients
- Royal Nuts
- Dole Food Company
- Olam International
- Cashew Nut Processing Factory
- [Add other relevant key players]
Significant Cashew Industry Milestones
- January 2023: The Indian cashew processing industry exceeded USD 300,000 million in revenue, showing a 15% year-on-year growth.
- September 2022: Julius Berger Nigeria PLC launched a modern cashew processing plant in Lagos, boosting Nigeria's processing capacity.
- July 2022: Royal Nuts opened a USD 23 million cashew processing plant in Ivory Coast, the world's largest, with an annual capacity of 75,000 metric tons.
Future Outlook for Cashew Industry Market
The cashew industry is poised for sustained growth, driven by favorable market trends, ongoing product innovation, and expanding consumer preferences. Strategic opportunities exist in developing value-added products, optimizing supply chains, and exploring new markets. The market's potential is significant, with ample room for expansion and increased market penetration, particularly in regions with growing disposable incomes and increasing demand for healthy snacks and plant-based alternatives.
Cashew Industry Segmentation
-
1. Grade
- 1.1. White Wholes
- 1.2. Scorched Wholes
- 1.3. Dessert Wholes
- 1.4. White Pieces
- 1.5. Scorched Pieces
- 1.6. Dessert Pieces
-
2. Grade
- 2.1. White Wholes
- 2.2. Scorched Wholes
- 2.3. Dessert Wholes
- 2.4. White Pieces
- 2.5. Scorched Pieces
- 2.6. Dessert Pieces
Cashew Industry Segmentation By Geography
-
1. North America
- 1.1. United States
- 1.2. Canada
- 1.3. Mexico
-
2. Europe
- 2.1. Germany
- 2.2. United Kingdom
- 2.3. France
-
3. Asia Pacific
- 3.1. India
- 3.2. China
- 3.3. Australia
- 3.4. Vietnam
- 3.5. Philippines
- 3.6. Indonesia
-
4. South America
- 4.1. Brazil
- 4.2. Argentina
-
5. Africa
- 5.1. C
- 6. Tanzania
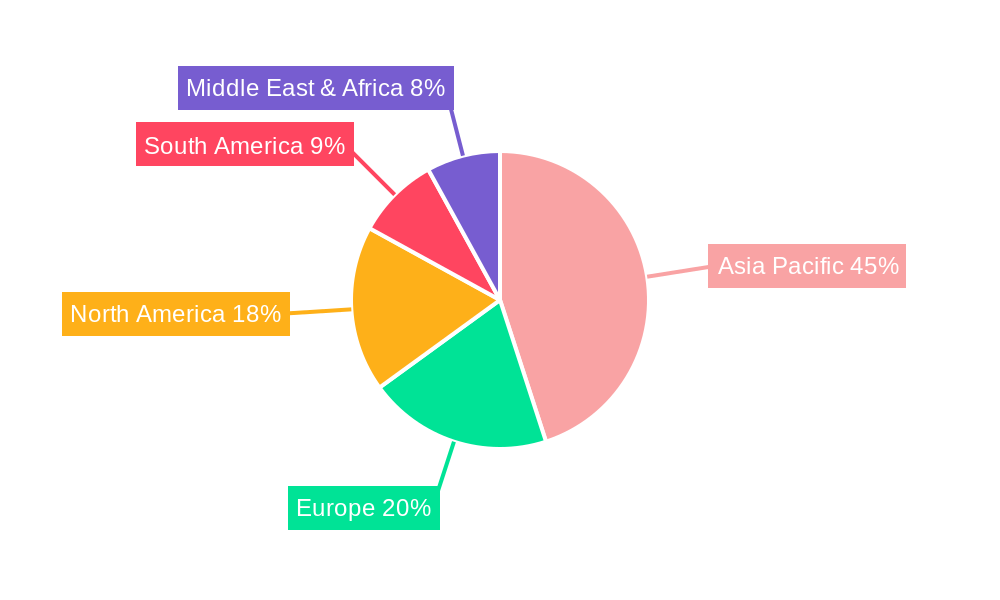
Cashew Industry Regional Market Share
Geographic Coverage of Cashew Industry
Cashew Industry REPORT HIGHLIGHTS
| Aspects | Details |
|---|---|
| Study Period | 2020-2034 |
| Base Year | 2025 |
| Estimated Year | 2026 |
| Forecast Period | 2026-2034 |
| Historical Period | 2020-2025 |
| Growth Rate | CAGR of 3.31% from 2020-2034 |
| Segmentation |
|
Table of Contents
- 1. Introduction
- 1.1. Research Scope
- 1.2. Market Segmentation
- 1.3. Research Methodology
- 1.4. Definitions and Assumptions
- 2. Executive Summary
- 2.1. Introduction
- 3. Market Dynamics
- 3.1. Introduction
- 3.2. Market Drivers
- 3.2.1. Rising Consumption of Cashew Nuts as a Healthy Snack; Increasing Government initiatives; Growing Cashew Nut Imports in The United States
- 3.3. Market Restrains
- 3.3.1. Hazardous Climatic Condition Hinders Cashew Production; Stringent Regulations Related To Food Quality Standards
- 3.4. Market Trends
- 3.4.1. Rising Consumption of Cashew Nuts as a Healthy Snack
- 4. Market Factor Analysis
- 4.1. Porters Five Forces
- 4.2. Supply/Value Chain
- 4.3. PESTEL analysis
- 4.4. Market Entropy
- 4.5. Patent/Trademark Analysis
- 5. Global Cashew Industry Analysis, Insights and Forecast, 2020-2032
- 5.1. Market Analysis, Insights and Forecast - by Grade
- 5.1.1. White Wholes
- 5.1.2. Scorched Wholes
- 5.1.3. Dessert Wholes
- 5.1.4. White Pieces
- 5.1.5. Scorched Pieces
- 5.1.6. Dessert Pieces
- 5.2. Market Analysis, Insights and Forecast - by Grade
- 5.2.1. White Wholes
- 5.2.2. Scorched Wholes
- 5.2.3. Dessert Wholes
- 5.2.4. White Pieces
- 5.2.5. Scorched Pieces
- 5.2.6. Dessert Pieces
- 5.3. Market Analysis, Insights and Forecast - by Region
- 5.3.1. North America
- 5.3.2. Europe
- 5.3.3. Asia Pacific
- 5.3.4. South America
- 5.3.5. Africa
- 5.3.6. Tanzania
- 5.1. Market Analysis, Insights and Forecast - by Grade
- 6. North America Cashew Industry Analysis, Insights and Forecast, 2020-2032
- 6.1. Market Analysis, Insights and Forecast - by Grade
- 6.1.1. White Wholes
- 6.1.2. Scorched Wholes
- 6.1.3. Dessert Wholes
- 6.1.4. White Pieces
- 6.1.5. Scorched Pieces
- 6.1.6. Dessert Pieces
- 6.2. Market Analysis, Insights and Forecast - by Grade
- 6.2.1. White Wholes
- 6.2.2. Scorched Wholes
- 6.2.3. Dessert Wholes
- 6.2.4. White Pieces
- 6.2.5. Scorched Pieces
- 6.2.6. Dessert Pieces
- 6.1. Market Analysis, Insights and Forecast - by Grade
- 7. Europe Cashew Industry Analysis, Insights and Forecast, 2020-2032
- 7.1. Market Analysis, Insights and Forecast - by Grade
- 7.1.1. White Wholes
- 7.1.2. Scorched Wholes
- 7.1.3. Dessert Wholes
- 7.1.4. White Pieces
- 7.1.5. Scorched Pieces
- 7.1.6. Dessert Pieces
- 7.2. Market Analysis, Insights and Forecast - by Grade
- 7.2.1. White Wholes
- 7.2.2. Scorched Wholes
- 7.2.3. Dessert Wholes
- 7.2.4. White Pieces
- 7.2.5. Scorched Pieces
- 7.2.6. Dessert Pieces
- 7.1. Market Analysis, Insights and Forecast - by Grade
- 8. Asia Pacific Cashew Industry Analysis, Insights and Forecast, 2020-2032
- 8.1. Market Analysis, Insights and Forecast - by Grade
- 8.1.1. White Wholes
- 8.1.2. Scorched Wholes
- 8.1.3. Dessert Wholes
- 8.1.4. White Pieces
- 8.1.5. Scorched Pieces
- 8.1.6. Dessert Pieces
- 8.2. Market Analysis, Insights and Forecast - by Grade
- 8.2.1. White Wholes
- 8.2.2. Scorched Wholes
- 8.2.3. Dessert Wholes
- 8.2.4. White Pieces
- 8.2.5. Scorched Pieces
- 8.2.6. Dessert Pieces
- 8.1. Market Analysis, Insights and Forecast - by Grade
- 9. South America Cashew Industry Analysis, Insights and Forecast, 2020-2032
- 9.1. Market Analysis, Insights and Forecast - by Grade
- 9.1.1. White Wholes
- 9.1.2. Scorched Wholes
- 9.1.3. Dessert Wholes
- 9.1.4. White Pieces
- 9.1.5. Scorched Pieces
- 9.1.6. Dessert Pieces
- 9.2. Market Analysis, Insights and Forecast - by Grade
- 9.2.1. White Wholes
- 9.2.2. Scorched Wholes
- 9.2.3. Dessert Wholes
- 9.2.4. White Pieces
- 9.2.5. Scorched Pieces
- 9.2.6. Dessert Pieces
- 9.1. Market Analysis, Insights and Forecast - by Grade
- 10. Africa Cashew Industry Analysis, Insights and Forecast, 2020-2032
- 10.1. Market Analysis, Insights and Forecast - by Grade
- 10.1.1. White Wholes
- 10.1.2. Scorched Wholes
- 10.1.3. Dessert Wholes
- 10.1.4. White Pieces
- 10.1.5. Scorched Pieces
- 10.1.6. Dessert Pieces
- 10.2. Market Analysis, Insights and Forecast - by Grade
- 10.2.1. White Wholes
- 10.2.2. Scorched Wholes
- 10.2.3. Dessert Wholes
- 10.2.4. White Pieces
- 10.2.5. Scorched Pieces
- 10.2.6. Dessert Pieces
- 10.1. Market Analysis, Insights and Forecast - by Grade
- 11. Tanzania Cashew Industry Analysis, Insights and Forecast, 2020-2032
- 11.1. Market Analysis, Insights and Forecast - by Grade
- 11.1.1. White Wholes
- 11.1.2. Scorched Wholes
- 11.1.3. Dessert Wholes
- 11.1.4. White Pieces
- 11.1.5. Scorched Pieces
- 11.1.6. Dessert Pieces
- 11.2. Market Analysis, Insights and Forecast - by Grade
- 11.2.1. White Wholes
- 11.2.2. Scorched Wholes
- 11.2.3. Dessert Wholes
- 11.2.4. White Pieces
- 11.2.5. Scorched Pieces
- 11.2.6. Dessert Pieces
- 11.1. Market Analysis, Insights and Forecast - by Grade
- 12. Competitive Analysis
- 12.1. Global Market Share Analysis 2025
- 12.2. Company Profiles
- 12.2.1 Sunmark Food Ingredients
- 12.2.1.1. Overview
- 12.2.1.2. Products
- 12.2.1.3. SWOT Analysis
- 12.2.1.4. Recent Developments
- 12.2.1.5. Financials (Based on Availability)
- 12.2.2 Royal Nuts
- 12.2.2.1. Overview
- 12.2.2.2. Products
- 12.2.2.3. SWOT Analysis
- 12.2.2.4. Recent Developments
- 12.2.2.5. Financials (Based on Availability)
- 12.2.3 Dole Food Company
- 12.2.3.1. Overview
- 12.2.3.2. Products
- 12.2.3.3. SWOT Analysis
- 12.2.3.4. Recent Developments
- 12.2.3.5. Financials (Based on Availability)
- 12.2.4 Olam International
- 12.2.4.1. Overview
- 12.2.4.2. Products
- 12.2.4.3. SWOT Analysis
- 12.2.4.4. Recent Developments
- 12.2.4.5. Financials (Based on Availability)
- 12.2.5 Cashew Nut Processing Factory
- 12.2.5.1. Overview
- 12.2.5.2. Products
- 12.2.5.3. SWOT Analysis
- 12.2.5.4. Recent Developments
- 12.2.5.5. Financials (Based on Availability)
- 12.2.1 Sunmark Food Ingredients
List of Figures
- Figure 1: Global Cashew Industry Revenue Breakdown (Million, %) by Region 2025 & 2033
- Figure 2: Global Cashew Industry Volume Breakdown (Kiloton, %) by Region 2025 & 2033
- Figure 3: North America Cashew Industry Revenue (Million), by Grade 2025 & 2033
- Figure 4: North America Cashew Industry Volume (Kiloton), by Grade 2025 & 2033
- Figure 5: North America Cashew Industry Revenue Share (%), by Grade 2025 & 2033
- Figure 6: North America Cashew Industry Volume Share (%), by Grade 2025 & 2033
- Figure 7: North America Cashew Industry Revenue (Million), by Grade 2025 & 2033
- Figure 8: North America Cashew Industry Volume (Kiloton), by Grade 2025 & 2033
- Figure 9: North America Cashew Industry Revenue Share (%), by Grade 2025 & 2033
- Figure 10: North America Cashew Industry Volume Share (%), by Grade 2025 & 2033
- Figure 11: North America Cashew Industry Revenue (Million), by Country 2025 & 2033
- Figure 12: North America Cashew Industry Volume (Kiloton), by Country 2025 & 2033
- Figure 13: North America Cashew Industry Revenue Share (%), by Country 2025 & 2033
- Figure 14: North America Cashew Industry Volume Share (%), by Country 2025 & 2033
- Figure 15: Europe Cashew Industry Revenue (Million), by Grade 2025 & 2033
- Figure 16: Europe Cashew Industry Volume (Kiloton), by Grade 2025 & 2033
- Figure 17: Europe Cashew Industry Revenue Share (%), by Grade 2025 & 2033
- Figure 18: Europe Cashew Industry Volume Share (%), by Grade 2025 & 2033
- Figure 19: Europe Cashew Industry Revenue (Million), by Grade 2025 & 2033
- Figure 20: Europe Cashew Industry Volume (Kiloton), by Grade 2025 & 2033
- Figure 21: Europe Cashew Industry Revenue Share (%), by Grade 2025 & 2033
- Figure 22: Europe Cashew Industry Volume Share (%), by Grade 2025 & 2033
- Figure 23: Europe Cashew Industry Revenue (Million), by Country 2025 & 2033
- Figure 24: Europe Cashew Industry Volume (Kiloton), by Country 2025 & 2033
- Figure 25: Europe Cashew Industry Revenue Share (%), by Country 2025 & 2033
- Figure 26: Europe Cashew Industry Volume Share (%), by Country 2025 & 2033
- Figure 27: Asia Pacific Cashew Industry Revenue (Million), by Grade 2025 & 2033
- Figure 28: Asia Pacific Cashew Industry Volume (Kiloton), by Grade 2025 & 2033
- Figure 29: Asia Pacific Cashew Industry Revenue Share (%), by Grade 2025 & 2033
- Figure 30: Asia Pacific Cashew Industry Volume Share (%), by Grade 2025 & 2033
- Figure 31: Asia Pacific Cashew Industry Revenue (Million), by Grade 2025 & 2033
- Figure 32: Asia Pacific Cashew Industry Volume (Kiloton), by Grade 2025 & 2033
- Figure 33: Asia Pacific Cashew Industry Revenue Share (%), by Grade 2025 & 2033
- Figure 34: Asia Pacific Cashew Industry Volume Share (%), by Grade 2025 & 2033
- Figure 35: Asia Pacific Cashew Industry Revenue (Million), by Country 2025 & 2033
- Figure 36: Asia Pacific Cashew Industry Volume (Kiloton), by Country 2025 & 2033
- Figure 37: Asia Pacific Cashew Industry Revenue Share (%), by Country 2025 & 2033
- Figure 38: Asia Pacific Cashew Industry Volume Share (%), by Country 2025 & 2033
- Figure 39: South America Cashew Industry Revenue (Million), by Grade 2025 & 2033
- Figure 40: South America Cashew Industry Volume (Kiloton), by Grade 2025 & 2033
- Figure 41: South America Cashew Industry Revenue Share (%), by Grade 2025 & 2033
- Figure 42: South America Cashew Industry Volume Share (%), by Grade 2025 & 2033
- Figure 43: South America Cashew Industry Revenue (Million), by Grade 2025 & 2033
- Figure 44: South America Cashew Industry Volume (Kiloton), by Grade 2025 & 2033
- Figure 45: South America Cashew Industry Revenue Share (%), by Grade 2025 & 2033
- Figure 46: South America Cashew Industry Volume Share (%), by Grade 2025 & 2033
- Figure 47: South America Cashew Industry Revenue (Million), by Country 2025 & 2033
- Figure 48: South America Cashew Industry Volume (Kiloton), by Country 2025 & 2033
- Figure 49: South America Cashew Industry Revenue Share (%), by Country 2025 & 2033
- Figure 50: South America Cashew Industry Volume Share (%), by Country 2025 & 2033
- Figure 51: Africa Cashew Industry Revenue (Million), by Grade 2025 & 2033
- Figure 52: Africa Cashew Industry Volume (Kiloton), by Grade 2025 & 2033
- Figure 53: Africa Cashew Industry Revenue Share (%), by Grade 2025 & 2033
- Figure 54: Africa Cashew Industry Volume Share (%), by Grade 2025 & 2033
- Figure 55: Africa Cashew Industry Revenue (Million), by Grade 2025 & 2033
- Figure 56: Africa Cashew Industry Volume (Kiloton), by Grade 2025 & 2033
- Figure 57: Africa Cashew Industry Revenue Share (%), by Grade 2025 & 2033
- Figure 58: Africa Cashew Industry Volume Share (%), by Grade 2025 & 2033
- Figure 59: Africa Cashew Industry Revenue (Million), by Country 2025 & 2033
- Figure 60: Africa Cashew Industry Volume (Kiloton), by Country 2025 & 2033
- Figure 61: Africa Cashew Industry Revenue Share (%), by Country 2025 & 2033
- Figure 62: Africa Cashew Industry Volume Share (%), by Country 2025 & 2033
- Figure 63: Tanzania Cashew Industry Revenue (Million), by Grade 2025 & 2033
- Figure 64: Tanzania Cashew Industry Volume (Kiloton), by Grade 2025 & 2033
- Figure 65: Tanzania Cashew Industry Revenue Share (%), by Grade 2025 & 2033
- Figure 66: Tanzania Cashew Industry Volume Share (%), by Grade 2025 & 2033
- Figure 67: Tanzania Cashew Industry Revenue (Million), by Grade 2025 & 2033
- Figure 68: Tanzania Cashew Industry Volume (Kiloton), by Grade 2025 & 2033
- Figure 69: Tanzania Cashew Industry Revenue Share (%), by Grade 2025 & 2033
- Figure 70: Tanzania Cashew Industry Volume Share (%), by Grade 2025 & 2033
- Figure 71: Tanzania Cashew Industry Revenue (Million), by Country 2025 & 2033
- Figure 72: Tanzania Cashew Industry Volume (Kiloton), by Country 2025 & 2033
- Figure 73: Tanzania Cashew Industry Revenue Share (%), by Country 2025 & 2033
- Figure 74: Tanzania Cashew Industry Volume Share (%), by Country 2025 & 2033
List of Tables
- Table 1: Global Cashew Industry Revenue Million Forecast, by Grade 2020 & 2033
- Table 2: Global Cashew Industry Volume Kiloton Forecast, by Grade 2020 & 2033
- Table 3: Global Cashew Industry Revenue Million Forecast, by Grade 2020 & 2033
- Table 4: Global Cashew Industry Volume Kiloton Forecast, by Grade 2020 & 2033
- Table 5: Global Cashew Industry Revenue Million Forecast, by Region 2020 & 2033
- Table 6: Global Cashew Industry Volume Kiloton Forecast, by Region 2020 & 2033
- Table 7: Global Cashew Industry Revenue Million Forecast, by Grade 2020 & 2033
- Table 8: Global Cashew Industry Volume Kiloton Forecast, by Grade 2020 & 2033
- Table 9: Global Cashew Industry Revenue Million Forecast, by Grade 2020 & 2033
- Table 10: Global Cashew Industry Volume Kiloton Forecast, by Grade 2020 & 2033
- Table 11: Global Cashew Industry Revenue Million Forecast, by Country 2020 & 2033
- Table 12: Global Cashew Industry Volume Kiloton Forecast, by Country 2020 & 2033
- Table 13: United States Cashew Industry Revenue (Million) Forecast, by Application 2020 & 2033
- Table 14: United States Cashew Industry Volume (Kiloton) Forecast, by Application 2020 & 2033
- Table 15: Canada Cashew Industry Revenue (Million) Forecast, by Application 2020 & 2033
- Table 16: Canada Cashew Industry Volume (Kiloton) Forecast, by Application 2020 & 2033
- Table 17: Mexico Cashew Industry Revenue (Million) Forecast, by Application 2020 & 2033
- Table 18: Mexico Cashew Industry Volume (Kiloton) Forecast, by Application 2020 & 2033
- Table 19: Global Cashew Industry Revenue Million Forecast, by Grade 2020 & 2033
- Table 20: Global Cashew Industry Volume Kiloton Forecast, by Grade 2020 & 2033
- Table 21: Global Cashew Industry Revenue Million Forecast, by Grade 2020 & 2033
- Table 22: Global Cashew Industry Volume Kiloton Forecast, by Grade 2020 & 2033
- Table 23: Global Cashew Industry Revenue Million Forecast, by Country 2020 & 2033
- Table 24: Global Cashew Industry Volume Kiloton Forecast, by Country 2020 & 2033
- Table 25: Germany Cashew Industry Revenue (Million) Forecast, by Application 2020 & 2033
- Table 26: Germany Cashew Industry Volume (Kiloton) Forecast, by Application 2020 & 2033
- Table 27: United Kingdom Cashew Industry Revenue (Million) Forecast, by Application 2020 & 2033
- Table 28: United Kingdom Cashew Industry Volume (Kiloton) Forecast, by Application 2020 & 2033
- Table 29: France Cashew Industry Revenue (Million) Forecast, by Application 2020 & 2033
- Table 30: France Cashew Industry Volume (Kiloton) Forecast, by Application 2020 & 2033
- Table 31: Global Cashew Industry Revenue Million Forecast, by Grade 2020 & 2033
- Table 32: Global Cashew Industry Volume Kiloton Forecast, by Grade 2020 & 2033
- Table 33: Global Cashew Industry Revenue Million Forecast, by Grade 2020 & 2033
- Table 34: Global Cashew Industry Volume Kiloton Forecast, by Grade 2020 & 2033
- Table 35: Global Cashew Industry Revenue Million Forecast, by Country 2020 & 2033
- Table 36: Global Cashew Industry Volume Kiloton Forecast, by Country 2020 & 2033
- Table 37: India Cashew Industry Revenue (Million) Forecast, by Application 2020 & 2033
- Table 38: India Cashew Industry Volume (Kiloton) Forecast, by Application 2020 & 2033
- Table 39: China Cashew Industry Revenue (Million) Forecast, by Application 2020 & 2033
- Table 40: China Cashew Industry Volume (Kiloton) Forecast, by Application 2020 & 2033
- Table 41: Australia Cashew Industry Revenue (Million) Forecast, by Application 2020 & 2033
- Table 42: Australia Cashew Industry Volume (Kiloton) Forecast, by Application 2020 & 2033
- Table 43: Vietnam Cashew Industry Revenue (Million) Forecast, by Application 2020 & 2033
- Table 44: Vietnam Cashew Industry Volume (Kiloton) Forecast, by Application 2020 & 2033
- Table 45: Philippines Cashew Industry Revenue (Million) Forecast, by Application 2020 & 2033
- Table 46: Philippines Cashew Industry Volume (Kiloton) Forecast, by Application 2020 & 2033
- Table 47: Indonesia Cashew Industry Revenue (Million) Forecast, by Application 2020 & 2033
- Table 48: Indonesia Cashew Industry Volume (Kiloton) Forecast, by Application 2020 & 2033
- Table 49: Global Cashew Industry Revenue Million Forecast, by Grade 2020 & 2033
- Table 50: Global Cashew Industry Volume Kiloton Forecast, by Grade 2020 & 2033
- Table 51: Global Cashew Industry Revenue Million Forecast, by Grade 2020 & 2033
- Table 52: Global Cashew Industry Volume Kiloton Forecast, by Grade 2020 & 2033
- Table 53: Global Cashew Industry Revenue Million Forecast, by Country 2020 & 2033
- Table 54: Global Cashew Industry Volume Kiloton Forecast, by Country 2020 & 2033
- Table 55: Brazil Cashew Industry Revenue (Million) Forecast, by Application 2020 & 2033
- Table 56: Brazil Cashew Industry Volume (Kiloton) Forecast, by Application 2020 & 2033
- Table 57: Argentina Cashew Industry Revenue (Million) Forecast, by Application 2020 & 2033
- Table 58: Argentina Cashew Industry Volume (Kiloton) Forecast, by Application 2020 & 2033
- Table 59: Global Cashew Industry Revenue Million Forecast, by Grade 2020 & 2033
- Table 60: Global Cashew Industry Volume Kiloton Forecast, by Grade 2020 & 2033
- Table 61: Global Cashew Industry Revenue Million Forecast, by Grade 2020 & 2033
- Table 62: Global Cashew Industry Volume Kiloton Forecast, by Grade 2020 & 2033
- Table 63: Global Cashew Industry Revenue Million Forecast, by Country 2020 & 2033
- Table 64: Global Cashew Industry Volume Kiloton Forecast, by Country 2020 & 2033
- Table 65: C Cashew Industry Revenue (Million) Forecast, by Application 2020 & 2033
- Table 66: C Cashew Industry Volume (Kiloton) Forecast, by Application 2020 & 2033
- Table 67: Global Cashew Industry Revenue Million Forecast, by Grade 2020 & 2033
- Table 68: Global Cashew Industry Volume Kiloton Forecast, by Grade 2020 & 2033
- Table 69: Global Cashew Industry Revenue Million Forecast, by Grade 2020 & 2033
- Table 70: Global Cashew Industry Volume Kiloton Forecast, by Grade 2020 & 2033
- Table 71: Global Cashew Industry Revenue Million Forecast, by Country 2020 & 2033
- Table 72: Global Cashew Industry Volume Kiloton Forecast, by Country 2020 & 2033
Frequently Asked Questions
1. What is the projected Compound Annual Growth Rate (CAGR) of the Cashew Industry?
The projected CAGR is approximately 3.31%.
2. Which companies are prominent players in the Cashew Industry?
Key companies in the market include Sunmark Food Ingredients, Royal Nuts , Dole Food Company , Olam International , Cashew Nut Processing Factory.
3. What are the main segments of the Cashew Industry?
The market segments include Grade, Grade.
4. Can you provide details about the market size?
The market size is estimated to be USD 7.82 Million as of 2022.
5. What are some drivers contributing to market growth?
Rising Consumption of Cashew Nuts as a Healthy Snack; Increasing Government initiatives; Growing Cashew Nut Imports in The United States.
6. What are the notable trends driving market growth?
Rising Consumption of Cashew Nuts as a Healthy Snack.
7. Are there any restraints impacting market growth?
Hazardous Climatic Condition Hinders Cashew Production; Stringent Regulations Related To Food Quality Standards.
8. Can you provide examples of recent developments in the market?
January 2023: According to CRISIL (an Indian consulting firm offering ratings, analysis, risk, and policy advice) and a branch of S&P Global, the Indian cashew processing industry is driving demand for cashews, which extended beyond USD 300,000 million in 2022, an increase of 15% year-on-year growth in revenue.
9. What pricing options are available for accessing the report?
Pricing options include single-user, multi-user, and enterprise licenses priced at USD 4750, USD 5250, and USD 8750 respectively.
10. Is the market size provided in terms of value or volume?
The market size is provided in terms of value, measured in Million and volume, measured in Kiloton.
11. Are there any specific market keywords associated with the report?
Yes, the market keyword associated with the report is "Cashew Industry," which aids in identifying and referencing the specific market segment covered.
12. How do I determine which pricing option suits my needs best?
The pricing options vary based on user requirements and access needs. Individual users may opt for single-user licenses, while businesses requiring broader access may choose multi-user or enterprise licenses for cost-effective access to the report.
13. Are there any additional resources or data provided in the Cashew Industry report?
While the report offers comprehensive insights, it's advisable to review the specific contents or supplementary materials provided to ascertain if additional resources or data are available.
14. How can I stay updated on further developments or reports in the Cashew Industry?
To stay informed about further developments, trends, and reports in the Cashew Industry, consider subscribing to industry newsletters, following relevant companies and organizations, or regularly checking reputable industry news sources and publications.
Methodology
Step 1 - Identification of Relevant Samples Size from Population Database


Step 2 - Approaches for Defining Global Market Size (Value, Volume* & Price*)

Note*: In applicable scenarios
Step 3 - Data Sources
Primary Research
- Web Analytics
- Survey Reports
- Research Institute
- Latest Research Reports
- Opinion Leaders
Secondary Research
- Annual Reports
- White Paper
- Latest Press Release
- Industry Association
- Paid Database
- Investor Presentations

Step 4 - Data Triangulation
Involves using different sources of information in order to increase the validity of a study
These sources are likely to be stakeholders in a program - participants, other researchers, program staff, other community members, and so on.
Then we put all data in single framework & apply various statistical tools to find out the dynamic on the market.
During the analysis stage, feedback from the stakeholder groups would be compared to determine areas of agreement as well as areas of divergence