

Key Insights
The global Critical Power and Cooling Solutions market is poised for significant expansion, projected to reach approximately $7.79 billion in 2025. This robust growth is underpinned by a Compound Annual Growth Rate (CAGR) of 7.99% throughout the forecast period, indicating a dynamic and evolving industry landscape. The surge in demand is primarily driven by the escalating need for uninterrupted power supply and optimal thermal management across various critical sectors. These include IT and telecommunications, where data centers are expanding at an unprecedented pace, demanding highly reliable power infrastructure to prevent downtime. The retail sector's increasing adoption of digital technologies and e-commerce further necessitates resilient power solutions to support continuous operations and customer experiences. Similarly, the healthcare industry, with its reliance on life-support systems and sensitive medical equipment, presents a substantial market for critical power and cooling. Emerging economies are also contributing to this growth, with increasing digitalization and infrastructure development fueling the demand for these essential solutions.
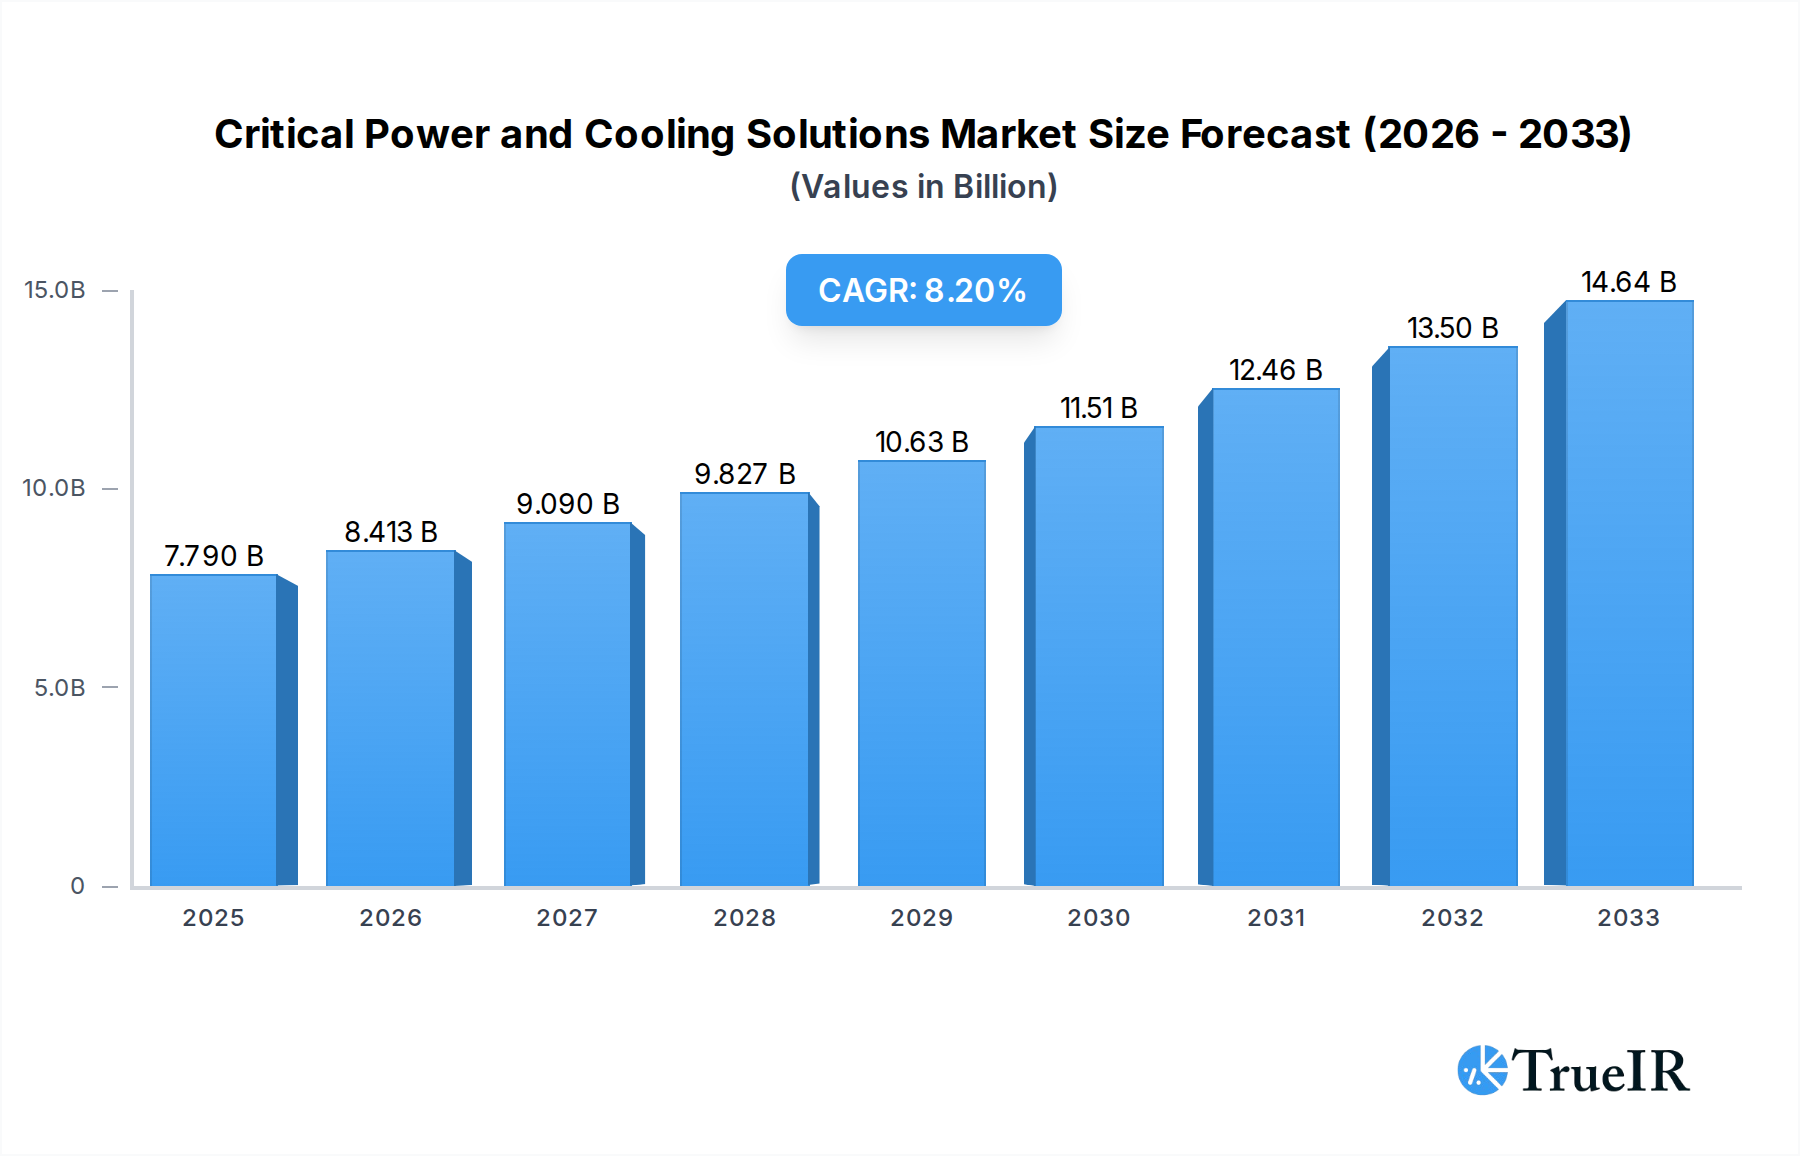
Critical Power and Cooling Solutions Market Size (In Billion)
The market is characterized by key segments, with Power Supply & Transfer solutions and Cooling Systems forming the core offerings. These segments are continuously innovating to meet stringent performance, efficiency, and sustainability standards. Key players such as ABB Ltd, Eaton Corporation plc, Schneider Electric, and Johnson Controls International Plc are at the forefront, investing in research and development to introduce advanced technologies. These innovations include intelligent power distribution, energy-efficient cooling, and integrated management systems designed for scalability and resilience. While the market exhibits strong growth potential, certain restraints, such as the high initial investment cost of advanced systems and the increasing complexity of integrating diverse power and cooling components, warrant careful consideration. However, the overarching trend of digital transformation and the growing emphasis on business continuity are expected to outweigh these challenges, ensuring sustained market expansion and the widespread adoption of sophisticated critical power and cooling solutions globally.

Critical Power and Cooling Solutions Company Market Share
Critical Power and Cooling Solutions Market Analysis Report (2019–2033)
This comprehensive report provides an in-depth analysis of the global Critical Power and Cooling Solutions market, spanning the historical period of 2019–2024 and forecasting through 2033. With a base year of 2025 and an estimated year also set as 2025, the report offers unparalleled insights into market dynamics, key players, and future trajectories, vital for stakeholders navigating this rapidly evolving sector. The market size is projected to reach Billion in the forecast period, driven by a Compound Annual Growth Rate (CAGR) of XX%.
Critical Power and Cooling Solutions Market Structure & Competitive Landscape
The Critical Power and Cooling Solutions market exhibits a moderately concentrated structure, with a few major players dominating market share. Innovation remains a key driver, fueled by continuous research and development in energy efficiency, smart grid integration, and advanced cooling technologies. Regulatory impacts are significant, with evolving standards for data center energy consumption and reliability influencing product development and market entry. Product substitutes, while present, often lack the specialized features and guaranteed uptime crucial for critical applications. End-user segmentation reveals a strong reliance on the IT and Telecommunications sectors, followed by Retail and Healthcare, all demanding robust and uninterrupted power and cooling. Mergers and Acquisitions (M&A) activity, estimated at over Billion in strategic deals during the historical period, continues to shape the competitive landscape, consolidating expertise and expanding market reach. Concentration ratios for the top five players are estimated at XX%.
- Innovation Drivers: AI-driven cooling optimization, advanced battery technologies, modular and scalable infrastructure.
- Regulatory Impacts: Stricter energy efficiency mandates, data sovereignty laws, cybersecurity standards.
- End-User Segmentation: High demand from data centers, enterprise IT, and critical infrastructure.
- M&A Trends: Focus on acquiring specialized cooling technologies and expanding geographical presence.
Critical Power and Cooling Solutions Market Trends & Opportunities
The Critical Power and Cooling Solutions market is experiencing robust growth, projected to expand significantly throughout the forecast period. This expansion is underpinned by a confluence of technological advancements, shifting consumer preferences, and evolving competitive dynamics. The increasing demand for high-performance computing, artificial intelligence, and the burgeoning Internet of Things (IoT) are driving the need for more sophisticated and reliable power and cooling infrastructure. Data centers, both hyperscale and enterprise, are at the forefront of this demand, requiring solutions that can handle escalating power densities and maintain optimal operating temperatures. The rise of edge computing further accentuates this need, as data processing moves closer to the source, requiring localized, yet robust, power and cooling systems.
Technological shifts are characterized by a move towards more energy-efficient solutions, including advanced liquid cooling techniques, intelligent power management systems, and renewable energy integration. Companies are increasingly investing in AI-powered predictive maintenance for their critical power and cooling equipment, minimizing downtime and optimizing operational costs. Consumer preferences are gravitating towards sustainable and eco-friendly solutions, pushing manufacturers to develop products with a lower carbon footprint and higher energy efficiency ratios. This also includes a growing interest in solutions that offer greater flexibility, scalability, and remote management capabilities.
The competitive landscape is intensifying, with established players like ABB Ltd, Daikin Industries, Ltd, Eaton Corporation plc, General Electric Company, Johnson Controls International Plc, Nortek, Inc, Riello Elettronica Group, Schneider Electric, Socomec group, STULZ GmbH, and Xiamen Kehua Hengsheng Co.,Ltd vying for market dominance. Strategic partnerships, product innovations, and geographical expansion are key strategies employed by these companies. The market penetration rate for advanced cooling solutions is estimated to reach XX% by 2033. The market size is expected to reach Billion by 2033, growing at a CAGR of XX% from Billion in 2025.
Dominant Markets & Segments in Critical Power and Cooling Solutions
The global Critical Power and Cooling Solutions market is characterized by distinct regional dominance and segment leadership, driven by specific infrastructure developments and supportive policies. North America currently leads the market, propelled by its extensive and advanced IT infrastructure, a high concentration of hyperscale data centers, and robust investments in cloud computing services. The United States, in particular, benefits from significant government and private sector funding in digital transformation initiatives, which directly fuels the demand for reliable power and cooling solutions. The IT and Telecommunications segments are the undisputed leaders within the application categories.
- Leading Region: North America
- Key Growth Drivers:
- Extensive data center development and expansion.
- High adoption rates of cloud computing and AI technologies.
- Favorable government policies supporting technological innovation and infrastructure upgrades.
- Significant investments in 5G network deployment, requiring distributed power and cooling solutions.
- Key Growth Drivers:
- Dominant Application Segment: IT
- Detailed Analysis: The IT sector's relentless growth, driven by big data, analytics, and the ever-increasing volume of data generated globally, necessitates continuous investment in robust and scalable power and cooling infrastructure. Hyperscale data centers, cloud service providers, and enterprise IT departments are all primary consumers of these critical solutions. The demand for uninterrupted operations, energy efficiency, and advanced thermal management to prevent hardware failures is paramount. The IT segment is projected to account for XX% of the market share by 2033.
- Dominant Type Segment: Power Supply & Transfer
- Detailed Analysis: Uninterruptible Power Supplies (UPS), robust power distribution units (PDUs), and seamless power transfer switches are fundamental to ensuring business continuity in critical environments. The increasing complexity of IT infrastructure and the rising costs of downtime make reliable power supply and transfer systems non-negotiable. Advances in battery technology, such as lithium-ion, and the integration of smart grid capabilities are further enhancing the performance and efficiency of these solutions. The Power Supply & Transfer segment is expected to maintain its leading position, contributing XX% to the overall market revenue by 2033.
Critical Power and Cooling Solutions Product Analysis
Product innovation in Critical Power and Cooling Solutions is driven by the demand for enhanced energy efficiency, higher reliability, and intelligent management. Advanced UPS systems now incorporate modular designs for scalability and offer predictive maintenance capabilities powered by AI. Liquid cooling technologies, including direct-to-chip and immersion cooling, are gaining traction for their superior thermal performance in high-density computing environments. These innovations provide competitive advantages by reducing operational costs, increasing equipment lifespan, and enabling the deployment of more powerful hardware. The market fit for these advanced solutions is evident in the growing adoption by hyperscale data centers, high-performance computing clusters, and mission-critical facilities across various industries.
Key Drivers, Barriers & Challenges in Critical Power and Cooling Solutions
The Critical Power and Cooling Solutions market is propelled by several key drivers.
- Technological Advancements: The proliferation of AI, IoT, and big data analytics is generating unprecedented demand for reliable computing power and, consequently, sophisticated power and cooling infrastructure.
- Energy Efficiency Mandates: Growing environmental concerns and government regulations are pushing for more energy-efficient solutions, driving innovation in cooling technologies and power management.
- Digital Transformation: The ongoing digital transformation across industries necessitates robust and scalable data center infrastructure, directly benefiting the critical power and cooling sector.
- Cloud Computing Growth: The continuous expansion of cloud services requires significant investments in hyperscale data centers equipped with state-of-the-art power and cooling systems.
However, the market also faces significant barriers and challenges.
- High Initial Investment: Implementing advanced critical power and cooling solutions often requires a substantial upfront capital expenditure, which can be a barrier for smaller organizations.
- Supply Chain Disruptions: Global supply chain volatility, as witnessed in recent years, can lead to extended lead times and increased costs for critical components.
- Regulatory Complexities: Navigating diverse and evolving regulatory landscapes across different regions can pose challenges for manufacturers and implementers.
- Skilled Workforce Shortage: A shortage of skilled professionals to design, install, and maintain complex critical power and cooling systems can impede market growth. The estimated impact of supply chain disruptions on project timelines is XX%.
Growth Drivers in the Critical Power and Cooling Solutions Market
The Critical Power and Cooling Solutions market is experiencing significant growth driven by several pivotal factors. Technologically, the accelerating adoption of artificial intelligence, machine learning, and big data analytics is creating an insatiable demand for robust and reliable computing infrastructure, directly translating to increased needs for uninterrupted power and efficient cooling. Economically, the sustained global investment in digital transformation initiatives across sectors such as finance, healthcare, and manufacturing necessitates the deployment of advanced data centers. Furthermore, evolving government policies promoting energy efficiency and sustainability are encouraging the adoption of greener and more advanced cooling solutions. The expansion of 5G networks and the growing prevalence of edge computing are also creating new avenues for growth, requiring distributed and localized critical power and cooling capabilities.
Challenges Impacting Critical Power and Cooling Solutions Growth
Despite the strong growth trajectory, the Critical Power and Cooling Solutions market encounters several formidable challenges. Regulatory complexities, encompassing varying environmental standards and data center certifications across different jurisdictions, can complicate market entry and product compliance. Supply chain issues, including shortages of key components and logistical bottlenecks, continue to pose a significant risk to project timelines and cost management. Competitive pressures from both established players and emerging new entrants are intensifying, leading to price wars and the need for continuous innovation. Moreover, the high initial investment required for cutting-edge solutions can be a substantial barrier, particularly for small and medium-sized enterprises seeking to upgrade their infrastructure. The estimated impact of regulatory hurdles on market expansion is XX%.
Key Players Shaping the Critical Power and Cooling Solutions Market
The Critical Power and Cooling Solutions market is actively shaped by a consortium of leading global companies. These industry giants are at the forefront of innovation, technological development, and market expansion, driving the industry forward with their diverse product portfolios and strategic initiatives.
- ABB Ltd
- Daikin Industries, Ltd
- Eaton Corporation plc
- General Electric Company
- Johnson Controls International Plc
- Nortek, Inc
- Riello Elettronica Group
- Schneider Electric
- Socomec group
- STULZ GmbH
- Xiamen Kehua Hengsheng Co.,Ltd
Significant Critical Power and Cooling Solutions Industry Milestones
The Critical Power and Cooling Solutions industry has witnessed numerous impactful developments that have reshaped market dynamics and technological advancements.
- 2020 (Q1): Launch of next-generation modular UPS systems offering enhanced energy efficiency and scalability.
- 2021 (Q3): Significant advancements in liquid cooling technologies, enabling higher heat dissipation for densely packed server racks.
- 2022 (Q2): Strategic acquisition of a specialized thermal management company by a major player, enhancing its cooling portfolio.
- 2023 (Q4): Introduction of AI-powered predictive maintenance solutions for critical power infrastructure, reducing downtime risks.
- 2024 (Q1): Increased focus on integrating renewable energy sources with critical power systems to meet sustainability goals.
Future Outlook for Critical Power and Cooling Solutions Market
The future outlook for the Critical Power and Cooling Solutions market is exceptionally promising, fueled by a sustained surge in demand from burgeoning digital economies and continuous technological innovation. Strategic opportunities lie in the expanding edge computing landscape, the ongoing build-out of hyperscale data centers, and the increasing adoption of high-performance computing for AI and scientific research. The market will likely witness further integration of smart technologies, enabling greater automation, remote monitoring, and predictive maintenance. Emphasis on sustainability and energy efficiency will continue to drive the development of advanced cooling solutions and the integration of renewable energy sources. The market potential is immense, projected to reach Billion by 2033.
Critical Power and Cooling Solutions Segmentation
-
1. Application
- 1.1. IT
- 1.2. Telecommunications
- 1.3. Retail
- 1.4. Healthcare
- 1.5. Other
-
2. Types
- 2.1. Power Supply & Transfer
- 2.2. Cooling System
Critical Power and Cooling Solutions Segmentation By Geography
-
1. North America
- 1.1. United States
- 1.2. Canada
- 1.3. Mexico
-
2. South America
- 2.1. Brazil
- 2.2. Argentina
- 2.3. Rest of South America
-
3. Europe
- 3.1. United Kingdom
- 3.2. Germany
- 3.3. France
- 3.4. Italy
- 3.5. Spain
- 3.6. Russia
- 3.7. Benelux
- 3.8. Nordics
- 3.9. Rest of Europe
-
4. Middle East & Africa
- 4.1. Turkey
- 4.2. Israel
- 4.3. GCC
- 4.4. North Africa
- 4.5. South Africa
- 4.6. Rest of Middle East & Africa
-
5. Asia Pacific
- 5.1. China
- 5.2. India
- 5.3. Japan
- 5.4. South Korea
- 5.5. ASEAN
- 5.6. Oceania
- 5.7. Rest of Asia Pacific
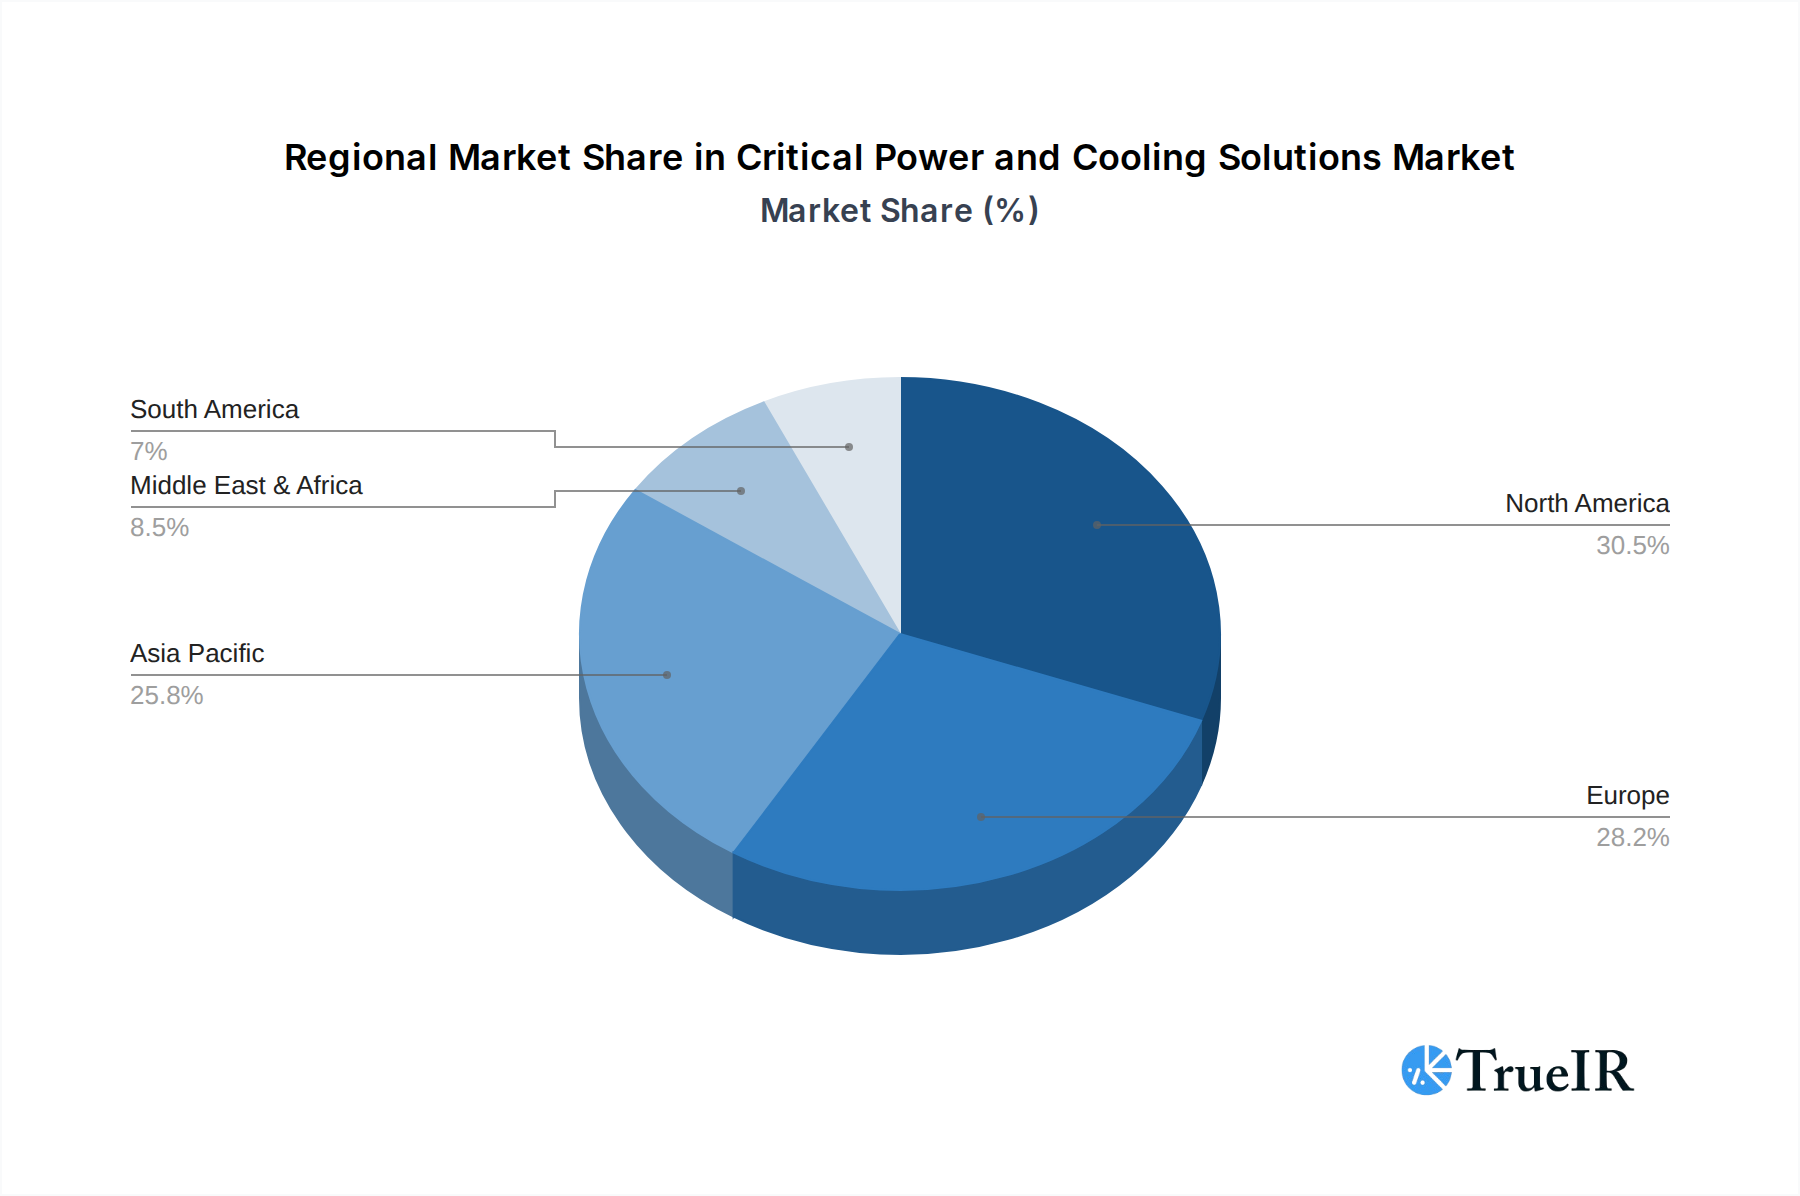
Critical Power and Cooling Solutions Regional Market Share
Geographic Coverage of Critical Power and Cooling Solutions
Critical Power and Cooling Solutions REPORT HIGHLIGHTS
| Aspects | Details |
|---|---|
| Study Period | 2020-2034 |
| Base Year | 2025 |
| Estimated Year | 2026 |
| Forecast Period | 2026-2034 |
| Historical Period | 2020-2025 |
| Growth Rate | CAGR of 7.99% from 2020-2034 |
| Segmentation |
|
Table of Contents
- 1. Introduction
- 1.1. Research Scope
- 1.2. Market Segmentation
- 1.3. Research Methodology
- 1.4. Definitions and Assumptions
- 2. Executive Summary
- 2.1. Introduction
- 3. Market Dynamics
- 3.1. Introduction
- 3.2. Market Drivers
- 3.3. Market Restrains
- 3.4. Market Trends
- 4. Market Factor Analysis
- 4.1. Porters Five Forces
- 4.2. Supply/Value Chain
- 4.3. PESTEL analysis
- 4.4. Market Entropy
- 4.5. Patent/Trademark Analysis
- 5. Global Critical Power and Cooling Solutions Analysis, Insights and Forecast, 2020-2032
- 5.1. Market Analysis, Insights and Forecast - by Application
- 5.1.1. IT
- 5.1.2. Telecommunications
- 5.1.3. Retail
- 5.1.4. Healthcare
- 5.1.5. Other
- 5.2. Market Analysis, Insights and Forecast - by Types
- 5.2.1. Power Supply & Transfer
- 5.2.2. Cooling System
- 5.3. Market Analysis, Insights and Forecast - by Region
- 5.3.1. North America
- 5.3.2. South America
- 5.3.3. Europe
- 5.3.4. Middle East & Africa
- 5.3.5. Asia Pacific
- 5.1. Market Analysis, Insights and Forecast - by Application
- 6. North America Critical Power and Cooling Solutions Analysis, Insights and Forecast, 2020-2032
- 6.1. Market Analysis, Insights and Forecast - by Application
- 6.1.1. IT
- 6.1.2. Telecommunications
- 6.1.3. Retail
- 6.1.4. Healthcare
- 6.1.5. Other
- 6.2. Market Analysis, Insights and Forecast - by Types
- 6.2.1. Power Supply & Transfer
- 6.2.2. Cooling System
- 6.1. Market Analysis, Insights and Forecast - by Application
- 7. South America Critical Power and Cooling Solutions Analysis, Insights and Forecast, 2020-2032
- 7.1. Market Analysis, Insights and Forecast - by Application
- 7.1.1. IT
- 7.1.2. Telecommunications
- 7.1.3. Retail
- 7.1.4. Healthcare
- 7.1.5. Other
- 7.2. Market Analysis, Insights and Forecast - by Types
- 7.2.1. Power Supply & Transfer
- 7.2.2. Cooling System
- 7.1. Market Analysis, Insights and Forecast - by Application
- 8. Europe Critical Power and Cooling Solutions Analysis, Insights and Forecast, 2020-2032
- 8.1. Market Analysis, Insights and Forecast - by Application
- 8.1.1. IT
- 8.1.2. Telecommunications
- 8.1.3. Retail
- 8.1.4. Healthcare
- 8.1.5. Other
- 8.2. Market Analysis, Insights and Forecast - by Types
- 8.2.1. Power Supply & Transfer
- 8.2.2. Cooling System
- 8.1. Market Analysis, Insights and Forecast - by Application
- 9. Middle East & Africa Critical Power and Cooling Solutions Analysis, Insights and Forecast, 2020-2032
- 9.1. Market Analysis, Insights and Forecast - by Application
- 9.1.1. IT
- 9.1.2. Telecommunications
- 9.1.3. Retail
- 9.1.4. Healthcare
- 9.1.5. Other
- 9.2. Market Analysis, Insights and Forecast - by Types
- 9.2.1. Power Supply & Transfer
- 9.2.2. Cooling System
- 9.1. Market Analysis, Insights and Forecast - by Application
- 10. Asia Pacific Critical Power and Cooling Solutions Analysis, Insights and Forecast, 2020-2032
- 10.1. Market Analysis, Insights and Forecast - by Application
- 10.1.1. IT
- 10.1.2. Telecommunications
- 10.1.3. Retail
- 10.1.4. Healthcare
- 10.1.5. Other
- 10.2. Market Analysis, Insights and Forecast - by Types
- 10.2.1. Power Supply & Transfer
- 10.2.2. Cooling System
- 10.1. Market Analysis, Insights and Forecast - by Application
- 11. Competitive Analysis
- 11.1. Global Market Share Analysis 2025
- 11.2. Company Profiles
- 11.2.1 ABB Ltd
- 11.2.1.1. Overview
- 11.2.1.2. Products
- 11.2.1.3. SWOT Analysis
- 11.2.1.4. Recent Developments
- 11.2.1.5. Financials (Based on Availability)
- 11.2.2 Daikin Industries
- 11.2.2.1. Overview
- 11.2.2.2. Products
- 11.2.2.3. SWOT Analysis
- 11.2.2.4. Recent Developments
- 11.2.2.5. Financials (Based on Availability)
- 11.2.3 Ltd
- 11.2.3.1. Overview
- 11.2.3.2. Products
- 11.2.3.3. SWOT Analysis
- 11.2.3.4. Recent Developments
- 11.2.3.5. Financials (Based on Availability)
- 11.2.4 Eaton Corporation plc
- 11.2.4.1. Overview
- 11.2.4.2. Products
- 11.2.4.3. SWOT Analysis
- 11.2.4.4. Recent Developments
- 11.2.4.5. Financials (Based on Availability)
- 11.2.5 General Electric Company
- 11.2.5.1. Overview
- 11.2.5.2. Products
- 11.2.5.3. SWOT Analysis
- 11.2.5.4. Recent Developments
- 11.2.5.5. Financials (Based on Availability)
- 11.2.6 Johnson Controls International Plc
- 11.2.6.1. Overview
- 11.2.6.2. Products
- 11.2.6.3. SWOT Analysis
- 11.2.6.4. Recent Developments
- 11.2.6.5. Financials (Based on Availability)
- 11.2.7 Nortek
- 11.2.7.1. Overview
- 11.2.7.2. Products
- 11.2.7.3. SWOT Analysis
- 11.2.7.4. Recent Developments
- 11.2.7.5. Financials (Based on Availability)
- 11.2.8 Inc
- 11.2.8.1. Overview
- 11.2.8.2. Products
- 11.2.8.3. SWOT Analysis
- 11.2.8.4. Recent Developments
- 11.2.8.5. Financials (Based on Availability)
- 11.2.9 Riello Elettronica Group
- 11.2.9.1. Overview
- 11.2.9.2. Products
- 11.2.9.3. SWOT Analysis
- 11.2.9.4. Recent Developments
- 11.2.9.5. Financials (Based on Availability)
- 11.2.10 Schneider Electric
- 11.2.10.1. Overview
- 11.2.10.2. Products
- 11.2.10.3. SWOT Analysis
- 11.2.10.4. Recent Developments
- 11.2.10.5. Financials (Based on Availability)
- 11.2.11 Socomec group
- 11.2.11.1. Overview
- 11.2.11.2. Products
- 11.2.11.3. SWOT Analysis
- 11.2.11.4. Recent Developments
- 11.2.11.5. Financials (Based on Availability)
- 11.2.12 STULZ Gmbh
- 11.2.12.1. Overview
- 11.2.12.2. Products
- 11.2.12.3. SWOT Analysis
- 11.2.12.4. Recent Developments
- 11.2.12.5. Financials (Based on Availability)
- 11.2.13 Xiamen Kehua Hengsheng Co.
- 11.2.13.1. Overview
- 11.2.13.2. Products
- 11.2.13.3. SWOT Analysis
- 11.2.13.4. Recent Developments
- 11.2.13.5. Financials (Based on Availability)
- 11.2.14 Ltd
- 11.2.14.1. Overview
- 11.2.14.2. Products
- 11.2.14.3. SWOT Analysis
- 11.2.14.4. Recent Developments
- 11.2.14.5. Financials (Based on Availability)
- 11.2.1 ABB Ltd
List of Figures
- Figure 1: Global Critical Power and Cooling Solutions Revenue Breakdown (billion, %) by Region 2025 & 2033
- Figure 2: North America Critical Power and Cooling Solutions Revenue (billion), by Application 2025 & 2033
- Figure 3: North America Critical Power and Cooling Solutions Revenue Share (%), by Application 2025 & 2033
- Figure 4: North America Critical Power and Cooling Solutions Revenue (billion), by Types 2025 & 2033
- Figure 5: North America Critical Power and Cooling Solutions Revenue Share (%), by Types 2025 & 2033
- Figure 6: North America Critical Power and Cooling Solutions Revenue (billion), by Country 2025 & 2033
- Figure 7: North America Critical Power and Cooling Solutions Revenue Share (%), by Country 2025 & 2033
- Figure 8: South America Critical Power and Cooling Solutions Revenue (billion), by Application 2025 & 2033
- Figure 9: South America Critical Power and Cooling Solutions Revenue Share (%), by Application 2025 & 2033
- Figure 10: South America Critical Power and Cooling Solutions Revenue (billion), by Types 2025 & 2033
- Figure 11: South America Critical Power and Cooling Solutions Revenue Share (%), by Types 2025 & 2033
- Figure 12: South America Critical Power and Cooling Solutions Revenue (billion), by Country 2025 & 2033
- Figure 13: South America Critical Power and Cooling Solutions Revenue Share (%), by Country 2025 & 2033
- Figure 14: Europe Critical Power and Cooling Solutions Revenue (billion), by Application 2025 & 2033
- Figure 15: Europe Critical Power and Cooling Solutions Revenue Share (%), by Application 2025 & 2033
- Figure 16: Europe Critical Power and Cooling Solutions Revenue (billion), by Types 2025 & 2033
- Figure 17: Europe Critical Power and Cooling Solutions Revenue Share (%), by Types 2025 & 2033
- Figure 18: Europe Critical Power and Cooling Solutions Revenue (billion), by Country 2025 & 2033
- Figure 19: Europe Critical Power and Cooling Solutions Revenue Share (%), by Country 2025 & 2033
- Figure 20: Middle East & Africa Critical Power and Cooling Solutions Revenue (billion), by Application 2025 & 2033
- Figure 21: Middle East & Africa Critical Power and Cooling Solutions Revenue Share (%), by Application 2025 & 2033
- Figure 22: Middle East & Africa Critical Power and Cooling Solutions Revenue (billion), by Types 2025 & 2033
- Figure 23: Middle East & Africa Critical Power and Cooling Solutions Revenue Share (%), by Types 2025 & 2033
- Figure 24: Middle East & Africa Critical Power and Cooling Solutions Revenue (billion), by Country 2025 & 2033
- Figure 25: Middle East & Africa Critical Power and Cooling Solutions Revenue Share (%), by Country 2025 & 2033
- Figure 26: Asia Pacific Critical Power and Cooling Solutions Revenue (billion), by Application 2025 & 2033
- Figure 27: Asia Pacific Critical Power and Cooling Solutions Revenue Share (%), by Application 2025 & 2033
- Figure 28: Asia Pacific Critical Power and Cooling Solutions Revenue (billion), by Types 2025 & 2033
- Figure 29: Asia Pacific Critical Power and Cooling Solutions Revenue Share (%), by Types 2025 & 2033
- Figure 30: Asia Pacific Critical Power and Cooling Solutions Revenue (billion), by Country 2025 & 2033
- Figure 31: Asia Pacific Critical Power and Cooling Solutions Revenue Share (%), by Country 2025 & 2033
List of Tables
- Table 1: Global Critical Power and Cooling Solutions Revenue billion Forecast, by Application 2020 & 2033
- Table 2: Global Critical Power and Cooling Solutions Revenue billion Forecast, by Types 2020 & 2033
- Table 3: Global Critical Power and Cooling Solutions Revenue billion Forecast, by Region 2020 & 2033
- Table 4: Global Critical Power and Cooling Solutions Revenue billion Forecast, by Application 2020 & 2033
- Table 5: Global Critical Power and Cooling Solutions Revenue billion Forecast, by Types 2020 & 2033
- Table 6: Global Critical Power and Cooling Solutions Revenue billion Forecast, by Country 2020 & 2033
- Table 7: United States Critical Power and Cooling Solutions Revenue (billion) Forecast, by Application 2020 & 2033
- Table 8: Canada Critical Power and Cooling Solutions Revenue (billion) Forecast, by Application 2020 & 2033
- Table 9: Mexico Critical Power and Cooling Solutions Revenue (billion) Forecast, by Application 2020 & 2033
- Table 10: Global Critical Power and Cooling Solutions Revenue billion Forecast, by Application 2020 & 2033
- Table 11: Global Critical Power and Cooling Solutions Revenue billion Forecast, by Types 2020 & 2033
- Table 12: Global Critical Power and Cooling Solutions Revenue billion Forecast, by Country 2020 & 2033
- Table 13: Brazil Critical Power and Cooling Solutions Revenue (billion) Forecast, by Application 2020 & 2033
- Table 14: Argentina Critical Power and Cooling Solutions Revenue (billion) Forecast, by Application 2020 & 2033
- Table 15: Rest of South America Critical Power and Cooling Solutions Revenue (billion) Forecast, by Application 2020 & 2033
- Table 16: Global Critical Power and Cooling Solutions Revenue billion Forecast, by Application 2020 & 2033
- Table 17: Global Critical Power and Cooling Solutions Revenue billion Forecast, by Types 2020 & 2033
- Table 18: Global Critical Power and Cooling Solutions Revenue billion Forecast, by Country 2020 & 2033
- Table 19: United Kingdom Critical Power and Cooling Solutions Revenue (billion) Forecast, by Application 2020 & 2033
- Table 20: Germany Critical Power and Cooling Solutions Revenue (billion) Forecast, by Application 2020 & 2033
- Table 21: France Critical Power and Cooling Solutions Revenue (billion) Forecast, by Application 2020 & 2033
- Table 22: Italy Critical Power and Cooling Solutions Revenue (billion) Forecast, by Application 2020 & 2033
- Table 23: Spain Critical Power and Cooling Solutions Revenue (billion) Forecast, by Application 2020 & 2033
- Table 24: Russia Critical Power and Cooling Solutions Revenue (billion) Forecast, by Application 2020 & 2033
- Table 25: Benelux Critical Power and Cooling Solutions Revenue (billion) Forecast, by Application 2020 & 2033
- Table 26: Nordics Critical Power and Cooling Solutions Revenue (billion) Forecast, by Application 2020 & 2033
- Table 27: Rest of Europe Critical Power and Cooling Solutions Revenue (billion) Forecast, by Application 2020 & 2033
- Table 28: Global Critical Power and Cooling Solutions Revenue billion Forecast, by Application 2020 & 2033
- Table 29: Global Critical Power and Cooling Solutions Revenue billion Forecast, by Types 2020 & 2033
- Table 30: Global Critical Power and Cooling Solutions Revenue billion Forecast, by Country 2020 & 2033
- Table 31: Turkey Critical Power and Cooling Solutions Revenue (billion) Forecast, by Application 2020 & 2033
- Table 32: Israel Critical Power and Cooling Solutions Revenue (billion) Forecast, by Application 2020 & 2033
- Table 33: GCC Critical Power and Cooling Solutions Revenue (billion) Forecast, by Application 2020 & 2033
- Table 34: North Africa Critical Power and Cooling Solutions Revenue (billion) Forecast, by Application 2020 & 2033
- Table 35: South Africa Critical Power and Cooling Solutions Revenue (billion) Forecast, by Application 2020 & 2033
- Table 36: Rest of Middle East & Africa Critical Power and Cooling Solutions Revenue (billion) Forecast, by Application 2020 & 2033
- Table 37: Global Critical Power and Cooling Solutions Revenue billion Forecast, by Application 2020 & 2033
- Table 38: Global Critical Power and Cooling Solutions Revenue billion Forecast, by Types 2020 & 2033
- Table 39: Global Critical Power and Cooling Solutions Revenue billion Forecast, by Country 2020 & 2033
- Table 40: China Critical Power and Cooling Solutions Revenue (billion) Forecast, by Application 2020 & 2033
- Table 41: India Critical Power and Cooling Solutions Revenue (billion) Forecast, by Application 2020 & 2033
- Table 42: Japan Critical Power and Cooling Solutions Revenue (billion) Forecast, by Application 2020 & 2033
- Table 43: South Korea Critical Power and Cooling Solutions Revenue (billion) Forecast, by Application 2020 & 2033
- Table 44: ASEAN Critical Power and Cooling Solutions Revenue (billion) Forecast, by Application 2020 & 2033
- Table 45: Oceania Critical Power and Cooling Solutions Revenue (billion) Forecast, by Application 2020 & 2033
- Table 46: Rest of Asia Pacific Critical Power and Cooling Solutions Revenue (billion) Forecast, by Application 2020 & 2033
Frequently Asked Questions
1. What is the projected Compound Annual Growth Rate (CAGR) of the Critical Power and Cooling Solutions?
The projected CAGR is approximately 7.99%.
2. Which companies are prominent players in the Critical Power and Cooling Solutions?
Key companies in the market include ABB Ltd, Daikin Industries, Ltd, Eaton Corporation plc, General Electric Company, Johnson Controls International Plc, Nortek, Inc, Riello Elettronica Group, Schneider Electric, Socomec group, STULZ Gmbh, Xiamen Kehua Hengsheng Co., Ltd.
3. What are the main segments of the Critical Power and Cooling Solutions?
The market segments include Application, Types.
4. Can you provide details about the market size?
The market size is estimated to be USD 7.79 billion as of 2022.
5. What are some drivers contributing to market growth?
N/A
6. What are the notable trends driving market growth?
N/A
7. Are there any restraints impacting market growth?
N/A
8. Can you provide examples of recent developments in the market?
N/A
9. What pricing options are available for accessing the report?
Pricing options include single-user, multi-user, and enterprise licenses priced at USD 3950.00, USD 5925.00, and USD 7900.00 respectively.
10. Is the market size provided in terms of value or volume?
The market size is provided in terms of value, measured in billion.
11. Are there any specific market keywords associated with the report?
Yes, the market keyword associated with the report is "Critical Power and Cooling Solutions," which aids in identifying and referencing the specific market segment covered.
12. How do I determine which pricing option suits my needs best?
The pricing options vary based on user requirements and access needs. Individual users may opt for single-user licenses, while businesses requiring broader access may choose multi-user or enterprise licenses for cost-effective access to the report.
13. Are there any additional resources or data provided in the Critical Power and Cooling Solutions report?
While the report offers comprehensive insights, it's advisable to review the specific contents or supplementary materials provided to ascertain if additional resources or data are available.
14. How can I stay updated on further developments or reports in the Critical Power and Cooling Solutions?
To stay informed about further developments, trends, and reports in the Critical Power and Cooling Solutions, consider subscribing to industry newsletters, following relevant companies and organizations, or regularly checking reputable industry news sources and publications.
Methodology
Step 1 - Identification of Relevant Samples Size from Population Database


Step 2 - Approaches for Defining Global Market Size (Value, Volume* & Price*)

Note*: In applicable scenarios
Step 3 - Data Sources
Primary Research
- Web Analytics
- Survey Reports
- Research Institute
- Latest Research Reports
- Opinion Leaders
Secondary Research
- Annual Reports
- White Paper
- Latest Press Release
- Industry Association
- Paid Database
- Investor Presentations

Step 4 - Data Triangulation
Involves using different sources of information in order to increase the validity of a study
These sources are likely to be stakeholders in a program - participants, other researchers, program staff, other community members, and so on.
Then we put all data in single framework & apply various statistical tools to find out the dynamic on the market.
During the analysis stage, feedback from the stakeholder groups would be compared to determine areas of agreement as well as areas of divergence