

Key Insights
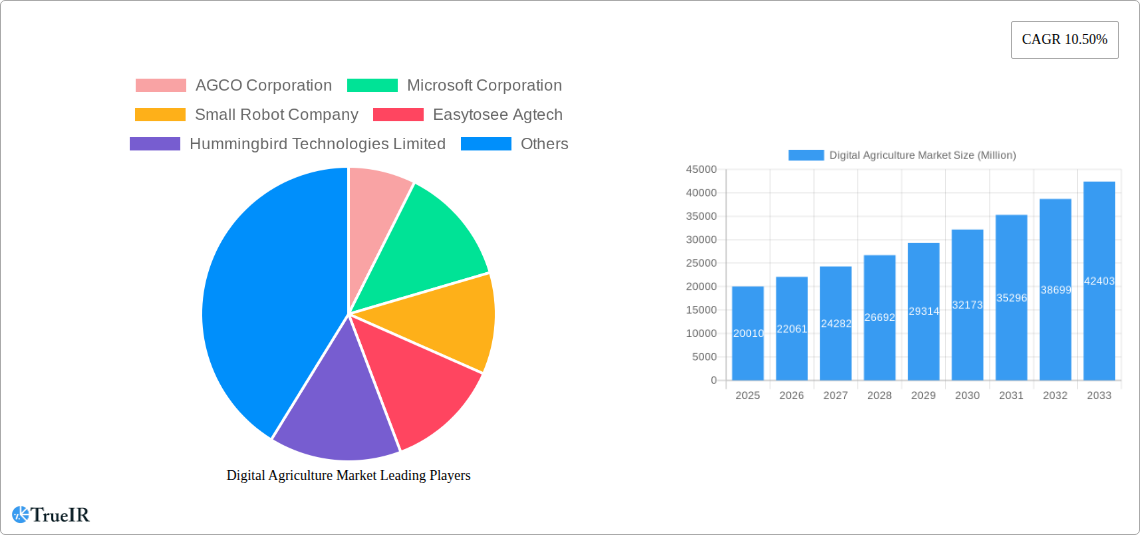
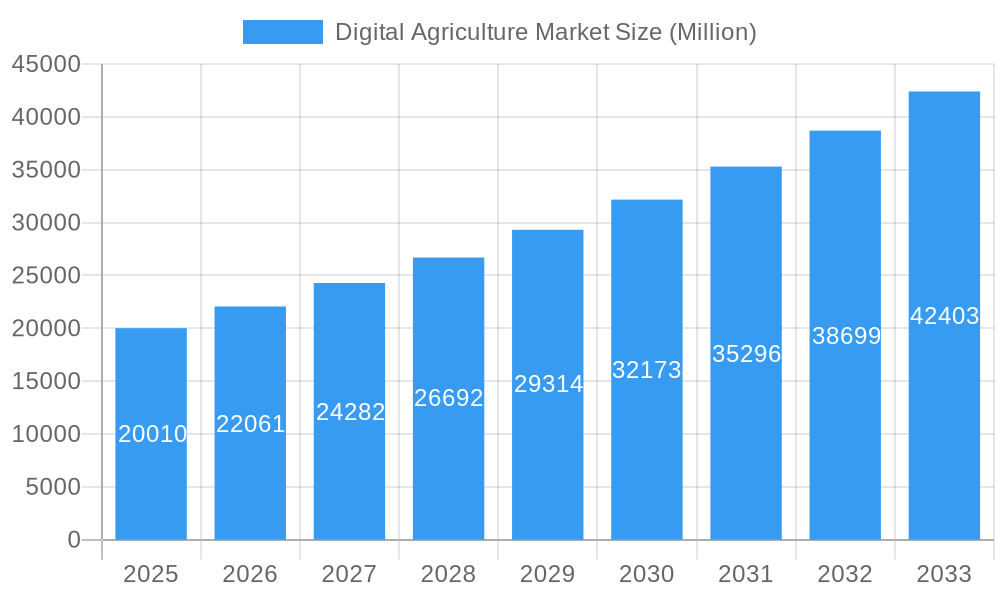
The digital agriculture market is experiencing robust growth, projected to reach \$20.01 million in 2025 and exhibiting a Compound Annual Growth Rate (CAGR) of 10.50% from 2019 to 2033. This expansion is driven by several key factors. The increasing need for enhanced crop yields in the face of a growing global population and limited arable land fuels the adoption of precision farming techniques. Technological advancements, particularly in artificial intelligence (AI), drone analytics, and variable rate technology, are providing farmers with more efficient and data-driven tools for managing their operations. Furthermore, the rising availability of affordable sensors, cloud computing capabilities, and improved connectivity are lowering the barriers to entry for farmers of all sizes, fostering wider market penetration. Government initiatives promoting sustainable agricultural practices and technological adoption further contribute to market growth. Segmentation reveals strong demand across various applications, including crop monitoring, precision farming, and other solutions tailored to specific agricultural needs. North America and Europe currently hold significant market shares, but the Asia-Pacific region is expected to demonstrate considerable growth potential in the coming years due to the increasing adoption of technology in its agricultural sector. Restraints include the high initial investment costs associated with digital agriculture technologies and the need for robust digital infrastructure and internet connectivity, particularly in developing regions.
Digital Agriculture Market Market Size (In Billion)
The competitive landscape is characterized by a mix of established agricultural machinery manufacturers, technology giants, and specialized agricultural technology startups. Companies such as AGCO, Deere & Company, Microsoft, and IBM are leveraging their expertise to develop and deliver comprehensive digital agriculture solutions. Smaller, more agile companies are focusing on niche applications and innovative technologies, contributing to a dynamic and innovative market ecosystem. Future growth will likely be shaped by further integration of AI and machine learning, the development of more sophisticated sensor technologies, and the increasing adoption of data analytics for predictive modelling and decision-making. The focus will remain on improving efficiency, sustainability, and profitability within the agricultural sector, ultimately leading to continued market expansion.
Digital Agriculture Market Company Market Share
Digital Agriculture Market: A Comprehensive Report (2019-2033)
This dynamic report provides a comprehensive analysis of the Digital Agriculture market, offering invaluable insights for investors, stakeholders, and industry professionals. Leveraging extensive data gathered from 2019 to 2024 (Historical Period), the report utilizes a base year of 2025 and forecasts market trends through 2033 (Forecast Period). It meticulously examines market size, growth drivers, competitive dynamics, and emerging technologies, providing a 360-degree view of this rapidly evolving sector. The report is structured for maximum clarity and incorporates high-volume keywords for optimal SEO performance.
Digital Agriculture Market Market Structure & Competitive Landscape
The Digital Agriculture market is characterized by a moderately concentrated structure, with key players such as Deere & Company, AGCO Corporation, and John Deere holding significant market share. However, the landscape is dynamic, with numerous smaller companies and startups driving innovation through specialized solutions. The market's concentration ratio (CR4) is estimated at xx% in 2025, indicating moderate competition. Innovation is a key driver, fueled by advancements in AI, IoT, and data analytics. Regulatory frameworks, particularly those concerning data privacy and environmental impact, play a significant role. Product substitutes, including traditional farming methods, pose a minor threat, although the benefits of increased efficiency and yield are slowly eroding this threat.
End-user segmentation is largely based on farm size and type of agricultural operation. Large-scale commercial farms are the primary adopters of digital agriculture technologies, but the market is expanding rapidly to include smaller farms as costs decrease and user-friendliness improves. Mergers and acquisitions (M&A) activity is moderately high, with an estimated xx deals per year in the past five years. Strategic acquisitions are primarily aimed at acquiring specialized technologies or expanding into new geographic markets. The high M&A activity illustrates both consolidation within the market as well as significant growth and opportunity for new entries.
Digital Agriculture Market Market Trends & Opportunities
The global Digital Agriculture market is experiencing robust growth, with an estimated market size of $xx Million in 2025 and a projected Compound Annual Growth Rate (CAGR) of xx% from 2025 to 2033. This expansion is driven by several key factors, including increasing adoption of precision farming techniques, rising demand for higher crop yields, growing concerns about food security, and the increasing availability of affordable and user-friendly digital technologies. Technological advancements, such as the development of advanced sensors, AI-powered analytics, and drone-based monitoring, are significantly accelerating market growth. Consumer preferences are shifting towards sustainable and efficient farming practices, further fueling the demand for digital solutions. The competitive landscape is characterized by a mix of established agricultural machinery manufacturers, technology companies, and specialized agri-tech startups, resulting in continuous innovation and product differentiation. Market penetration is estimated at xx% in 2025, leaving significant room for future growth, particularly in emerging economies.
Dominant Markets & Segments in Digital Agriculture Market
North America currently holds the largest market share in the Digital Agriculture sector, driven by high technological adoption rates and the presence of major industry players. However, Asia-Pacific is projected to experience the fastest growth during the forecast period due to rising agricultural needs and increasing government support for technological advancements.
- Key Growth Drivers in North America: Well-established agricultural infrastructure, supportive government policies, and early adoption of technological advancements.
- Key Growth Drivers in Asia-Pacific: Rapidly growing population, increasing demand for food security, and government initiatives promoting digital agriculture.
Other significant segments, categorized by application, demonstrate substantial growth potential:
- Crop Monitoring: The use of remote sensing technologies (satellite imagery, drones) is rapidly increasing, leading to precision-based crop management solutions.
- Variable Rate Technology: The demand for optimized resource utilization (fertilizers, water, pesticides) is driving the adoption of variable rate technology across different crops.
- Precision Farming: This comprehensive approach that encompasses various digital technologies to optimize farming operations is gaining widespread acceptance and showing exponential growth.
- Artificial Intelligence: AI-powered analytics and predictive modelling are improving decision-making, optimizing resource allocation, and improving efficiency.
- Drone Analytics: The use of drones for data acquisition, crop monitoring, and precision spraying is gaining traction, particularly in regions with challenging terrain.
Each of these segments offers significant opportunities for growth, with the market expected to witness a shift towards integrated solutions that combine multiple technologies to enhance efficiency and productivity.
Digital Agriculture Market Product Analysis
The Digital Agriculture market showcases a diverse range of products, including precision farming equipment (GPS-guided tractors, automated planting systems), sensor technologies, data analytics platforms, farm management software, and drone-based solutions. Technological advancements are driving the development of more sophisticated and integrated systems, such as AI-powered crop monitoring platforms and autonomous farm robots. These innovations are providing farmers with enhanced insights and improved decision-making capabilities, resulting in higher yields, reduced resource consumption, and increased profitability. The key competitive advantage lies in the integration of technologies, ease of use and the ability to adapt to specific needs within different agricultural environments.
Key Drivers, Barriers & Challenges in Digital Agriculture Market
Key Drivers: Technological advancements in AI, IoT, and big data analytics are revolutionizing farming practices. Government initiatives promoting digital agriculture are creating conducive environments. The growing global demand for food, coupled with concerns about climate change, further compels the adoption of efficient farming practices.
Key Challenges: High initial investment costs in technology and infrastructure can be a barrier for smaller farms. Concerns over data security and privacy, and the lack of digital literacy among farmers, also represent obstacles. The regulatory landscape is fragmented across different regions, adding complexity to adoption. Supply chain disruptions can significantly impact the availability and cost of digital agriculture solutions.
Growth Drivers in the Digital Agriculture Market Market
The Digital Agriculture market is primarily driven by increasing demand for food security and improving farming efficiency. Technological advancements in areas such as AI, IoT, and sensor technologies play a crucial role. Favorable government regulations and policies in several countries are also driving growth. Increased access to financing and farmer education are significantly impacting adoption rates.
Challenges Impacting Digital Agriculture Market Growth
High initial investment costs and a lack of digital literacy among farmers hinder widespread adoption. Cybersecurity concerns and data privacy issues limit trust and widespread implementation. Varying regulatory environments create compliance challenges across different regions, impacting market expansion. Integration of diverse systems and technologies poses a key implementation hurdle for many farmers.
Key Players Shaping the Digital Agriculture Market Market
- AGCO Corporation
- Microsoft Corporation
- Small Robot Company
- Easytosee Agtech
- Hummingbird Technologies Limited
- DTN (CLEAR AG SOLUTIONS)
- Conservis Corporation
- Case IH Agriculture (CNH Industrial America LLC)
- Raven Industries
- Deere & Company
- IBM Corporation
- Topcon Positioning Systems
- Trimble Inc
- Gamaya SA
- AgEagle Aerial Systems Inc
- Bayer CropScience AG
Significant Digital Agriculture Market Industry Milestones
- 2020: John Deere launched its fully autonomous tractor.
- 2021: Microsoft announced a significant investment in agricultural technology.
- 2022: Several mergers and acquisitions took place in the precision farming sector.
- 2023: New regulations on data privacy in the agriculture sector were introduced in Europe.
- 2024: Several significant advancements in AI-powered solutions were introduced.
Future Outlook for Digital Agriculture Market Market
The Digital Agriculture market is poised for sustained growth, driven by ongoing technological innovation, increasing adoption rates, and favorable government support. Opportunities exist in developing integrated solutions, expanding into underserved markets, and focusing on sustainability. The market will continue to see increased consolidation through mergers and acquisitions, and a surge in the development of advanced analytics capabilities. The potential for growth is substantial, promising transformative change within the agricultural industry.
Digital Agriculture Market Segmentation
- 1. Production Analysis
- 2. Consumption Analysis
- 3. Import Market Analysis (Value & Volume)
- 4. Export Market Analysis (Value & Volume)
- 5. Price Trend Analysis
Digital Agriculture Market Segmentation By Geography
-
1. North America
- 1.1. United States
- 1.2. Canada
- 1.3. Mexico
-
2. South America
- 2.1. Brazil
- 2.2. Argentina
- 2.3. Rest of South America
-
3. Europe
- 3.1. United Kingdom
- 3.2. Germany
- 3.3. France
- 3.4. Italy
- 3.5. Spain
- 3.6. Russia
- 3.7. Benelux
- 3.8. Nordics
- 3.9. Rest of Europe
-
4. Middle East & Africa
- 4.1. Turkey
- 4.2. Israel
- 4.3. GCC
- 4.4. North Africa
- 4.5. South Africa
- 4.6. Rest of Middle East & Africa
-
5. Asia Pacific
- 5.1. China
- 5.2. India
- 5.3. Japan
- 5.4. South Korea
- 5.5. ASEAN
- 5.6. Oceania
- 5.7. Rest of Asia Pacific
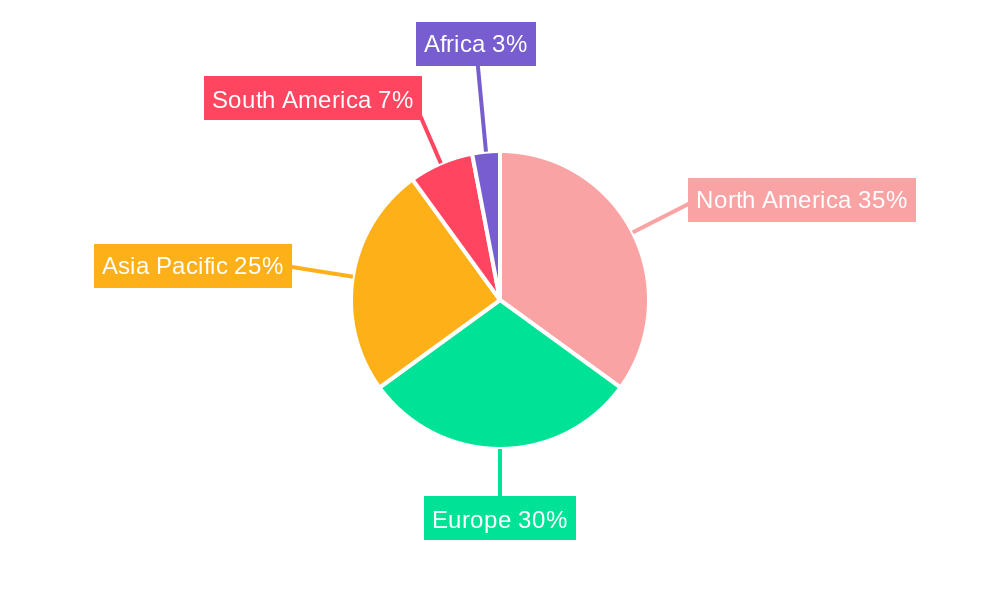
Digital Agriculture Market Regional Market Share
Geographic Coverage of Digital Agriculture Market
Digital Agriculture Market REPORT HIGHLIGHTS
| Aspects | Details |
|---|---|
| Study Period | 2020-2034 |
| Base Year | 2025 |
| Estimated Year | 2026 |
| Forecast Period | 2026-2034 |
| Historical Period | 2020-2025 |
| Growth Rate | CAGR of 10.50% from 2020-2034 |
| Segmentation |
|
Table of Contents
- 1. Introduction
- 1.1. Research Scope
- 1.2. Market Segmentation
- 1.3. Research Objective
- 1.4. Definitions and Assumptions
- 2. Executive Summary
- 2.1. Market Snapshot
- 3. Market Dynamics
- 3.1. Market Drivers
- 3.2. Market Restrains
- 3.3. Market Trends
- 3.4. Market Opportunities
- 4. Market Factor Analysis
- 4.1. Porters Five Forces
- 4.1.1. Bargaining Power of Suppliers
- 4.1.2. Bargaining Power of Buyers
- 4.1.3. Threat of New Entrants
- 4.1.4. Threat of Substitutes
- 4.1.5. Competitive Rivalry
- 4.2. PESTEL analysis
- 4.3. BCG Analysis
- 4.3.1. Stars (High Growth, High Market Share)
- 4.3.2. Cash Cows (Low Growth, High Market Share)
- 4.3.3. Question Mark (High Growth, Low Market Share)
- 4.3.4. Dogs (Low Growth, Low Market Share)
- 4.4. Ansoff Matrix Analysis
- 4.5. Supply Chain Analysis
- 4.6. Regulatory Landscape
- 4.7. Current Market Potential and Opportunity Assessment (TAM–SAM–SOM Framework)
- 4.8. TIR Analyst Note
- 4.1. Porters Five Forces
- 5. Market Analysis, Insights and Forecast 2021-2033
- 5.1. Market Analysis, Insights and Forecast - by Production Analysis
- 5.2. Market Analysis, Insights and Forecast - by Consumption Analysis
- 5.3. Market Analysis, Insights and Forecast - by Import Market Analysis (Value & Volume)
- 5.4. Market Analysis, Insights and Forecast - by Export Market Analysis (Value & Volume)
- 5.5. Market Analysis, Insights and Forecast - by Price Trend Analysis
- 5.6. Market Analysis, Insights and Forecast - by Region
- 5.6.1. North America
- 5.6.2. South America
- 5.6.3. Europe
- 5.6.4. Middle East & Africa
- 5.6.5. Asia Pacific
- 6. Global Digital Agriculture Market Analysis, Insights and Forecast, 2021-2033
- 6.1. Market Analysis, Insights and Forecast - by Production Analysis
- 6.2. Market Analysis, Insights and Forecast - by Consumption Analysis
- 6.3. Market Analysis, Insights and Forecast - by Import Market Analysis (Value & Volume)
- 6.4. Market Analysis, Insights and Forecast - by Export Market Analysis (Value & Volume)
- 6.5. Market Analysis, Insights and Forecast - by Price Trend Analysis
- 7. North America Digital Agriculture Market Analysis, Insights and Forecast, 2020-2032
- 7.1. Market Analysis, Insights and Forecast - by Production Analysis
- 7.2. Market Analysis, Insights and Forecast - by Consumption Analysis
- 7.3. Market Analysis, Insights and Forecast - by Import Market Analysis (Value & Volume)
- 7.4. Market Analysis, Insights and Forecast - by Export Market Analysis (Value & Volume)
- 7.5. Market Analysis, Insights and Forecast - by Price Trend Analysis
- 8. South America Digital Agriculture Market Analysis, Insights and Forecast, 2020-2032
- 8.1. Market Analysis, Insights and Forecast - by Production Analysis
- 8.2. Market Analysis, Insights and Forecast - by Consumption Analysis
- 8.3. Market Analysis, Insights and Forecast - by Import Market Analysis (Value & Volume)
- 8.4. Market Analysis, Insights and Forecast - by Export Market Analysis (Value & Volume)
- 8.5. Market Analysis, Insights and Forecast - by Price Trend Analysis
- 9. Europe Digital Agriculture Market Analysis, Insights and Forecast, 2020-2032
- 9.1. Market Analysis, Insights and Forecast - by Production Analysis
- 9.2. Market Analysis, Insights and Forecast - by Consumption Analysis
- 9.3. Market Analysis, Insights and Forecast - by Import Market Analysis (Value & Volume)
- 9.4. Market Analysis, Insights and Forecast - by Export Market Analysis (Value & Volume)
- 9.5. Market Analysis, Insights and Forecast - by Price Trend Analysis
- 10. Middle East & Africa Digital Agriculture Market Analysis, Insights and Forecast, 2020-2032
- 10.1. Market Analysis, Insights and Forecast - by Production Analysis
- 10.2. Market Analysis, Insights and Forecast - by Consumption Analysis
- 10.3. Market Analysis, Insights and Forecast - by Import Market Analysis (Value & Volume)
- 10.4. Market Analysis, Insights and Forecast - by Export Market Analysis (Value & Volume)
- 10.5. Market Analysis, Insights and Forecast - by Price Trend Analysis
- 11. Asia Pacific Digital Agriculture Market Analysis, Insights and Forecast, 2020-2032
- 11.1. Market Analysis, Insights and Forecast - by Production Analysis
- 11.2. Market Analysis, Insights and Forecast - by Consumption Analysis
- 11.3. Market Analysis, Insights and Forecast - by Import Market Analysis (Value & Volume)
- 11.4. Market Analysis, Insights and Forecast - by Export Market Analysis (Value & Volume)
- 11.5. Market Analysis, Insights and Forecast - by Price Trend Analysis
- 12. Competitive Analysis
- 12.1. Company Profiles
- 12.1.1 AGCO Corporation
- 12.1.1.1. Company Overview
- 12.1.1.2. Products
- 12.1.1.3. Company Financials
- 12.1.1.4. SWOT Analysis
- 12.1.2 Microsoft Corporation
- 12.1.2.1. Company Overview
- 12.1.2.2. Products
- 12.1.2.3. Company Financials
- 12.1.2.4. SWOT Analysis
- 12.1.3 Small Robot Company
- 12.1.3.1. Company Overview
- 12.1.3.2. Products
- 12.1.3.3. Company Financials
- 12.1.3.4. SWOT Analysis
- 12.1.4 Easytosee Agtech
- 12.1.4.1. Company Overview
- 12.1.4.2. Products
- 12.1.4.3. Company Financials
- 12.1.4.4. SWOT Analysis
- 12.1.5 Hummingbird Technologies Limited
- 12.1.5.1. Company Overview
- 12.1.5.2. Products
- 12.1.5.3. Company Financials
- 12.1.5.4. SWOT Analysis
- 12.1.6 DTN (CLEAR AG SOLUTIONS)
- 12.1.6.1. Company Overview
- 12.1.6.2. Products
- 12.1.6.3. Company Financials
- 12.1.6.4. SWOT Analysis
- 12.1.7 Conservis Corporation
- 12.1.7.1. Company Overview
- 12.1.7.2. Products
- 12.1.7.3. Company Financials
- 12.1.7.4. SWOT Analysis
- 12.1.8 Case IH Agriculture (CNH Industrial America LLC )
- 12.1.8.1. Company Overview
- 12.1.8.2. Products
- 12.1.8.3. Company Financials
- 12.1.8.4. SWOT Analysis
- 12.1.9 Raven Industries
- 12.1.9.1. Company Overview
- 12.1.9.2. Products
- 12.1.9.3. Company Financials
- 12.1.9.4. SWOT Analysis
- 12.1.10 Deere & Company
- 12.1.10.1. Company Overview
- 12.1.10.2. Products
- 12.1.10.3. Company Financials
- 12.1.10.4. SWOT Analysis
- 12.1.11 IBM Corporation
- 12.1.11.1. Company Overview
- 12.1.11.2. Products
- 12.1.11.3. Company Financials
- 12.1.11.4. SWOT Analysis
- 12.1.12 Topcon Positioning Systems
- 12.1.12.1. Company Overview
- 12.1.12.2. Products
- 12.1.12.3. Company Financials
- 12.1.12.4. SWOT Analysis
- 12.1.13 Trimble Inc
- 12.1.13.1. Company Overview
- 12.1.13.2. Products
- 12.1.13.3. Company Financials
- 12.1.13.4. SWOT Analysis
- 12.1.14 Gamaya SA
- 12.1.14.1. Company Overview
- 12.1.14.2. Products
- 12.1.14.3. Company Financials
- 12.1.14.4. SWOT Analysis
- 12.1.15 AgEagle Aerial Systems Inc
- 12.1.15.1. Company Overview
- 12.1.15.2. Products
- 12.1.15.3. Company Financials
- 12.1.15.4. SWOT Analysis
- 12.1.16 Bayer CropScience AG
- 12.1.16.1. Company Overview
- 12.1.16.2. Products
- 12.1.16.3. Company Financials
- 12.1.16.4. SWOT Analysis
- 12.1.1 AGCO Corporation
- 12.2. Market Entropy
- 12.2.1 Company's Key Areas Served
- 12.2.2 Recent Developments
- 12.3. Company Market Share Analysis 2025
- 12.3.1 Top 5 Companies Market Share Analysis
- 12.3.2 Top 3 Companies Market Share Analysis
- 12.4. List of Potential Customers
- 13. Research Methodology
List of Figures
- Figure 1: Global Digital Agriculture Market Revenue Breakdown (Million, %) by Region 2025 & 2033
- Figure 2: North America Digital Agriculture Market Revenue (Million), by Production Analysis 2025 & 2033
- Figure 3: North America Digital Agriculture Market Revenue Share (%), by Production Analysis 2025 & 2033
- Figure 4: North America Digital Agriculture Market Revenue (Million), by Consumption Analysis 2025 & 2033
- Figure 5: North America Digital Agriculture Market Revenue Share (%), by Consumption Analysis 2025 & 2033
- Figure 6: North America Digital Agriculture Market Revenue (Million), by Import Market Analysis (Value & Volume) 2025 & 2033
- Figure 7: North America Digital Agriculture Market Revenue Share (%), by Import Market Analysis (Value & Volume) 2025 & 2033
- Figure 8: North America Digital Agriculture Market Revenue (Million), by Export Market Analysis (Value & Volume) 2025 & 2033
- Figure 9: North America Digital Agriculture Market Revenue Share (%), by Export Market Analysis (Value & Volume) 2025 & 2033
- Figure 10: North America Digital Agriculture Market Revenue (Million), by Price Trend Analysis 2025 & 2033
- Figure 11: North America Digital Agriculture Market Revenue Share (%), by Price Trend Analysis 2025 & 2033
- Figure 12: North America Digital Agriculture Market Revenue (Million), by Country 2025 & 2033
- Figure 13: North America Digital Agriculture Market Revenue Share (%), by Country 2025 & 2033
- Figure 14: South America Digital Agriculture Market Revenue (Million), by Production Analysis 2025 & 2033
- Figure 15: South America Digital Agriculture Market Revenue Share (%), by Production Analysis 2025 & 2033
- Figure 16: South America Digital Agriculture Market Revenue (Million), by Consumption Analysis 2025 & 2033
- Figure 17: South America Digital Agriculture Market Revenue Share (%), by Consumption Analysis 2025 & 2033
- Figure 18: South America Digital Agriculture Market Revenue (Million), by Import Market Analysis (Value & Volume) 2025 & 2033
- Figure 19: South America Digital Agriculture Market Revenue Share (%), by Import Market Analysis (Value & Volume) 2025 & 2033
- Figure 20: South America Digital Agriculture Market Revenue (Million), by Export Market Analysis (Value & Volume) 2025 & 2033
- Figure 21: South America Digital Agriculture Market Revenue Share (%), by Export Market Analysis (Value & Volume) 2025 & 2033
- Figure 22: South America Digital Agriculture Market Revenue (Million), by Price Trend Analysis 2025 & 2033
- Figure 23: South America Digital Agriculture Market Revenue Share (%), by Price Trend Analysis 2025 & 2033
- Figure 24: South America Digital Agriculture Market Revenue (Million), by Country 2025 & 2033
- Figure 25: South America Digital Agriculture Market Revenue Share (%), by Country 2025 & 2033
- Figure 26: Europe Digital Agriculture Market Revenue (Million), by Production Analysis 2025 & 2033
- Figure 27: Europe Digital Agriculture Market Revenue Share (%), by Production Analysis 2025 & 2033
- Figure 28: Europe Digital Agriculture Market Revenue (Million), by Consumption Analysis 2025 & 2033
- Figure 29: Europe Digital Agriculture Market Revenue Share (%), by Consumption Analysis 2025 & 2033
- Figure 30: Europe Digital Agriculture Market Revenue (Million), by Import Market Analysis (Value & Volume) 2025 & 2033
- Figure 31: Europe Digital Agriculture Market Revenue Share (%), by Import Market Analysis (Value & Volume) 2025 & 2033
- Figure 32: Europe Digital Agriculture Market Revenue (Million), by Export Market Analysis (Value & Volume) 2025 & 2033
- Figure 33: Europe Digital Agriculture Market Revenue Share (%), by Export Market Analysis (Value & Volume) 2025 & 2033
- Figure 34: Europe Digital Agriculture Market Revenue (Million), by Price Trend Analysis 2025 & 2033
- Figure 35: Europe Digital Agriculture Market Revenue Share (%), by Price Trend Analysis 2025 & 2033
- Figure 36: Europe Digital Agriculture Market Revenue (Million), by Country 2025 & 2033
- Figure 37: Europe Digital Agriculture Market Revenue Share (%), by Country 2025 & 2033
- Figure 38: Middle East & Africa Digital Agriculture Market Revenue (Million), by Production Analysis 2025 & 2033
- Figure 39: Middle East & Africa Digital Agriculture Market Revenue Share (%), by Production Analysis 2025 & 2033
- Figure 40: Middle East & Africa Digital Agriculture Market Revenue (Million), by Consumption Analysis 2025 & 2033
- Figure 41: Middle East & Africa Digital Agriculture Market Revenue Share (%), by Consumption Analysis 2025 & 2033
- Figure 42: Middle East & Africa Digital Agriculture Market Revenue (Million), by Import Market Analysis (Value & Volume) 2025 & 2033
- Figure 43: Middle East & Africa Digital Agriculture Market Revenue Share (%), by Import Market Analysis (Value & Volume) 2025 & 2033
- Figure 44: Middle East & Africa Digital Agriculture Market Revenue (Million), by Export Market Analysis (Value & Volume) 2025 & 2033
- Figure 45: Middle East & Africa Digital Agriculture Market Revenue Share (%), by Export Market Analysis (Value & Volume) 2025 & 2033
- Figure 46: Middle East & Africa Digital Agriculture Market Revenue (Million), by Price Trend Analysis 2025 & 2033
- Figure 47: Middle East & Africa Digital Agriculture Market Revenue Share (%), by Price Trend Analysis 2025 & 2033
- Figure 48: Middle East & Africa Digital Agriculture Market Revenue (Million), by Country 2025 & 2033
- Figure 49: Middle East & Africa Digital Agriculture Market Revenue Share (%), by Country 2025 & 2033
- Figure 50: Asia Pacific Digital Agriculture Market Revenue (Million), by Production Analysis 2025 & 2033
- Figure 51: Asia Pacific Digital Agriculture Market Revenue Share (%), by Production Analysis 2025 & 2033
- Figure 52: Asia Pacific Digital Agriculture Market Revenue (Million), by Consumption Analysis 2025 & 2033
- Figure 53: Asia Pacific Digital Agriculture Market Revenue Share (%), by Consumption Analysis 2025 & 2033
- Figure 54: Asia Pacific Digital Agriculture Market Revenue (Million), by Import Market Analysis (Value & Volume) 2025 & 2033
- Figure 55: Asia Pacific Digital Agriculture Market Revenue Share (%), by Import Market Analysis (Value & Volume) 2025 & 2033
- Figure 56: Asia Pacific Digital Agriculture Market Revenue (Million), by Export Market Analysis (Value & Volume) 2025 & 2033
- Figure 57: Asia Pacific Digital Agriculture Market Revenue Share (%), by Export Market Analysis (Value & Volume) 2025 & 2033
- Figure 58: Asia Pacific Digital Agriculture Market Revenue (Million), by Price Trend Analysis 2025 & 2033
- Figure 59: Asia Pacific Digital Agriculture Market Revenue Share (%), by Price Trend Analysis 2025 & 2033
- Figure 60: Asia Pacific Digital Agriculture Market Revenue (Million), by Country 2025 & 2033
- Figure 61: Asia Pacific Digital Agriculture Market Revenue Share (%), by Country 2025 & 2033
List of Tables
- Table 1: Global Digital Agriculture Market Revenue Million Forecast, by Production Analysis 2020 & 2033
- Table 2: Global Digital Agriculture Market Revenue Million Forecast, by Consumption Analysis 2020 & 2033
- Table 3: Global Digital Agriculture Market Revenue Million Forecast, by Import Market Analysis (Value & Volume) 2020 & 2033
- Table 4: Global Digital Agriculture Market Revenue Million Forecast, by Export Market Analysis (Value & Volume) 2020 & 2033
- Table 5: Global Digital Agriculture Market Revenue Million Forecast, by Price Trend Analysis 2020 & 2033
- Table 6: Global Digital Agriculture Market Revenue Million Forecast, by Region 2020 & 2033
- Table 7: Global Digital Agriculture Market Revenue Million Forecast, by Production Analysis 2020 & 2033
- Table 8: Global Digital Agriculture Market Revenue Million Forecast, by Consumption Analysis 2020 & 2033
- Table 9: Global Digital Agriculture Market Revenue Million Forecast, by Import Market Analysis (Value & Volume) 2020 & 2033
- Table 10: Global Digital Agriculture Market Revenue Million Forecast, by Export Market Analysis (Value & Volume) 2020 & 2033
- Table 11: Global Digital Agriculture Market Revenue Million Forecast, by Price Trend Analysis 2020 & 2033
- Table 12: Global Digital Agriculture Market Revenue Million Forecast, by Country 2020 & 2033
- Table 13: United States Digital Agriculture Market Revenue (Million) Forecast, by Application 2020 & 2033
- Table 14: Canada Digital Agriculture Market Revenue (Million) Forecast, by Application 2020 & 2033
- Table 15: Mexico Digital Agriculture Market Revenue (Million) Forecast, by Application 2020 & 2033
- Table 16: Global Digital Agriculture Market Revenue Million Forecast, by Production Analysis 2020 & 2033
- Table 17: Global Digital Agriculture Market Revenue Million Forecast, by Consumption Analysis 2020 & 2033
- Table 18: Global Digital Agriculture Market Revenue Million Forecast, by Import Market Analysis (Value & Volume) 2020 & 2033
- Table 19: Global Digital Agriculture Market Revenue Million Forecast, by Export Market Analysis (Value & Volume) 2020 & 2033
- Table 20: Global Digital Agriculture Market Revenue Million Forecast, by Price Trend Analysis 2020 & 2033
- Table 21: Global Digital Agriculture Market Revenue Million Forecast, by Country 2020 & 2033
- Table 22: Brazil Digital Agriculture Market Revenue (Million) Forecast, by Application 2020 & 2033
- Table 23: Argentina Digital Agriculture Market Revenue (Million) Forecast, by Application 2020 & 2033
- Table 24: Rest of South America Digital Agriculture Market Revenue (Million) Forecast, by Application 2020 & 2033
- Table 25: Global Digital Agriculture Market Revenue Million Forecast, by Production Analysis 2020 & 2033
- Table 26: Global Digital Agriculture Market Revenue Million Forecast, by Consumption Analysis 2020 & 2033
- Table 27: Global Digital Agriculture Market Revenue Million Forecast, by Import Market Analysis (Value & Volume) 2020 & 2033
- Table 28: Global Digital Agriculture Market Revenue Million Forecast, by Export Market Analysis (Value & Volume) 2020 & 2033
- Table 29: Global Digital Agriculture Market Revenue Million Forecast, by Price Trend Analysis 2020 & 2033
- Table 30: Global Digital Agriculture Market Revenue Million Forecast, by Country 2020 & 2033
- Table 31: United Kingdom Digital Agriculture Market Revenue (Million) Forecast, by Application 2020 & 2033
- Table 32: Germany Digital Agriculture Market Revenue (Million) Forecast, by Application 2020 & 2033
- Table 33: France Digital Agriculture Market Revenue (Million) Forecast, by Application 2020 & 2033
- Table 34: Italy Digital Agriculture Market Revenue (Million) Forecast, by Application 2020 & 2033
- Table 35: Spain Digital Agriculture Market Revenue (Million) Forecast, by Application 2020 & 2033
- Table 36: Russia Digital Agriculture Market Revenue (Million) Forecast, by Application 2020 & 2033
- Table 37: Benelux Digital Agriculture Market Revenue (Million) Forecast, by Application 2020 & 2033
- Table 38: Nordics Digital Agriculture Market Revenue (Million) Forecast, by Application 2020 & 2033
- Table 39: Rest of Europe Digital Agriculture Market Revenue (Million) Forecast, by Application 2020 & 2033
- Table 40: Global Digital Agriculture Market Revenue Million Forecast, by Production Analysis 2020 & 2033
- Table 41: Global Digital Agriculture Market Revenue Million Forecast, by Consumption Analysis 2020 & 2033
- Table 42: Global Digital Agriculture Market Revenue Million Forecast, by Import Market Analysis (Value & Volume) 2020 & 2033
- Table 43: Global Digital Agriculture Market Revenue Million Forecast, by Export Market Analysis (Value & Volume) 2020 & 2033
- Table 44: Global Digital Agriculture Market Revenue Million Forecast, by Price Trend Analysis 2020 & 2033
- Table 45: Global Digital Agriculture Market Revenue Million Forecast, by Country 2020 & 2033
- Table 46: Turkey Digital Agriculture Market Revenue (Million) Forecast, by Application 2020 & 2033
- Table 47: Israel Digital Agriculture Market Revenue (Million) Forecast, by Application 2020 & 2033
- Table 48: GCC Digital Agriculture Market Revenue (Million) Forecast, by Application 2020 & 2033
- Table 49: North Africa Digital Agriculture Market Revenue (Million) Forecast, by Application 2020 & 2033
- Table 50: South Africa Digital Agriculture Market Revenue (Million) Forecast, by Application 2020 & 2033
- Table 51: Rest of Middle East & Africa Digital Agriculture Market Revenue (Million) Forecast, by Application 2020 & 2033
- Table 52: Global Digital Agriculture Market Revenue Million Forecast, by Production Analysis 2020 & 2033
- Table 53: Global Digital Agriculture Market Revenue Million Forecast, by Consumption Analysis 2020 & 2033
- Table 54: Global Digital Agriculture Market Revenue Million Forecast, by Import Market Analysis (Value & Volume) 2020 & 2033
- Table 55: Global Digital Agriculture Market Revenue Million Forecast, by Export Market Analysis (Value & Volume) 2020 & 2033
- Table 56: Global Digital Agriculture Market Revenue Million Forecast, by Price Trend Analysis 2020 & 2033
- Table 57: Global Digital Agriculture Market Revenue Million Forecast, by Country 2020 & 2033
- Table 58: China Digital Agriculture Market Revenue (Million) Forecast, by Application 2020 & 2033
- Table 59: India Digital Agriculture Market Revenue (Million) Forecast, by Application 2020 & 2033
- Table 60: Japan Digital Agriculture Market Revenue (Million) Forecast, by Application 2020 & 2033
- Table 61: South Korea Digital Agriculture Market Revenue (Million) Forecast, by Application 2020 & 2033
- Table 62: ASEAN Digital Agriculture Market Revenue (Million) Forecast, by Application 2020 & 2033
- Table 63: Oceania Digital Agriculture Market Revenue (Million) Forecast, by Application 2020 & 2033
- Table 64: Rest of Asia Pacific Digital Agriculture Market Revenue (Million) Forecast, by Application 2020 & 2033
Frequently Asked Questions
1. What is the projected Compound Annual Growth Rate (CAGR) of the Digital Agriculture Market?
The projected CAGR is approximately 10.50%.
2. Which companies are prominent players in the Digital Agriculture Market?
Key companies in the market include AGCO Corporation, Microsoft Corporation, Small Robot Company, Easytosee Agtech, Hummingbird Technologies Limited, DTN (CLEAR AG SOLUTIONS), Conservis Corporation, Case IH Agriculture (CNH Industrial America LLC ), Raven Industries, Deere & Company, IBM Corporation, Topcon Positioning Systems, Trimble Inc, Gamaya SA, AgEagle Aerial Systems Inc, Bayer CropScience AG.
3. What are the main segments of the Digital Agriculture Market?
The market segments include Production Analysis, Consumption Analysis, Import Market Analysis (Value & Volume), Export Market Analysis (Value & Volume), Price Trend Analysis.
4. Can you provide details about the market size?
The market size is estimated to be USD 20.01 Million as of 2022.
5. What are some drivers contributing to market growth?
; Awareness About Health Benefits Associated With Pecan Consumption; Wide Application of Pecan.
6. What are the notable trends driving market growth?
Increasing Pressure for Higher Productivity and Improved Crop Health.
7. Are there any restraints impacting market growth?
; Volatility in the Prices; Adverse Weather Conditions Affecting Yield.
8. Can you provide examples of recent developments in the market?
N/A
9. What pricing options are available for accessing the report?
Pricing options include single-user, multi-user, and enterprise licenses priced at USD 4750, USD 5250, and USD 8750 respectively.
10. Is the market size provided in terms of value or volume?
The market size is provided in terms of value, measured in Million.
11. Are there any specific market keywords associated with the report?
Yes, the market keyword associated with the report is "Digital Agriculture Market," which aids in identifying and referencing the specific market segment covered.
12. How do I determine which pricing option suits my needs best?
The pricing options vary based on user requirements and access needs. Individual users may opt for single-user licenses, while businesses requiring broader access may choose multi-user or enterprise licenses for cost-effective access to the report.
13. Are there any additional resources or data provided in the Digital Agriculture Market report?
While the report offers comprehensive insights, it's advisable to review the specific contents or supplementary materials provided to ascertain if additional resources or data are available.
14. How can I stay updated on further developments or reports in the Digital Agriculture Market?
To stay informed about further developments, trends, and reports in the Digital Agriculture Market, consider subscribing to industry newsletters, following relevant companies and organizations, or regularly checking reputable industry news sources and publications.
Methodology
Step 1 - Identification of Relevant Samples Size from Population Database


Step 2 - Approaches for Defining Global Market Size (Value, Volume* & Price*)

Note*: In applicable scenarios
Step 3 - Data Sources
Primary Research
- Web Analytics
- Survey Reports
- Research Institute
- Latest Research Reports
- Opinion Leaders
Secondary Research
- Annual Reports
- White Paper
- Latest Press Release
- Industry Association
- Paid Database
- Investor Presentations

Step 4 - Data Triangulation
Involves using different sources of information in order to increase the validity of a study
These sources are likely to be stakeholders in a program - participants, other researchers, program staff, other community members, and so on.
Then we put all data in single framework & apply various statistical tools to find out the dynamic on the market.
During the analysis stage, feedback from the stakeholder groups would be compared to determine areas of agreement as well as areas of divergence