

Key Insights
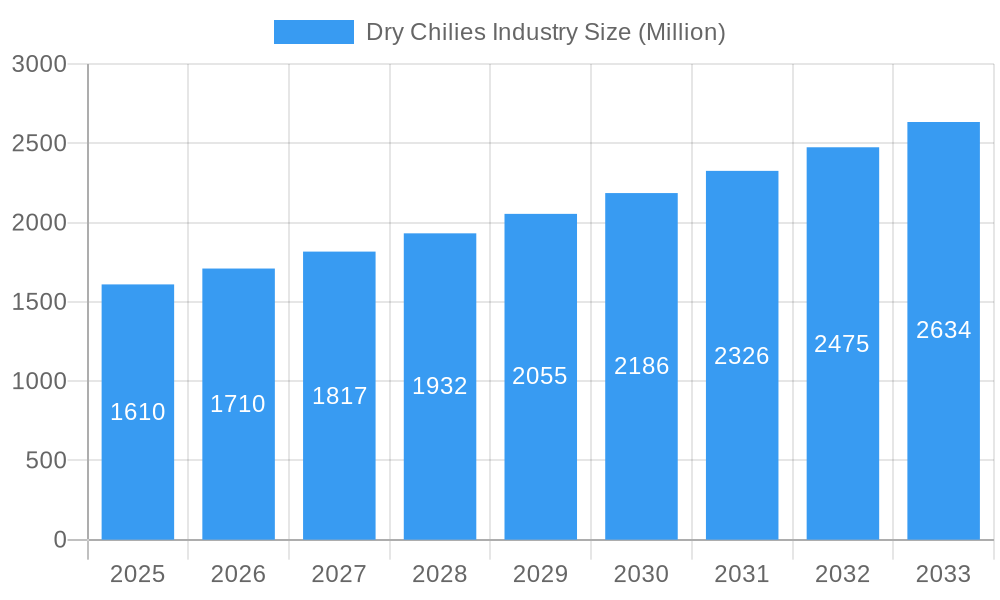
The global dry chilies market, valued at $1.61 billion in 2025, is projected to experience robust growth, driven by rising demand from the food and beverage industry, particularly in developing economies with burgeoning culinary traditions. The increasing use of chilies as a key ingredient in various processed foods, sauces, and spices fuels this expansion. Furthermore, the growing popularity of spicy cuisine globally and the exploration of chili's health benefits, including antioxidant properties and potential medicinal applications in pharmaceuticals and cosmetics, contribute to market dynamism. The market segmentation reveals strong demand across product types, with Guajillo, Ancho, Chipotle, Pasilla, and California chilies leading the way. Geographical distribution showcases a significant presence across North America, Europe, and Asia-Pacific, with considerable growth potential in emerging Asian markets like India and Southeast Asia due to high consumption rates and expanding manufacturing capabilities. While factors like fluctuating chili prices and weather patterns impacting harvests pose potential restraints, the overall outlook remains optimistic, given the ongoing expansion of the food processing industry and innovative applications in diverse sectors. A compound annual growth rate (CAGR) of 6.11% is anticipated from 2025 to 2033, indicating a steadily increasing market value.
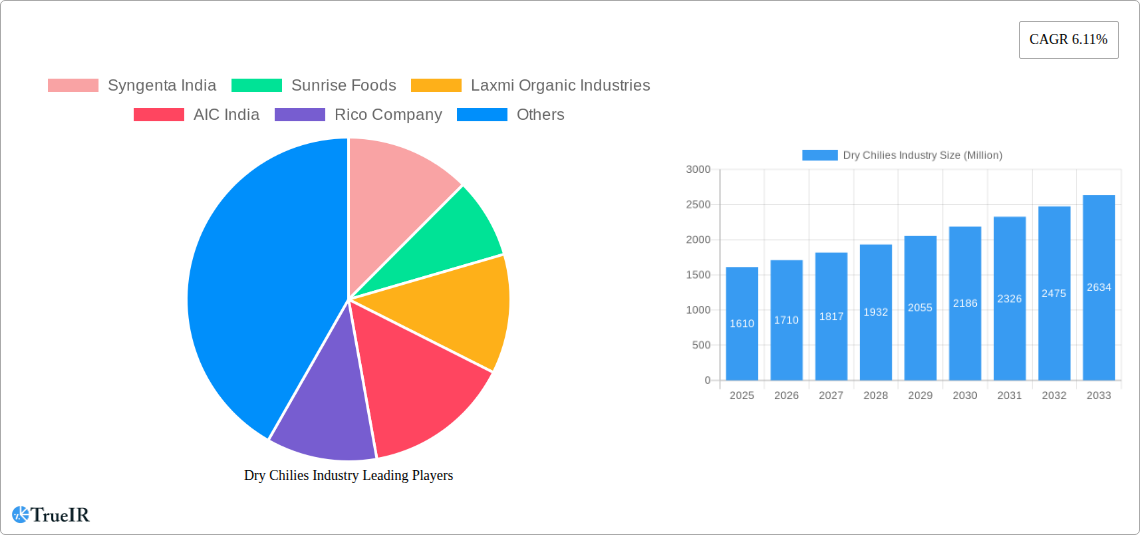
Dry Chilies Industry Market Size (In Billion)
The competitive landscape features a mix of large multinational corporations like Syngenta India and smaller regional players like Sunrise Foods and Laxmi Organic Industries, indicating opportunities for both established brands and emerging businesses. The significant presence of companies focused on agriculture and food processing underscores the industry's vertical integration and its dependency on stable supply chains. Future growth will likely be influenced by technological advancements in chili cultivation and processing, sustainable farming practices, and evolving consumer preferences for organic and ethically sourced products. Further research into the specific market drivers and trends within each geographical region will provide a more granular understanding of the opportunities and challenges within the dry chilies market. This detailed analysis will enable stakeholders to make informed decisions regarding investments, product development, and market penetration strategies.
Dry Chilies Industry Company Market Share
Dry Chilies Industry Market Report: 2019-2033
This comprehensive report provides a detailed analysis of the global dry chilies industry, offering invaluable insights for stakeholders seeking to understand market dynamics, growth opportunities, and competitive landscapes. With a study period spanning 2019-2033, a base year of 2025, and a forecast period of 2025-2033, this report offers a robust understanding of the past, present, and future of the dry chilies market. The market size in 2025 is estimated at $XX Million.
Dry Chilies Industry Market Structure & Competitive Landscape
The global dry chilies market exhibits a moderately concentrated structure, with a handful of major players commanding significant market share. The Herfindahl-Hirschman Index (HHI) is estimated at xx, suggesting a moderately competitive landscape. Key players, including Syngenta India, Sunrise Foods, Laxmi Organic Industries, AIC India, and Rico Company, actively compete through product differentiation, branding, and distribution networks. Innovation plays a crucial role, driving the development of new chili varieties with enhanced flavor profiles, improved yields, and extended shelf life. Regulatory frameworks related to food safety and pesticide residues significantly impact market operations. Product substitutes, such as other spices and flavor enhancers, pose a competitive threat. The end-user segmentation primarily consists of the food and beverage industry, with growing demand also emerging from pharmaceuticals and cosmetics sectors. The market has witnessed xx M&A activities in the past five years, reflecting consolidation efforts and strategic expansion strategies among key players.
- Market Concentration: Moderately concentrated, with HHI estimated at xx.
- Innovation Drivers: Development of new chili varieties, improved processing techniques.
- Regulatory Impacts: Food safety standards, pesticide residue regulations.
- Product Substitutes: Other spices and flavor enhancers.
- End-User Segmentation: Food and beverage (major segment), pharmaceuticals, cosmetics, pesticides.
- M&A Trends: xx M&A activities over the last five years.
Dry Chilies Industry Market Trends & Opportunities
The global dry chilies market is experiencing robust growth, driven by factors such as rising demand from the food and beverage sector and increasing use in various non-food applications, such as pharmaceuticals and cosmetics. The market size is projected to reach $XX Million by 2033, registering a CAGR of xx% during the forecast period. Technological advancements in cultivation techniques, processing methods, and packaging solutions are enhancing efficiency and product quality. Changing consumer preferences towards healthier and more diverse food options are fueling demand for various chili types. Competitive dynamics are shaped by pricing strategies, innovation, and brand building. Market penetration rates for dry chilies in emerging markets remain relatively high and continue to increase due to rising disposable incomes. The overall market shows strong potential for growth, supported by increasing awareness of the health benefits associated with the consumption of chili peppers and the growing popularity of spicy foods globally.
Dominant Markets & Segments in Dry Chilies Industry
The food and beverage industry constitutes the largest application segment, accounting for approximately xx% of total consumption. Within product types, the Guajillo, Ancho, and Chipotle varieties exhibit significant market dominance due to their diverse culinary applications and unique flavor profiles. Geographically, xx region currently holds the leading position, driven by robust domestic demand, favorable climatic conditions for chili cultivation, and efficient distribution channels.
Key Growth Drivers in Leading Regions:
- Infrastructure: Efficient transportation networks, advanced processing facilities.
- Policies: Government support for chili cultivation, favorable trade policies.
- Consumer Preferences: Growing demand for spicy food, increasing culinary diversification.
Market Dominance Analysis: The xx region’s dominance is attributed to [detailed paragraph explaining factors driving market leadership, including production capacity, consumer demand, and export opportunities].
Dry Chilies Industry Product Analysis
Product innovation in the dry chilies industry focuses on developing new chili varieties with enhanced flavor profiles, improved yield, and extended shelf life. Technological advancements in drying and processing techniques minimize microbial contamination, ensure consistent quality, and extend product shelf life. Value-added products, such as chili flakes, powders, and pastes, are gaining popularity, driving premium segment growth. The market is also witnessing the introduction of organic and sustainably sourced dry chilies, appealing to health-conscious consumers.
Key Drivers, Barriers & Challenges in Dry Chilies Industry
Key Drivers:
- Technological advancements in cultivation and processing.
- Growing demand for spicy food globally.
- Increasing applications in non-food industries (pharmaceuticals, cosmetics).
- Favorable government policies supporting chili farming.
Challenges and Restraints:
- Fluctuations in chili prices due to unpredictable weather patterns.
- Supply chain disruptions and logistical challenges.
- Stringent food safety regulations and quality control standards.
- Intense competition from other spices and flavoring agents. xx% of market share has been lost to substitutes in the last three years.
Growth Drivers in the Dry Chilies Industry Market
The industry's growth is propelled by technological improvements in cultivation and processing, leading to higher yields and better product quality. The global rise in demand for spicy foods, particularly in developing economies, is a key driver. Government initiatives supporting chili farmers through subsidies and improved infrastructure further stimulate growth. Diversification into new applications, beyond the traditional food and beverage sector, also contributes to market expansion.
Challenges Impacting Dry Chilies Industry Growth
Challenges include the vulnerability of chili production to unpredictable weather patterns, leading to price fluctuations and supply chain disruptions. Stringent food safety regulations and quality control measures pose compliance costs for producers. Intense competition from substitute products and other spices necessitates continuous innovation and efficient cost management to maintain market share.
Key Players Shaping the Dry Chilies Industry Market
- Syngenta India
- Sunrise Foods
- Laxmi Organic Industries
- AIC India
- Rico Company
Significant Dry Chilies Industry Industry Milestones
- November 2022: The Indonesian government implemented strategic policies to boost domestic chili production, including the use of hybrid seeds, improved irrigation, and expanded farming infrastructure, reducing reliance on imports. This is expected to impact the global market by reducing export volumes from Indonesia and increasing competition for other exporting nations.
- June 2022: Syngenta India partnered with the Agriculture Insurance Company of India (AIC) to protect farmers from price volatility, fostering increased chili production and market stability. This initiative reduces the risk faced by farmers, leading to more consistent supply.
Future Outlook for Dry Chilies Industry Market
The dry chilies industry is poised for sustained growth, driven by continued expansion in food and beverage applications, coupled with penetration into new markets and applications. Strategic investments in technology, sustainable farming practices, and value-added product development will shape the future competitive landscape. The industry's future hinges on addressing challenges related to supply chain resilience, climate change adaptation, and maintaining consistent quality standards. The market is projected to reach $XX Million by 2033, representing significant growth potential.
Dry Chilies Industry Segmentation
- 1. Production Analysis
- 2. Consumption Analysis
- 3. Import Market Analysis (Value & Volume)
- 4. Export Market Analysis (Value & Volume)
- 5. Price Trend Analysis
Dry Chilies Industry Segmentation By Geography
-
1. North America
- 1.1. United States
- 1.2. Canada
- 1.3. Mexico
-
2. Europe
- 2.1. United Kingdom
- 2.2. Germany
- 2.3. France
- 2.4. Spain
-
3. Asia Pacific
- 3.1. China
- 3.2. Australia
- 3.3. India
-
4. South America
- 4.1. Brazil
- 4.2. Argentina
-
5. Africa
- 5.1. South Africa
- 5.2. Egypt
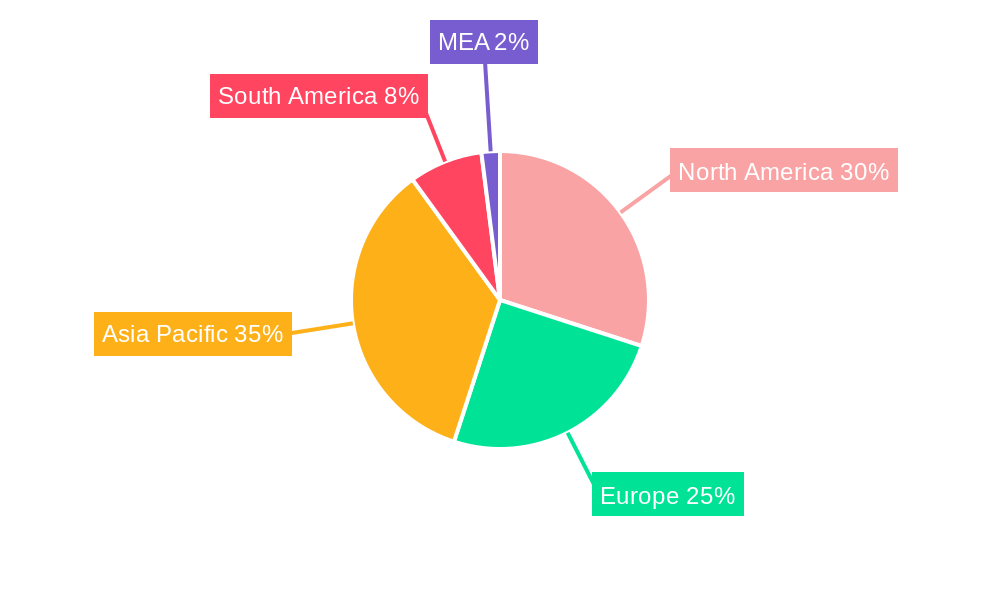
Dry Chilies Industry Regional Market Share
Geographic Coverage of Dry Chilies Industry
Dry Chilies Industry REPORT HIGHLIGHTS
| Aspects | Details |
|---|---|
| Study Period | 2020-2034 |
| Base Year | 2025 |
| Estimated Year | 2026 |
| Forecast Period | 2026-2034 |
| Historical Period | 2020-2025 |
| Growth Rate | CAGR of 6.11% from 2020-2034 |
| Segmentation |
|
Table of Contents
- 1. Introduction
- 1.1. Research Scope
- 1.2. Market Segmentation
- 1.3. Research Methodology
- 1.4. Definitions and Assumptions
- 2. Executive Summary
- 2.1. Introduction
- 3. Market Dynamics
- 3.1. Introduction
- 3.2. Market Drivers
- 3.2.1. Increasing Berry Consumption for Health Benefits; Increasing Adoption of High-Technology Farm Practices; Growing Usage of Berries in the Food and Beverage Industries
- 3.3. Market Restrains
- 3.3.1. High Production Cost Involved in Berry Production; Increasing Disease and Pest Infestations
- 3.4. Market Trends
- 3.4.1. High Demand for the Exotic and Spicy Oriental Dishes
- 4. Market Factor Analysis
- 4.1. Porters Five Forces
- 4.2. Supply/Value Chain
- 4.3. PESTEL analysis
- 4.4. Market Entropy
- 4.5. Patent/Trademark Analysis
- 5. Global Dry Chilies Industry Analysis, Insights and Forecast, 2020-2032
- 5.1. Market Analysis, Insights and Forecast - by Production Analysis
- 5.2. Market Analysis, Insights and Forecast - by Consumption Analysis
- 5.3. Market Analysis, Insights and Forecast - by Import Market Analysis (Value & Volume)
- 5.4. Market Analysis, Insights and Forecast - by Export Market Analysis (Value & Volume)
- 5.5. Market Analysis, Insights and Forecast - by Price Trend Analysis
- 5.6. Market Analysis, Insights and Forecast - by Region
- 5.6.1. North America
- 5.6.2. Europe
- 5.6.3. Asia Pacific
- 5.6.4. South America
- 5.6.5. Africa
- 5.1. Market Analysis, Insights and Forecast - by Production Analysis
- 6. North America Dry Chilies Industry Analysis, Insights and Forecast, 2020-2032
- 6.1. Market Analysis, Insights and Forecast - by Production Analysis
- 6.2. Market Analysis, Insights and Forecast - by Consumption Analysis
- 6.3. Market Analysis, Insights and Forecast - by Import Market Analysis (Value & Volume)
- 6.4. Market Analysis, Insights and Forecast - by Export Market Analysis (Value & Volume)
- 6.5. Market Analysis, Insights and Forecast - by Price Trend Analysis
- 6.1. Market Analysis, Insights and Forecast - by Production Analysis
- 7. Europe Dry Chilies Industry Analysis, Insights and Forecast, 2020-2032
- 7.1. Market Analysis, Insights and Forecast - by Production Analysis
- 7.2. Market Analysis, Insights and Forecast - by Consumption Analysis
- 7.3. Market Analysis, Insights and Forecast - by Import Market Analysis (Value & Volume)
- 7.4. Market Analysis, Insights and Forecast - by Export Market Analysis (Value & Volume)
- 7.5. Market Analysis, Insights and Forecast - by Price Trend Analysis
- 7.1. Market Analysis, Insights and Forecast - by Production Analysis
- 8. Asia Pacific Dry Chilies Industry Analysis, Insights and Forecast, 2020-2032
- 8.1. Market Analysis, Insights and Forecast - by Production Analysis
- 8.2. Market Analysis, Insights and Forecast - by Consumption Analysis
- 8.3. Market Analysis, Insights and Forecast - by Import Market Analysis (Value & Volume)
- 8.4. Market Analysis, Insights and Forecast - by Export Market Analysis (Value & Volume)
- 8.5. Market Analysis, Insights and Forecast - by Price Trend Analysis
- 8.1. Market Analysis, Insights and Forecast - by Production Analysis
- 9. South America Dry Chilies Industry Analysis, Insights and Forecast, 2020-2032
- 9.1. Market Analysis, Insights and Forecast - by Production Analysis
- 9.2. Market Analysis, Insights and Forecast - by Consumption Analysis
- 9.3. Market Analysis, Insights and Forecast - by Import Market Analysis (Value & Volume)
- 9.4. Market Analysis, Insights and Forecast - by Export Market Analysis (Value & Volume)
- 9.5. Market Analysis, Insights and Forecast - by Price Trend Analysis
- 9.1. Market Analysis, Insights and Forecast - by Production Analysis
- 10. Africa Dry Chilies Industry Analysis, Insights and Forecast, 2020-2032
- 10.1. Market Analysis, Insights and Forecast - by Production Analysis
- 10.2. Market Analysis, Insights and Forecast - by Consumption Analysis
- 10.3. Market Analysis, Insights and Forecast - by Import Market Analysis (Value & Volume)
- 10.4. Market Analysis, Insights and Forecast - by Export Market Analysis (Value & Volume)
- 10.5. Market Analysis, Insights and Forecast - by Price Trend Analysis
- 10.1. Market Analysis, Insights and Forecast - by Production Analysis
- 11. Competitive Analysis
- 11.1. Global Market Share Analysis 2025
- 11.2. Company Profiles
- 11.2.1 Syngenta India
- 11.2.1.1. Overview
- 11.2.1.2. Products
- 11.2.1.3. SWOT Analysis
- 11.2.1.4. Recent Developments
- 11.2.1.5. Financials (Based on Availability)
- 11.2.2 Sunrise Foods
- 11.2.2.1. Overview
- 11.2.2.2. Products
- 11.2.2.3. SWOT Analysis
- 11.2.2.4. Recent Developments
- 11.2.2.5. Financials (Based on Availability)
- 11.2.3 Laxmi Organic Industries
- 11.2.3.1. Overview
- 11.2.3.2. Products
- 11.2.3.3. SWOT Analysis
- 11.2.3.4. Recent Developments
- 11.2.3.5. Financials (Based on Availability)
- 11.2.4 AIC India
- 11.2.4.1. Overview
- 11.2.4.2. Products
- 11.2.4.3. SWOT Analysis
- 11.2.4.4. Recent Developments
- 11.2.4.5. Financials (Based on Availability)
- 11.2.5 Rico Company
- 11.2.5.1. Overview
- 11.2.5.2. Products
- 11.2.5.3. SWOT Analysis
- 11.2.5.4. Recent Developments
- 11.2.5.5. Financials (Based on Availability)
- 11.2.1 Syngenta India
List of Figures
- Figure 1: Global Dry Chilies Industry Revenue Breakdown (Million, %) by Region 2025 & 2033
- Figure 2: North America Dry Chilies Industry Revenue (Million), by Production Analysis 2025 & 2033
- Figure 3: North America Dry Chilies Industry Revenue Share (%), by Production Analysis 2025 & 2033
- Figure 4: North America Dry Chilies Industry Revenue (Million), by Consumption Analysis 2025 & 2033
- Figure 5: North America Dry Chilies Industry Revenue Share (%), by Consumption Analysis 2025 & 2033
- Figure 6: North America Dry Chilies Industry Revenue (Million), by Import Market Analysis (Value & Volume) 2025 & 2033
- Figure 7: North America Dry Chilies Industry Revenue Share (%), by Import Market Analysis (Value & Volume) 2025 & 2033
- Figure 8: North America Dry Chilies Industry Revenue (Million), by Export Market Analysis (Value & Volume) 2025 & 2033
- Figure 9: North America Dry Chilies Industry Revenue Share (%), by Export Market Analysis (Value & Volume) 2025 & 2033
- Figure 10: North America Dry Chilies Industry Revenue (Million), by Price Trend Analysis 2025 & 2033
- Figure 11: North America Dry Chilies Industry Revenue Share (%), by Price Trend Analysis 2025 & 2033
- Figure 12: North America Dry Chilies Industry Revenue (Million), by Country 2025 & 2033
- Figure 13: North America Dry Chilies Industry Revenue Share (%), by Country 2025 & 2033
- Figure 14: Europe Dry Chilies Industry Revenue (Million), by Production Analysis 2025 & 2033
- Figure 15: Europe Dry Chilies Industry Revenue Share (%), by Production Analysis 2025 & 2033
- Figure 16: Europe Dry Chilies Industry Revenue (Million), by Consumption Analysis 2025 & 2033
- Figure 17: Europe Dry Chilies Industry Revenue Share (%), by Consumption Analysis 2025 & 2033
- Figure 18: Europe Dry Chilies Industry Revenue (Million), by Import Market Analysis (Value & Volume) 2025 & 2033
- Figure 19: Europe Dry Chilies Industry Revenue Share (%), by Import Market Analysis (Value & Volume) 2025 & 2033
- Figure 20: Europe Dry Chilies Industry Revenue (Million), by Export Market Analysis (Value & Volume) 2025 & 2033
- Figure 21: Europe Dry Chilies Industry Revenue Share (%), by Export Market Analysis (Value & Volume) 2025 & 2033
- Figure 22: Europe Dry Chilies Industry Revenue (Million), by Price Trend Analysis 2025 & 2033
- Figure 23: Europe Dry Chilies Industry Revenue Share (%), by Price Trend Analysis 2025 & 2033
- Figure 24: Europe Dry Chilies Industry Revenue (Million), by Country 2025 & 2033
- Figure 25: Europe Dry Chilies Industry Revenue Share (%), by Country 2025 & 2033
- Figure 26: Asia Pacific Dry Chilies Industry Revenue (Million), by Production Analysis 2025 & 2033
- Figure 27: Asia Pacific Dry Chilies Industry Revenue Share (%), by Production Analysis 2025 & 2033
- Figure 28: Asia Pacific Dry Chilies Industry Revenue (Million), by Consumption Analysis 2025 & 2033
- Figure 29: Asia Pacific Dry Chilies Industry Revenue Share (%), by Consumption Analysis 2025 & 2033
- Figure 30: Asia Pacific Dry Chilies Industry Revenue (Million), by Import Market Analysis (Value & Volume) 2025 & 2033
- Figure 31: Asia Pacific Dry Chilies Industry Revenue Share (%), by Import Market Analysis (Value & Volume) 2025 & 2033
- Figure 32: Asia Pacific Dry Chilies Industry Revenue (Million), by Export Market Analysis (Value & Volume) 2025 & 2033
- Figure 33: Asia Pacific Dry Chilies Industry Revenue Share (%), by Export Market Analysis (Value & Volume) 2025 & 2033
- Figure 34: Asia Pacific Dry Chilies Industry Revenue (Million), by Price Trend Analysis 2025 & 2033
- Figure 35: Asia Pacific Dry Chilies Industry Revenue Share (%), by Price Trend Analysis 2025 & 2033
- Figure 36: Asia Pacific Dry Chilies Industry Revenue (Million), by Country 2025 & 2033
- Figure 37: Asia Pacific Dry Chilies Industry Revenue Share (%), by Country 2025 & 2033
- Figure 38: South America Dry Chilies Industry Revenue (Million), by Production Analysis 2025 & 2033
- Figure 39: South America Dry Chilies Industry Revenue Share (%), by Production Analysis 2025 & 2033
- Figure 40: South America Dry Chilies Industry Revenue (Million), by Consumption Analysis 2025 & 2033
- Figure 41: South America Dry Chilies Industry Revenue Share (%), by Consumption Analysis 2025 & 2033
- Figure 42: South America Dry Chilies Industry Revenue (Million), by Import Market Analysis (Value & Volume) 2025 & 2033
- Figure 43: South America Dry Chilies Industry Revenue Share (%), by Import Market Analysis (Value & Volume) 2025 & 2033
- Figure 44: South America Dry Chilies Industry Revenue (Million), by Export Market Analysis (Value & Volume) 2025 & 2033
- Figure 45: South America Dry Chilies Industry Revenue Share (%), by Export Market Analysis (Value & Volume) 2025 & 2033
- Figure 46: South America Dry Chilies Industry Revenue (Million), by Price Trend Analysis 2025 & 2033
- Figure 47: South America Dry Chilies Industry Revenue Share (%), by Price Trend Analysis 2025 & 2033
- Figure 48: South America Dry Chilies Industry Revenue (Million), by Country 2025 & 2033
- Figure 49: South America Dry Chilies Industry Revenue Share (%), by Country 2025 & 2033
- Figure 50: Africa Dry Chilies Industry Revenue (Million), by Production Analysis 2025 & 2033
- Figure 51: Africa Dry Chilies Industry Revenue Share (%), by Production Analysis 2025 & 2033
- Figure 52: Africa Dry Chilies Industry Revenue (Million), by Consumption Analysis 2025 & 2033
- Figure 53: Africa Dry Chilies Industry Revenue Share (%), by Consumption Analysis 2025 & 2033
- Figure 54: Africa Dry Chilies Industry Revenue (Million), by Import Market Analysis (Value & Volume) 2025 & 2033
- Figure 55: Africa Dry Chilies Industry Revenue Share (%), by Import Market Analysis (Value & Volume) 2025 & 2033
- Figure 56: Africa Dry Chilies Industry Revenue (Million), by Export Market Analysis (Value & Volume) 2025 & 2033
- Figure 57: Africa Dry Chilies Industry Revenue Share (%), by Export Market Analysis (Value & Volume) 2025 & 2033
- Figure 58: Africa Dry Chilies Industry Revenue (Million), by Price Trend Analysis 2025 & 2033
- Figure 59: Africa Dry Chilies Industry Revenue Share (%), by Price Trend Analysis 2025 & 2033
- Figure 60: Africa Dry Chilies Industry Revenue (Million), by Country 2025 & 2033
- Figure 61: Africa Dry Chilies Industry Revenue Share (%), by Country 2025 & 2033
List of Tables
- Table 1: Global Dry Chilies Industry Revenue Million Forecast, by Production Analysis 2020 & 2033
- Table 2: Global Dry Chilies Industry Revenue Million Forecast, by Consumption Analysis 2020 & 2033
- Table 3: Global Dry Chilies Industry Revenue Million Forecast, by Import Market Analysis (Value & Volume) 2020 & 2033
- Table 4: Global Dry Chilies Industry Revenue Million Forecast, by Export Market Analysis (Value & Volume) 2020 & 2033
- Table 5: Global Dry Chilies Industry Revenue Million Forecast, by Price Trend Analysis 2020 & 2033
- Table 6: Global Dry Chilies Industry Revenue Million Forecast, by Region 2020 & 2033
- Table 7: Global Dry Chilies Industry Revenue Million Forecast, by Production Analysis 2020 & 2033
- Table 8: Global Dry Chilies Industry Revenue Million Forecast, by Consumption Analysis 2020 & 2033
- Table 9: Global Dry Chilies Industry Revenue Million Forecast, by Import Market Analysis (Value & Volume) 2020 & 2033
- Table 10: Global Dry Chilies Industry Revenue Million Forecast, by Export Market Analysis (Value & Volume) 2020 & 2033
- Table 11: Global Dry Chilies Industry Revenue Million Forecast, by Price Trend Analysis 2020 & 2033
- Table 12: Global Dry Chilies Industry Revenue Million Forecast, by Country 2020 & 2033
- Table 13: United States Dry Chilies Industry Revenue (Million) Forecast, by Application 2020 & 2033
- Table 14: Canada Dry Chilies Industry Revenue (Million) Forecast, by Application 2020 & 2033
- Table 15: Mexico Dry Chilies Industry Revenue (Million) Forecast, by Application 2020 & 2033
- Table 16: Global Dry Chilies Industry Revenue Million Forecast, by Production Analysis 2020 & 2033
- Table 17: Global Dry Chilies Industry Revenue Million Forecast, by Consumption Analysis 2020 & 2033
- Table 18: Global Dry Chilies Industry Revenue Million Forecast, by Import Market Analysis (Value & Volume) 2020 & 2033
- Table 19: Global Dry Chilies Industry Revenue Million Forecast, by Export Market Analysis (Value & Volume) 2020 & 2033
- Table 20: Global Dry Chilies Industry Revenue Million Forecast, by Price Trend Analysis 2020 & 2033
- Table 21: Global Dry Chilies Industry Revenue Million Forecast, by Country 2020 & 2033
- Table 22: United Kingdom Dry Chilies Industry Revenue (Million) Forecast, by Application 2020 & 2033
- Table 23: Germany Dry Chilies Industry Revenue (Million) Forecast, by Application 2020 & 2033
- Table 24: France Dry Chilies Industry Revenue (Million) Forecast, by Application 2020 & 2033
- Table 25: Spain Dry Chilies Industry Revenue (Million) Forecast, by Application 2020 & 2033
- Table 26: Global Dry Chilies Industry Revenue Million Forecast, by Production Analysis 2020 & 2033
- Table 27: Global Dry Chilies Industry Revenue Million Forecast, by Consumption Analysis 2020 & 2033
- Table 28: Global Dry Chilies Industry Revenue Million Forecast, by Import Market Analysis (Value & Volume) 2020 & 2033
- Table 29: Global Dry Chilies Industry Revenue Million Forecast, by Export Market Analysis (Value & Volume) 2020 & 2033
- Table 30: Global Dry Chilies Industry Revenue Million Forecast, by Price Trend Analysis 2020 & 2033
- Table 31: Global Dry Chilies Industry Revenue Million Forecast, by Country 2020 & 2033
- Table 32: China Dry Chilies Industry Revenue (Million) Forecast, by Application 2020 & 2033
- Table 33: Australia Dry Chilies Industry Revenue (Million) Forecast, by Application 2020 & 2033
- Table 34: India Dry Chilies Industry Revenue (Million) Forecast, by Application 2020 & 2033
- Table 35: Global Dry Chilies Industry Revenue Million Forecast, by Production Analysis 2020 & 2033
- Table 36: Global Dry Chilies Industry Revenue Million Forecast, by Consumption Analysis 2020 & 2033
- Table 37: Global Dry Chilies Industry Revenue Million Forecast, by Import Market Analysis (Value & Volume) 2020 & 2033
- Table 38: Global Dry Chilies Industry Revenue Million Forecast, by Export Market Analysis (Value & Volume) 2020 & 2033
- Table 39: Global Dry Chilies Industry Revenue Million Forecast, by Price Trend Analysis 2020 & 2033
- Table 40: Global Dry Chilies Industry Revenue Million Forecast, by Country 2020 & 2033
- Table 41: Brazil Dry Chilies Industry Revenue (Million) Forecast, by Application 2020 & 2033
- Table 42: Argentina Dry Chilies Industry Revenue (Million) Forecast, by Application 2020 & 2033
- Table 43: Global Dry Chilies Industry Revenue Million Forecast, by Production Analysis 2020 & 2033
- Table 44: Global Dry Chilies Industry Revenue Million Forecast, by Consumption Analysis 2020 & 2033
- Table 45: Global Dry Chilies Industry Revenue Million Forecast, by Import Market Analysis (Value & Volume) 2020 & 2033
- Table 46: Global Dry Chilies Industry Revenue Million Forecast, by Export Market Analysis (Value & Volume) 2020 & 2033
- Table 47: Global Dry Chilies Industry Revenue Million Forecast, by Price Trend Analysis 2020 & 2033
- Table 48: Global Dry Chilies Industry Revenue Million Forecast, by Country 2020 & 2033
- Table 49: South Africa Dry Chilies Industry Revenue (Million) Forecast, by Application 2020 & 2033
- Table 50: Egypt Dry Chilies Industry Revenue (Million) Forecast, by Application 2020 & 2033
Frequently Asked Questions
1. What is the projected Compound Annual Growth Rate (CAGR) of the Dry Chilies Industry?
The projected CAGR is approximately 6.11%.
2. Which companies are prominent players in the Dry Chilies Industry?
Key companies in the market include Syngenta India, Sunrise Foods, Laxmi Organic Industries, AIC India, Rico Company.
3. What are the main segments of the Dry Chilies Industry?
The market segments include Production Analysis, Consumption Analysis, Import Market Analysis (Value & Volume), Export Market Analysis (Value & Volume), Price Trend Analysis.
4. Can you provide details about the market size?
The market size is estimated to be USD 1.61 Million as of 2022.
5. What are some drivers contributing to market growth?
Increasing Berry Consumption for Health Benefits; Increasing Adoption of High-Technology Farm Practices; Growing Usage of Berries in the Food and Beverage Industries.
6. What are the notable trends driving market growth?
High Demand for the Exotic and Spicy Oriental Dishes.
7. Are there any restraints impacting market growth?
High Production Cost Involved in Berry Production; Increasing Disease and Pest Infestations.
8. Can you provide examples of recent developments in the market?
November 2022: The Indonesian government increased domestic production of chilies rather than importing them from abroad, and to do this, it implemented strategic policies for chili development using hybrid seeds, complete and balanced fertilization, better irrigation infrastructure and farming roads, increasing the capacity of farmers' resources, and expanding the goals and market segments.
9. What pricing options are available for accessing the report?
Pricing options include single-user, multi-user, and enterprise licenses priced at USD 4750, USD 5250, and USD 8750 respectively.
10. Is the market size provided in terms of value or volume?
The market size is provided in terms of value, measured in Million.
11. Are there any specific market keywords associated with the report?
Yes, the market keyword associated with the report is "Dry Chilies Industry," which aids in identifying and referencing the specific market segment covered.
12. How do I determine which pricing option suits my needs best?
The pricing options vary based on user requirements and access needs. Individual users may opt for single-user licenses, while businesses requiring broader access may choose multi-user or enterprise licenses for cost-effective access to the report.
13. Are there any additional resources or data provided in the Dry Chilies Industry report?
While the report offers comprehensive insights, it's advisable to review the specific contents or supplementary materials provided to ascertain if additional resources or data are available.
14. How can I stay updated on further developments or reports in the Dry Chilies Industry?
To stay informed about further developments, trends, and reports in the Dry Chilies Industry, consider subscribing to industry newsletters, following relevant companies and organizations, or regularly checking reputable industry news sources and publications.
Methodology
Step 1 - Identification of Relevant Samples Size from Population Database


Step 2 - Approaches for Defining Global Market Size (Value, Volume* & Price*)

Note*: In applicable scenarios
Step 3 - Data Sources
Primary Research
- Web Analytics
- Survey Reports
- Research Institute
- Latest Research Reports
- Opinion Leaders
Secondary Research
- Annual Reports
- White Paper
- Latest Press Release
- Industry Association
- Paid Database
- Investor Presentations

Step 4 - Data Triangulation
Involves using different sources of information in order to increase the validity of a study
These sources are likely to be stakeholders in a program - participants, other researchers, program staff, other community members, and so on.
Then we put all data in single framework & apply various statistical tools to find out the dynamic on the market.
During the analysis stage, feedback from the stakeholder groups would be compared to determine areas of agreement as well as areas of divergence