

Key Insights
The Electric Propulsion Satellites (EPS) market is experiencing robust growth, driven by increasing demand for smaller, more efficient, and cost-effective satellites. The market's Compound Annual Growth Rate (CAGR) of 5.37% from 2019 to 2024 indicates a steady upward trajectory. This growth is fueled by several key factors. The miniaturization of satellites and the rise of constellations for applications like Earth observation, communication, and navigation are significantly boosting the adoption of EPS systems. Full electric propulsion systems are gaining traction due to their superior fuel efficiency compared to traditional chemical propulsion, leading to longer mission life and reduced launch costs. Furthermore, the increasing focus on sustainable space exploration and the need for precise orbital maneuvers are contributing to the market's expansion. Government initiatives and investments in space exploration further enhance the growth potential. The market is segmented by propulsion type (full electric, hybrid), end-user (commercial, military), and region (Asia-Pacific, Europe, North America, Rest of World), with each segment contributing uniquely to overall growth. While specific regional market share data is unavailable, North America and Europe are expected to hold substantial shares, driven by strong aerospace industries and government support. However, the Asia-Pacific region is poised for significant growth due to increasing investment in space technology and infrastructure. Competitive pressures among established players like Airbus SE, Boeing, and newer entrants like Accion Systems are fostering innovation and driving down costs, making EPS technology accessible to a wider range of users.
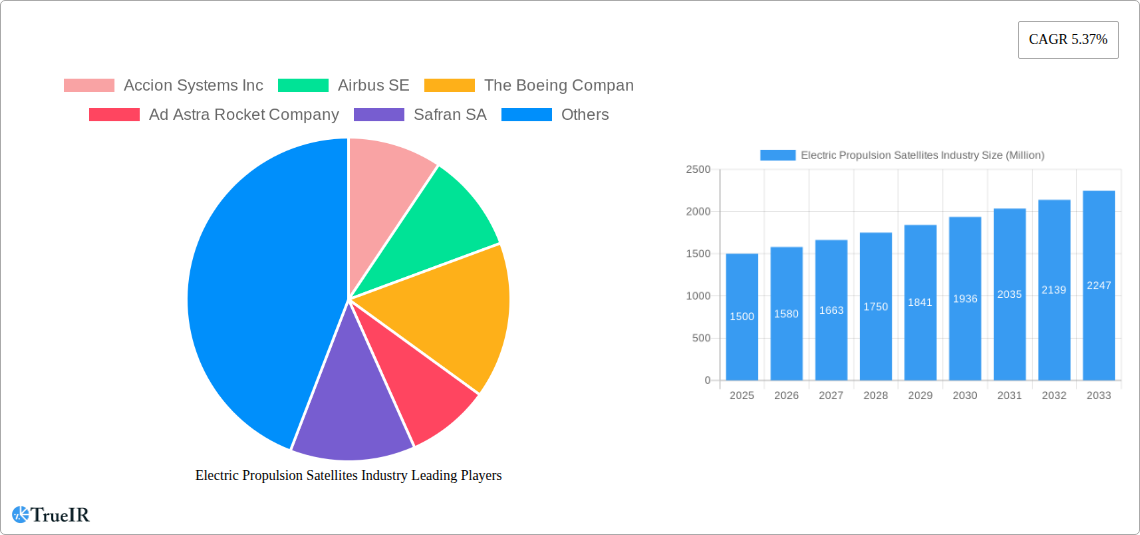
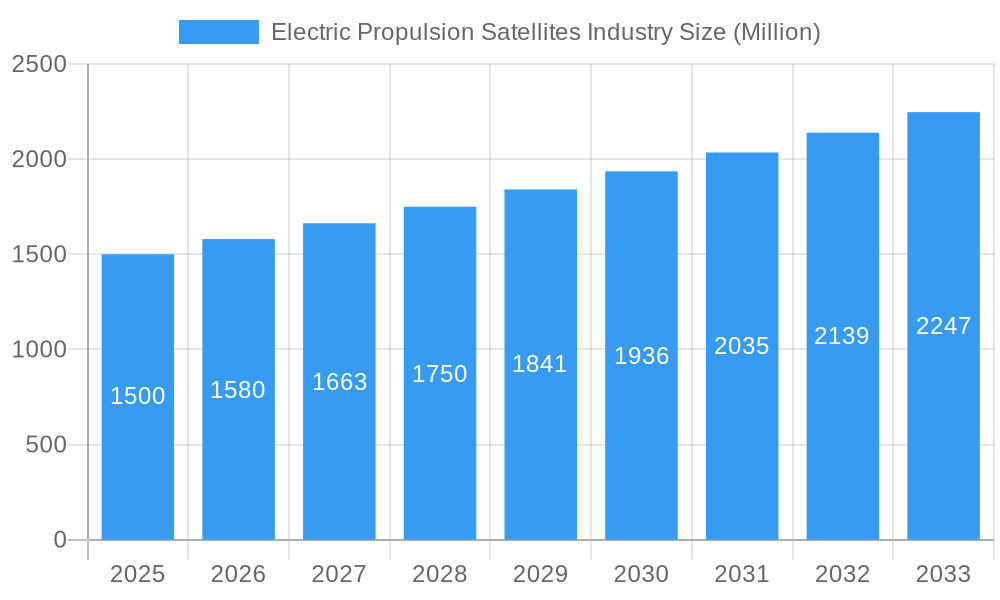
Electric Propulsion Satellites Industry Market Size (In Billion)
The long-term outlook for the EPS market remains positive, with projections extending to 2033 indicating continued growth. Challenges, such as the need for improved technology reliability and the high initial investment costs associated with developing new propulsion systems, are likely to persist. However, ongoing technological advancements, coupled with the increasing demand for satellite services across various sectors, are expected to outweigh these limitations. The market is witnessing a shift towards more sustainable and efficient space operations, aligning perfectly with the advantages offered by electric propulsion technology. This makes the EPS market a compelling investment opportunity for stakeholders across the space ecosystem. Market segmentation analysis reveals that the commercial sector is expected to drive the major growth, fueled by the demand for cost-effective satellite constellations across various sectors including broadband internet and earth observation.
Electric Propulsion Satellites Industry Company Market Share
Electric Propulsion Satellites Industry: A Comprehensive Market Report (2019-2033)
This in-depth report provides a comprehensive analysis of the Electric Propulsion Satellites industry, offering invaluable insights for investors, industry professionals, and strategic decision-makers. The study covers the period from 2019 to 2033, with a base year of 2025 and a forecast period spanning 2025-2033. The report leverages extensive market research and data analysis to illuminate key trends, opportunities, and challenges shaping this dynamic sector. The global market size in 2025 is estimated at $XX Million and is projected to reach $XX Million by 2033, exhibiting a robust CAGR of XX%.
Electric Propulsion Satellites Industry Market Structure & Competitive Landscape
The Electric Propulsion Satellites market is characterized by a moderately concentrated landscape, with key players such as The Boeing Company, Airbus SE, Safran SA, Thales, Northrop Grumman Corporation, Aerojet Rocketdyne Holdings Inc, Accion Systems Inc, Ad Astra Rocket Company, Sitael S p A, and Busek Co Inc vying for market share. The Herfindahl-Hirschman Index (HHI) in 2025 is estimated at xx, indicating a moderately concentrated market.
Innovation is a crucial driver, with ongoing research and development in areas like ion propulsion, hall-effect thrusters, and advanced materials. Regulatory frameworks, particularly those concerning space debris mitigation and satellite licensing, significantly impact market dynamics. Product substitutes, including traditional chemical propulsion systems, face increasing competition due to the superior fuel efficiency of electric propulsion. End-user segmentation is primarily driven by commercial (e.g., communication satellites, earth observation) and military applications (e.g., surveillance, reconnaissance). The report analyzes M&A activity, with an estimated xx number of transactions recorded between 2019 and 2024, revealing strategic consolidation trends in the sector.
Electric Propulsion Satellites Industry Market Trends & Opportunities
The Electric Propulsion Satellites market is experiencing significant growth, driven by increasing demand for smaller, more fuel-efficient satellites, and a surge in the adoption of electric propulsion systems across various satellite applications. Technological advancements are paramount, with innovations in plasma propulsion and gridded ion thrusters significantly enhancing efficiency and operational life. Consumer preferences are shifting towards satellites with longer operational lifetimes and reduced operational costs, which electric propulsion directly addresses. Competitive dynamics are characterized by a focus on technological leadership and partnerships, with companies actively investing in R&D and strategic collaborations to enhance their product offerings and market share. The market is projected to witness substantial expansion in diverse segments like in-space transportation and station keeping. Market penetration rates are rising steadily, particularly in the commercial segment, driven by the cost advantages of electric propulsion. The overall market exhibits strong growth potential with a projected CAGR of XX% during the forecast period (2025-2033).
Dominant Markets & Segments in Electric Propulsion Satellites Industry
Leading Region: North America currently holds the largest market share, driven by robust technological advancements, significant investments in space research, and a well-established commercial space sector.
Leading Segment (Propulsion Type): Full-electric propulsion systems dominate the market due to their superior fuel efficiency and operational advantages, surpassing hybrid systems in terms of market share.
Leading Segment (End User): The commercial sector accounts for the largest market share due to increased demand from communication, navigation, and earth observation satellite operators.
Growth Drivers:
- North America: Strong government support for space exploration and research and development, a thriving commercial space industry.
- Europe: Significant investment in satellite technology and advancements in electric propulsion systems.
- Asia-Pacific: Rapid expansion of the satellite communications industry and government initiatives to boost space exploration.
- Full Electric Propulsion: Higher fuel efficiency, longer mission life, and better maneuverability compared to chemical propulsion.
- Commercial Sector: Increasing demand for cost-effective, long-lasting communication, navigation and earth observation satellites.
Electric Propulsion Satellites Industry Product Analysis
Electric propulsion systems are undergoing rapid technological advancements, focusing on miniaturization, enhanced efficiency, and improved reliability. The development of advanced plasma thrusters, gridded ion thrusters, and field-emission electric propulsion (FEEP) is driving innovation. These advancements are crucial for extending satellite lifetimes, reducing launch costs, and enabling more complex satellite missions. The competitive advantage lies in the balance of performance, cost-effectiveness, and reliability, with companies tailoring their solutions to specific satellite applications and mission requirements.
Key Drivers, Barriers & Challenges in Electric Propulsion Satellites Industry
Key Drivers:
- Increased demand for higher satellite performance: Longer operational lifespan, enhanced maneuverability, and improved fuel efficiency drive adoption.
- Technological advancements: Improvements in thruster technology are making electric propulsion more viable and cost-effective.
- Government funding and initiatives: Funding for space research and development projects fosters innovation and adoption.
Key Challenges:
- High initial investment costs: Developing and integrating electric propulsion systems remains expensive, hindering adoption among smaller players.
- Limited space-qualified components: The availability of flight-proven components needs to improve to facilitate broader industry adoption.
- Technological complexities: The intricate nature of these systems demands specialized expertise, increasing both development and maintenance costs. This impacts smaller businesses significantly. Supply chain vulnerabilities can lead to project delays and cost overruns impacting the XX Million dollar market.
Growth Drivers in the Electric Propulsion Satellites Industry Market
The primary growth drivers include the rising demand for higher-performing satellites, continuous advancements in electric propulsion technology, increased government funding and investments, and a surge in commercial space activities. These factors collectively contribute to the expansion of this dynamic sector.
Challenges Impacting Electric Propulsion Satellites Industry Growth
Challenges include the high initial cost of development and integration, limited availability of space-qualified components, and the technological complexities associated with electric propulsion systems. Addressing these issues is crucial to fostering wider adoption and unlocking the market's full potential. The reliance on a limited number of suppliers also poses a risk to the supply chain.
Key Players Shaping the Electric Propulsion Satellites Industry Market
- Accion Systems Inc
- Airbus SE
- The Boeing Company
- Ad Astra Rocket Company
- Safran SA
- Thales
- Aerojet Rocketdyne Holdings Inc
- Sitael S p A
- Busek Co Inc
- Northrop Grumman Corporation
Significant Electric Propulsion Satellites Industry Milestones
- 2020: Successful launch of a satellite utilizing a new generation of electric propulsion technology by Airbus SE.
- 2022: Accion Systems Inc secures a major contract for electric propulsion systems from a leading satellite operator.
- 2023: Boeing and Safran SA collaborate on a next-generation electric propulsion system.
- 2024: Several successful launches featuring electric propulsion systems demonstrate increasing market adoption.
Future Outlook for Electric Propulsion Satellites Industry Market
The future of the Electric Propulsion Satellites market is bright, driven by ongoing technological advancements, increasing demand from diverse satellite applications, and government support for space exploration. Strategic opportunities exist in developing more efficient and cost-effective systems, as well as focusing on miniaturization and integration capabilities. The market’s growth trajectory remains robust, presenting attractive prospects for both established players and new entrants.
Electric Propulsion Satellites Industry Segmentation
-
1. Propulsion Type
- 1.1. Full Electric
- 1.2. Hybrid
-
2. End User
- 2.1. Commercial
- 2.2. Military
Electric Propulsion Satellites Industry Segmentation By Geography
-
1. North America
- 1.1. United States
- 1.2. Canada
- 1.3. Mexico
-
2. South America
- 2.1. Brazil
- 2.2. Argentina
- 2.3. Rest of South America
-
3. Europe
- 3.1. United Kingdom
- 3.2. Germany
- 3.3. France
- 3.4. Italy
- 3.5. Spain
- 3.6. Russia
- 3.7. Benelux
- 3.8. Nordics
- 3.9. Rest of Europe
-
4. Middle East & Africa
- 4.1. Turkey
- 4.2. Israel
- 4.3. GCC
- 4.4. North Africa
- 4.5. South Africa
- 4.6. Rest of Middle East & Africa
-
5. Asia Pacific
- 5.1. China
- 5.2. India
- 5.3. Japan
- 5.4. South Korea
- 5.5. ASEAN
- 5.6. Oceania
- 5.7. Rest of Asia Pacific
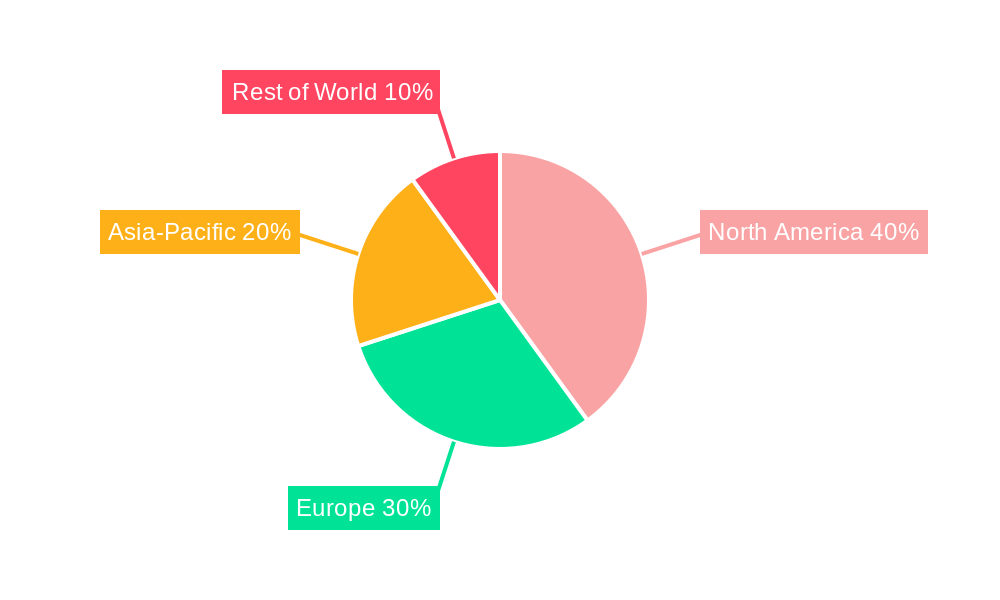
Electric Propulsion Satellites Industry Regional Market Share
Geographic Coverage of Electric Propulsion Satellites Industry
Electric Propulsion Satellites Industry REPORT HIGHLIGHTS
| Aspects | Details |
|---|---|
| Study Period | 2020-2034 |
| Base Year | 2025 |
| Estimated Year | 2026 |
| Forecast Period | 2026-2034 |
| Historical Period | 2020-2025 |
| Growth Rate | CAGR of 13.7% from 2020-2034 |
| Segmentation |
|
Table of Contents
- 1. Introduction
- 1.1. Research Scope
- 1.2. Market Segmentation
- 1.3. Research Objective
- 1.4. Definitions and Assumptions
- 2. Executive Summary
- 2.1. Market Snapshot
- 3. Market Dynamics
- 3.1. Market Drivers
- 3.2. Market Restrains
- 3.3. Market Trends
- 3.4. Market Opportunities
- 4. Market Factor Analysis
- 4.1. Porters Five Forces
- 4.1.1. Bargaining Power of Suppliers
- 4.1.2. Bargaining Power of Buyers
- 4.1.3. Threat of New Entrants
- 4.1.4. Threat of Substitutes
- 4.1.5. Competitive Rivalry
- 4.2. PESTEL analysis
- 4.3. BCG Analysis
- 4.3.1. Stars (High Growth, High Market Share)
- 4.3.2. Cash Cows (Low Growth, High Market Share)
- 4.3.3. Question Mark (High Growth, Low Market Share)
- 4.3.4. Dogs (Low Growth, Low Market Share)
- 4.4. Ansoff Matrix Analysis
- 4.5. Supply Chain Analysis
- 4.6. Regulatory Landscape
- 4.7. Current Market Potential and Opportunity Assessment (TAM–SAM–SOM Framework)
- 4.8. TIR Analyst Note
- 4.1. Porters Five Forces
- 5. Market Analysis, Insights and Forecast 2021-2033
- 5.1. Market Analysis, Insights and Forecast - by Propulsion Type
- 5.1.1. Full Electric
- 5.1.2. Hybrid
- 5.2. Market Analysis, Insights and Forecast - by End User
- 5.2.1. Commercial
- 5.2.2. Military
- 5.3. Market Analysis, Insights and Forecast - by Region
- 5.3.1. North America
- 5.3.2. South America
- 5.3.3. Europe
- 5.3.4. Middle East & Africa
- 5.3.5. Asia Pacific
- 5.1. Market Analysis, Insights and Forecast - by Propulsion Type
- 6. Global Electric Propulsion Satellites Industry Analysis, Insights and Forecast, 2021-2033
- 6.1. Market Analysis, Insights and Forecast - by Propulsion Type
- 6.1.1. Full Electric
- 6.1.2. Hybrid
- 6.2. Market Analysis, Insights and Forecast - by End User
- 6.2.1. Commercial
- 6.2.2. Military
- 6.1. Market Analysis, Insights and Forecast - by Propulsion Type
- 7. North America Electric Propulsion Satellites Industry Analysis, Insights and Forecast, 2020-2032
- 7.1. Market Analysis, Insights and Forecast - by Propulsion Type
- 7.1.1. Full Electric
- 7.1.2. Hybrid
- 7.2. Market Analysis, Insights and Forecast - by End User
- 7.2.1. Commercial
- 7.2.2. Military
- 7.1. Market Analysis, Insights and Forecast - by Propulsion Type
- 8. South America Electric Propulsion Satellites Industry Analysis, Insights and Forecast, 2020-2032
- 8.1. Market Analysis, Insights and Forecast - by Propulsion Type
- 8.1.1. Full Electric
- 8.1.2. Hybrid
- 8.2. Market Analysis, Insights and Forecast - by End User
- 8.2.1. Commercial
- 8.2.2. Military
- 8.1. Market Analysis, Insights and Forecast - by Propulsion Type
- 9. Europe Electric Propulsion Satellites Industry Analysis, Insights and Forecast, 2020-2032
- 9.1. Market Analysis, Insights and Forecast - by Propulsion Type
- 9.1.1. Full Electric
- 9.1.2. Hybrid
- 9.2. Market Analysis, Insights and Forecast - by End User
- 9.2.1. Commercial
- 9.2.2. Military
- 9.1. Market Analysis, Insights and Forecast - by Propulsion Type
- 10. Middle East & Africa Electric Propulsion Satellites Industry Analysis, Insights and Forecast, 2020-2032
- 10.1. Market Analysis, Insights and Forecast - by Propulsion Type
- 10.1.1. Full Electric
- 10.1.2. Hybrid
- 10.2. Market Analysis, Insights and Forecast - by End User
- 10.2.1. Commercial
- 10.2.2. Military
- 10.1. Market Analysis, Insights and Forecast - by Propulsion Type
- 11. Asia Pacific Electric Propulsion Satellites Industry Analysis, Insights and Forecast, 2020-2032
- 11.1. Market Analysis, Insights and Forecast - by Propulsion Type
- 11.1.1. Full Electric
- 11.1.2. Hybrid
- 11.2. Market Analysis, Insights and Forecast - by End User
- 11.2.1. Commercial
- 11.2.2. Military
- 11.1. Market Analysis, Insights and Forecast - by Propulsion Type
- 12. Competitive Analysis
- 12.1. Company Profiles
- 12.1.1 Accion Systems Inc
- 12.1.1.1. Company Overview
- 12.1.1.2. Products
- 12.1.1.3. Company Financials
- 12.1.1.4. SWOT Analysis
- 12.1.2 Airbus SE
- 12.1.2.1. Company Overview
- 12.1.2.2. Products
- 12.1.2.3. Company Financials
- 12.1.2.4. SWOT Analysis
- 12.1.3 The Boeing Compan
- 12.1.3.1. Company Overview
- 12.1.3.2. Products
- 12.1.3.3. Company Financials
- 12.1.3.4. SWOT Analysis
- 12.1.4 Ad Astra Rocket Company
- 12.1.4.1. Company Overview
- 12.1.4.2. Products
- 12.1.4.3. Company Financials
- 12.1.4.4. SWOT Analysis
- 12.1.5 Safran SA
- 12.1.5.1. Company Overview
- 12.1.5.2. Products
- 12.1.5.3. Company Financials
- 12.1.5.4. SWOT Analysis
- 12.1.6 Thales
- 12.1.6.1. Company Overview
- 12.1.6.2. Products
- 12.1.6.3. Company Financials
- 12.1.6.4. SWOT Analysis
- 12.1.7 Aerojet Rocketdyne Holdings Inc
- 12.1.7.1. Company Overview
- 12.1.7.2. Products
- 12.1.7.3. Company Financials
- 12.1.7.4. SWOT Analysis
- 12.1.8 Sitael S p A
- 12.1.8.1. Company Overview
- 12.1.8.2. Products
- 12.1.8.3. Company Financials
- 12.1.8.4. SWOT Analysis
- 12.1.9 Busek Co Inc
- 12.1.9.1. Company Overview
- 12.1.9.2. Products
- 12.1.9.3. Company Financials
- 12.1.9.4. SWOT Analysis
- 12.1.10 Northrop Grumman Corporation
- 12.1.10.1. Company Overview
- 12.1.10.2. Products
- 12.1.10.3. Company Financials
- 12.1.10.4. SWOT Analysis
- 12.1.1 Accion Systems Inc
- 12.2. Market Entropy
- 12.2.1 Company's Key Areas Served
- 12.2.2 Recent Developments
- 12.3. Company Market Share Analysis 2025
- 12.3.1 Top 5 Companies Market Share Analysis
- 12.3.2 Top 3 Companies Market Share Analysis
- 12.4. List of Potential Customers
- 13. Research Methodology
List of Figures
- Figure 1: Global Electric Propulsion Satellites Industry Revenue Breakdown (billion, %) by Region 2025 & 2033
- Figure 2: North America Electric Propulsion Satellites Industry Revenue (billion), by Propulsion Type 2025 & 2033
- Figure 3: North America Electric Propulsion Satellites Industry Revenue Share (%), by Propulsion Type 2025 & 2033
- Figure 4: North America Electric Propulsion Satellites Industry Revenue (billion), by End User 2025 & 2033
- Figure 5: North America Electric Propulsion Satellites Industry Revenue Share (%), by End User 2025 & 2033
- Figure 6: North America Electric Propulsion Satellites Industry Revenue (billion), by Country 2025 & 2033
- Figure 7: North America Electric Propulsion Satellites Industry Revenue Share (%), by Country 2025 & 2033
- Figure 8: South America Electric Propulsion Satellites Industry Revenue (billion), by Propulsion Type 2025 & 2033
- Figure 9: South America Electric Propulsion Satellites Industry Revenue Share (%), by Propulsion Type 2025 & 2033
- Figure 10: South America Electric Propulsion Satellites Industry Revenue (billion), by End User 2025 & 2033
- Figure 11: South America Electric Propulsion Satellites Industry Revenue Share (%), by End User 2025 & 2033
- Figure 12: South America Electric Propulsion Satellites Industry Revenue (billion), by Country 2025 & 2033
- Figure 13: South America Electric Propulsion Satellites Industry Revenue Share (%), by Country 2025 & 2033
- Figure 14: Europe Electric Propulsion Satellites Industry Revenue (billion), by Propulsion Type 2025 & 2033
- Figure 15: Europe Electric Propulsion Satellites Industry Revenue Share (%), by Propulsion Type 2025 & 2033
- Figure 16: Europe Electric Propulsion Satellites Industry Revenue (billion), by End User 2025 & 2033
- Figure 17: Europe Electric Propulsion Satellites Industry Revenue Share (%), by End User 2025 & 2033
- Figure 18: Europe Electric Propulsion Satellites Industry Revenue (billion), by Country 2025 & 2033
- Figure 19: Europe Electric Propulsion Satellites Industry Revenue Share (%), by Country 2025 & 2033
- Figure 20: Middle East & Africa Electric Propulsion Satellites Industry Revenue (billion), by Propulsion Type 2025 & 2033
- Figure 21: Middle East & Africa Electric Propulsion Satellites Industry Revenue Share (%), by Propulsion Type 2025 & 2033
- Figure 22: Middle East & Africa Electric Propulsion Satellites Industry Revenue (billion), by End User 2025 & 2033
- Figure 23: Middle East & Africa Electric Propulsion Satellites Industry Revenue Share (%), by End User 2025 & 2033
- Figure 24: Middle East & Africa Electric Propulsion Satellites Industry Revenue (billion), by Country 2025 & 2033
- Figure 25: Middle East & Africa Electric Propulsion Satellites Industry Revenue Share (%), by Country 2025 & 2033
- Figure 26: Asia Pacific Electric Propulsion Satellites Industry Revenue (billion), by Propulsion Type 2025 & 2033
- Figure 27: Asia Pacific Electric Propulsion Satellites Industry Revenue Share (%), by Propulsion Type 2025 & 2033
- Figure 28: Asia Pacific Electric Propulsion Satellites Industry Revenue (billion), by End User 2025 & 2033
- Figure 29: Asia Pacific Electric Propulsion Satellites Industry Revenue Share (%), by End User 2025 & 2033
- Figure 30: Asia Pacific Electric Propulsion Satellites Industry Revenue (billion), by Country 2025 & 2033
- Figure 31: Asia Pacific Electric Propulsion Satellites Industry Revenue Share (%), by Country 2025 & 2033
List of Tables
- Table 1: Global Electric Propulsion Satellites Industry Revenue billion Forecast, by Propulsion Type 2020 & 2033
- Table 2: Global Electric Propulsion Satellites Industry Revenue billion Forecast, by End User 2020 & 2033
- Table 3: Global Electric Propulsion Satellites Industry Revenue billion Forecast, by Region 2020 & 2033
- Table 4: Global Electric Propulsion Satellites Industry Revenue billion Forecast, by Propulsion Type 2020 & 2033
- Table 5: Global Electric Propulsion Satellites Industry Revenue billion Forecast, by End User 2020 & 2033
- Table 6: Global Electric Propulsion Satellites Industry Revenue billion Forecast, by Country 2020 & 2033
- Table 7: United States Electric Propulsion Satellites Industry Revenue (billion) Forecast, by Application 2020 & 2033
- Table 8: Canada Electric Propulsion Satellites Industry Revenue (billion) Forecast, by Application 2020 & 2033
- Table 9: Mexico Electric Propulsion Satellites Industry Revenue (billion) Forecast, by Application 2020 & 2033
- Table 10: Global Electric Propulsion Satellites Industry Revenue billion Forecast, by Propulsion Type 2020 & 2033
- Table 11: Global Electric Propulsion Satellites Industry Revenue billion Forecast, by End User 2020 & 2033
- Table 12: Global Electric Propulsion Satellites Industry Revenue billion Forecast, by Country 2020 & 2033
- Table 13: Brazil Electric Propulsion Satellites Industry Revenue (billion) Forecast, by Application 2020 & 2033
- Table 14: Argentina Electric Propulsion Satellites Industry Revenue (billion) Forecast, by Application 2020 & 2033
- Table 15: Rest of South America Electric Propulsion Satellites Industry Revenue (billion) Forecast, by Application 2020 & 2033
- Table 16: Global Electric Propulsion Satellites Industry Revenue billion Forecast, by Propulsion Type 2020 & 2033
- Table 17: Global Electric Propulsion Satellites Industry Revenue billion Forecast, by End User 2020 & 2033
- Table 18: Global Electric Propulsion Satellites Industry Revenue billion Forecast, by Country 2020 & 2033
- Table 19: United Kingdom Electric Propulsion Satellites Industry Revenue (billion) Forecast, by Application 2020 & 2033
- Table 20: Germany Electric Propulsion Satellites Industry Revenue (billion) Forecast, by Application 2020 & 2033
- Table 21: France Electric Propulsion Satellites Industry Revenue (billion) Forecast, by Application 2020 & 2033
- Table 22: Italy Electric Propulsion Satellites Industry Revenue (billion) Forecast, by Application 2020 & 2033
- Table 23: Spain Electric Propulsion Satellites Industry Revenue (billion) Forecast, by Application 2020 & 2033
- Table 24: Russia Electric Propulsion Satellites Industry Revenue (billion) Forecast, by Application 2020 & 2033
- Table 25: Benelux Electric Propulsion Satellites Industry Revenue (billion) Forecast, by Application 2020 & 2033
- Table 26: Nordics Electric Propulsion Satellites Industry Revenue (billion) Forecast, by Application 2020 & 2033
- Table 27: Rest of Europe Electric Propulsion Satellites Industry Revenue (billion) Forecast, by Application 2020 & 2033
- Table 28: Global Electric Propulsion Satellites Industry Revenue billion Forecast, by Propulsion Type 2020 & 2033
- Table 29: Global Electric Propulsion Satellites Industry Revenue billion Forecast, by End User 2020 & 2033
- Table 30: Global Electric Propulsion Satellites Industry Revenue billion Forecast, by Country 2020 & 2033
- Table 31: Turkey Electric Propulsion Satellites Industry Revenue (billion) Forecast, by Application 2020 & 2033
- Table 32: Israel Electric Propulsion Satellites Industry Revenue (billion) Forecast, by Application 2020 & 2033
- Table 33: GCC Electric Propulsion Satellites Industry Revenue (billion) Forecast, by Application 2020 & 2033
- Table 34: North Africa Electric Propulsion Satellites Industry Revenue (billion) Forecast, by Application 2020 & 2033
- Table 35: South Africa Electric Propulsion Satellites Industry Revenue (billion) Forecast, by Application 2020 & 2033
- Table 36: Rest of Middle East & Africa Electric Propulsion Satellites Industry Revenue (billion) Forecast, by Application 2020 & 2033
- Table 37: Global Electric Propulsion Satellites Industry Revenue billion Forecast, by Propulsion Type 2020 & 2033
- Table 38: Global Electric Propulsion Satellites Industry Revenue billion Forecast, by End User 2020 & 2033
- Table 39: Global Electric Propulsion Satellites Industry Revenue billion Forecast, by Country 2020 & 2033
- Table 40: China Electric Propulsion Satellites Industry Revenue (billion) Forecast, by Application 2020 & 2033
- Table 41: India Electric Propulsion Satellites Industry Revenue (billion) Forecast, by Application 2020 & 2033
- Table 42: Japan Electric Propulsion Satellites Industry Revenue (billion) Forecast, by Application 2020 & 2033
- Table 43: South Korea Electric Propulsion Satellites Industry Revenue (billion) Forecast, by Application 2020 & 2033
- Table 44: ASEAN Electric Propulsion Satellites Industry Revenue (billion) Forecast, by Application 2020 & 2033
- Table 45: Oceania Electric Propulsion Satellites Industry Revenue (billion) Forecast, by Application 2020 & 2033
- Table 46: Rest of Asia Pacific Electric Propulsion Satellites Industry Revenue (billion) Forecast, by Application 2020 & 2033
Frequently Asked Questions
1. What is the projected Compound Annual Growth Rate (CAGR) of the Electric Propulsion Satellites Industry?
The projected CAGR is approximately 13.7%.
2. Which companies are prominent players in the Electric Propulsion Satellites Industry?
Key companies in the market include Accion Systems Inc, Airbus SE, The Boeing Compan, Ad Astra Rocket Company, Safran SA, Thales, Aerojet Rocketdyne Holdings Inc, Sitael S p A, Busek Co Inc, Northrop Grumman Corporation.
3. What are the main segments of the Electric Propulsion Satellites Industry?
The market segments include Propulsion Type, End User.
4. Can you provide details about the market size?
The market size is estimated to be USD 55.23 billion as of 2022.
5. What are some drivers contributing to market growth?
N/A
6. What are the notable trends driving market growth?
The growing interest of governments and private players in space exploration have fueled the expansion of this market.
7. Are there any restraints impacting market growth?
N/A
8. Can you provide examples of recent developments in the market?
N/A
9. What pricing options are available for accessing the report?
Pricing options include single-user, multi-user, and enterprise licenses priced at USD 3800, USD 4500, and USD 5800 respectively.
10. Is the market size provided in terms of value or volume?
The market size is provided in terms of value, measured in billion.
11. Are there any specific market keywords associated with the report?
Yes, the market keyword associated with the report is "Electric Propulsion Satellites Industry," which aids in identifying and referencing the specific market segment covered.
12. How do I determine which pricing option suits my needs best?
The pricing options vary based on user requirements and access needs. Individual users may opt for single-user licenses, while businesses requiring broader access may choose multi-user or enterprise licenses for cost-effective access to the report.
13. Are there any additional resources or data provided in the Electric Propulsion Satellites Industry report?
While the report offers comprehensive insights, it's advisable to review the specific contents or supplementary materials provided to ascertain if additional resources or data are available.
14. How can I stay updated on further developments or reports in the Electric Propulsion Satellites Industry?
To stay informed about further developments, trends, and reports in the Electric Propulsion Satellites Industry, consider subscribing to industry newsletters, following relevant companies and organizations, or regularly checking reputable industry news sources and publications.
Methodology
Step 1 - Identification of Relevant Samples Size from Population Database


Step 2 - Approaches for Defining Global Market Size (Value, Volume* & Price*)

Note*: In applicable scenarios
Step 3 - Data Sources
Primary Research
- Web Analytics
- Survey Reports
- Research Institute
- Latest Research Reports
- Opinion Leaders
Secondary Research
- Annual Reports
- White Paper
- Latest Press Release
- Industry Association
- Paid Database
- Investor Presentations

Step 4 - Data Triangulation
Involves using different sources of information in order to increase the validity of a study
These sources are likely to be stakeholders in a program - participants, other researchers, program staff, other community members, and so on.
Then we put all data in single framework & apply various statistical tools to find out the dynamic on the market.
During the analysis stage, feedback from the stakeholder groups would be compared to determine areas of agreement as well as areas of divergence