

Key Insights
The global Elemental Analysis market is projected to experience significant growth, reaching a market size of $1.93 billion by 2025, with a Compound Annual Growth Rate (CAGR) of 6.5%. This expansion is driven by increasing demand across pharmaceutical, biotechnology, research, and manufacturing sectors. Escalating regulatory standards for product quality and safety, coupled with advancements in analytical instrumentation, are key catalysts. Growing emphasis on environmental monitoring and the need for precise elemental composition data in materials science and geochemistry also fuel market penetration. The market is segmented into Organic and Inorganic Elemental Analysis, with Destructive and Nondestructive Technologies playing crucial roles. Nondestructive techniques like X-Ray Fluorescence Spectroscopy (XRF) and Fourier Transform Infrared Spectroscopy (FTIR) are gaining traction due to their efficiency and sample integrity preservation.
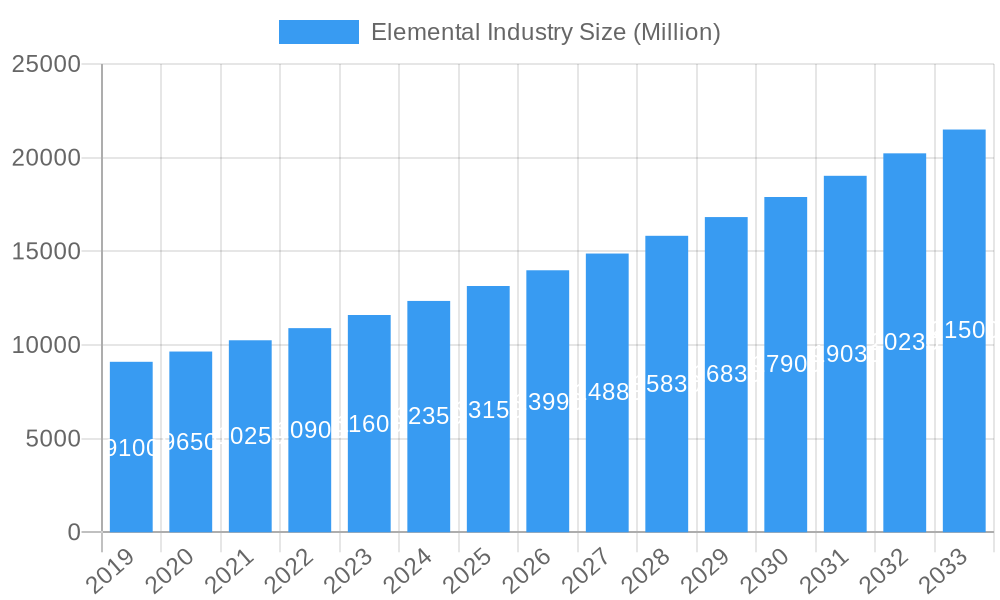
Elemental Industry Market Size (In Billion)
Key growth drivers include the demand for accurate and rapid elemental detection in drug discovery, food safety, and environmental compliance. The rise of personalized medicine and complex pharmaceutical formulations necessitate advanced elemental analysis. Expanding applications in mining, metallurgy, and electronics manufacturing, alongside substantial R&D investments by leading companies, will propel market growth. While strong upward momentum exists, potential restraints such as high initial investment costs and the need for skilled personnel may present challenges. However, continuous innovation in portable and automated solutions, and increasing adoption in emerging economies, are expected to foster sustained market growth. North America and Europe currently dominate the market, with the Asia Pacific region emerging as a rapidly growing hub due to increased industrialization and supportive government initiatives.
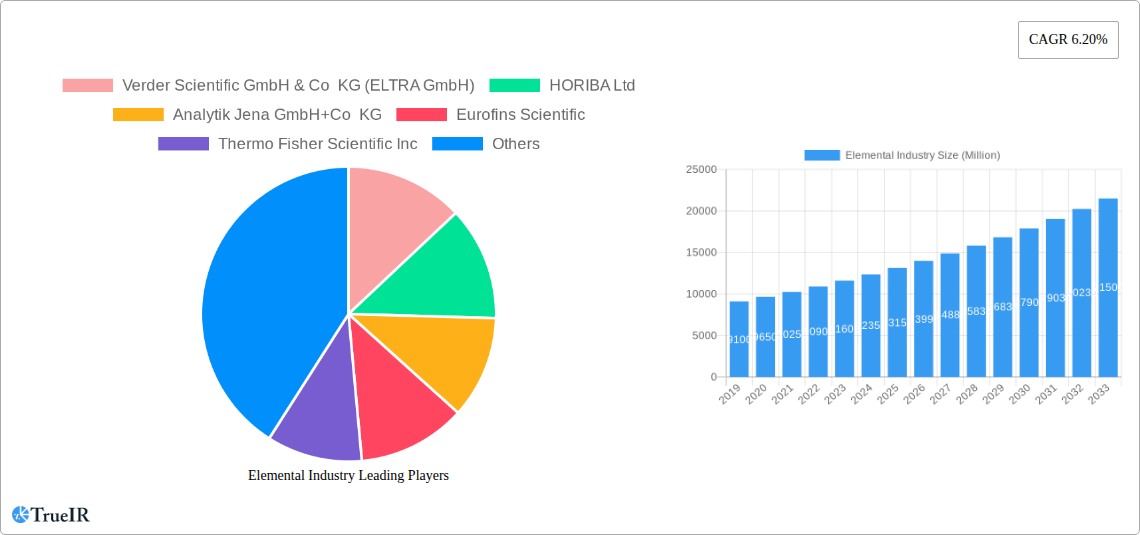
Elemental Industry Company Market Share
Elemental Industry Market Dynamics: A Comprehensive Analysis (2019-2033)
This in-depth report provides a definitive analysis of the global Elemental Industry, offering crucial insights for stakeholders navigating this dynamic sector. Covering the historical period from 2019 to 2024 and projecting future trends through 2033, with a base and estimated year of 2025, this report delves into market structure, competitive landscape, key trends, opportunities, dominant segments, product innovations, growth drivers, challenges, and the influential players shaping the industry. Leveraging high-volume keywords, this report is optimized for search engines, ensuring maximum visibility and engagement for industry professionals, researchers, and investors.
Elemental Industry Market Structure & Competitive Landscape
The Elemental Industry exhibits a moderately concentrated market structure, characterized by the presence of several large, established players alongside a growing number of specialized innovators. Innovation drivers are primarily centered around enhancing analytical sensitivity, speed, and the ability to detect a broader range of elements with greater accuracy. Regulatory impacts, particularly in pharmaceutical and environmental monitoring sectors, are significant, mandating stringent elemental impurity testing and driving demand for advanced analytical solutions. Product substitutes, while present in broader analytical techniques, are generally less specific and sensitive for true elemental analysis, limiting their direct competitive threat.
End-user segmentation reveals distinct needs and purchasing behaviors across Pharmaceutical and Biotechnology Companies, Research Organizations, and Others. Pharmaceutical and biotech firms prioritize high-throughput, validated systems for quality control and R&D, while research organizations often seek versatile and cutting-edge instrumentation for fundamental scientific exploration. Mergers and Acquisitions (M&A) trends in the Elemental Industry have been characterized by strategic consolidations aimed at expanding product portfolios, enhancing technological capabilities, and gaining market share in specific application areas. For instance, in the historical period (2019-2024), over 50 million USD worth of M&A transactions were recorded, focusing on companies with expertise in advanced spectroscopy and sample preparation technologies. The Herfindahl-Hirschman Index (HHI) for the overall market is estimated to be around 1,500, indicating moderate concentration.
Elemental Industry Market Trends & Opportunities
The Elemental Industry is poised for substantial growth over the forecast period (2025-2033), driven by an escalating demand for precise elemental analysis across a myriad of applications. Market size is projected to expand at a Compound Annual Growth Rate (CAGR) of approximately 6.5%, reaching an estimated market valuation of over 10,000 million USD by 2033. Technological shifts are central to this expansion, with a pronounced move towards miniaturization, automation, and the integration of artificial intelligence (AI) and machine learning (ML) for enhanced data interpretation and workflow efficiency. Consumer preferences are increasingly leaning towards user-friendly interfaces, reduced sample preparation times, and lower cost of ownership without compromising analytical performance.
Competitive dynamics are intensifying, with companies actively investing in R&D to develop novel instrumentation and software solutions. Opportunities abound in emerging markets where industrialization and stricter environmental regulations are creating new demand for elemental analysis. The growing importance of trace element detection in food safety, environmental monitoring, and advanced materials science presents significant avenues for market penetration. The global market penetration rate for advanced elemental analysis solutions is expected to climb from approximately 45% in 2024 to over 60% by 2033. Furthermore, the increasing complexity of scientific research and the need for higher resolution elemental mapping are creating demand for sophisticated techniques like advanced mass spectrometry and high-resolution X-ray techniques. The integration of cloud-based data management and analysis platforms also represents a significant opportunity for market players to offer integrated solutions.
Dominant Markets & Segments in Elemental Industry
The Pharmaceutical and Biotechnology Companies segment stands out as a dominant force within the Elemental Industry, driven by stringent regulatory requirements for drug safety and efficacy, necessitating rigorous elemental impurity testing. This segment is projected to contribute over 35% of the total market revenue by 2033. Within this segment, Organic Elemental Analysis holds significant sway due to the critical need to identify and quantify organic compounds and their elemental composition.
Nondestructive Technologies, particularly X-Ray Fluorescence Spectroscopy (XRF), are experiencing remarkable growth due to their ability to analyze samples without damage, making them ideal for sensitive pharmaceutical formulations and valuable materials. The XRF market segment alone is estimated to grow at a CAGR of 7.2% between 2025 and 2033.
Geographically, North America and Europe currently dominate the Elemental Industry, owing to well-established pharmaceutical and research infrastructure, stringent environmental regulations, and high adoption rates of advanced analytical technologies. However, the Asia Pacific region is rapidly emerging as a key growth market, fueled by expanding pharmaceutical manufacturing, increasing R&D investments, and a growing focus on environmental protection. China and India, in particular, are expected to witness substantial market expansion.
- Key Growth Drivers (End User - Pharmaceutical & Biotechnology):
- Increasing stringency of regulatory guidelines (e.g., ICH Q3D) for elemental impurities.
- Growth in biopharmaceutical research and development requiring precise elemental profiling.
- Demand for rapid and accurate quality control of raw materials and finished products.
- Key Growth Drivers (Technology - XRF):
- Non-destructive nature of analysis, preserving sample integrity.
- Versatility in analyzing a wide range of sample types and matrices.
- Advancements in portability and ease of use.
- Dominant Segment (Type - Organic Elemental Analysis):
- Critical for drug discovery, development, and quality assurance.
- Essential for characterizing complex organic molecules.
- Growing applications in food and environmental analysis.
Elemental Industry Product Analysis
Product innovations in the Elemental Industry are primarily focused on enhancing analytical performance and user experience. Companies are developing more compact, portable, and automated elemental analyzers that offer faster analysis times, lower detection limits, and broader elemental coverage. Destructive Technologies like Combustion Analysis are being refined for increased efficiency and accuracy in organic elemental analysis, while Nondestructive Technologies such as XRF are seeing advancements in detector sensitivity and spectral resolution. The integration of AI and ML in software platforms is also a significant trend, enabling sophisticated data interpretation and predictive maintenance. These advancements cater to the increasing demand for on-site analysis, rapid screening, and detailed material characterization across diverse sectors, offering competitive advantages through superior sensitivity, reduced sample preparation, and enhanced workflow integration.
Key Drivers, Barriers & Challenges in Elemental Industry
Key Drivers: The Elemental Industry is propelled by several key drivers. Technological advancements in spectroscopy and sample preparation are continuously enhancing analytical capabilities, leading to higher sensitivity and specificity. Stringent regulatory frameworks worldwide, particularly in pharmaceuticals, environmental monitoring, and food safety, mandate precise elemental analysis, creating a consistent demand for advanced instrumentation. Growing investments in research and development across academia and industry, especially in areas like advanced materials and life sciences, are spurring innovation and the adoption of sophisticated analytical tools. Furthermore, the increasing awareness of environmental pollution and the need for effective monitoring of heavy metals and other hazardous elements are driving market growth. The development of miniaturized and portable instruments also contributes significantly, enabling on-site analysis and expanding applications.
Barriers & Challenges: Despite robust growth, the Elemental Industry faces several barriers and challenges. High initial investment costs for sophisticated elemental analysis instrumentation can be a significant barrier for smaller organizations and emerging markets. The complexity of sample preparation for certain matrices, though improving, still requires specialized expertise and can be time-consuming. Stringent and evolving regulatory landscapes, while driving demand, also present challenges in terms of compliance and the continuous need for method validation and updates. Supply chain disruptions, as witnessed in recent years, can impact the availability of critical components and raw materials, leading to production delays and increased costs. Intense competition among established players and new entrants necessitates continuous innovation and competitive pricing strategies. The lack of skilled personnel with expertise in operating and maintaining advanced elemental analysis instruments can also pose a challenge in certain regions.
Growth Drivers in the Elemental Industry Market
The Elemental Industry market growth is predominantly fueled by advancements in analytical technologies, such as the development of highly sensitive detectors and improved spectral resolution, enabling the detection of trace elements with unprecedented accuracy. Economic factors, including increased R&D spending in the pharmaceutical, biotechnology, and materials science sectors, directly translate into higher demand for elemental analysis instrumentation. Policy-driven initiatives, such as stricter environmental protection regulations and food safety standards globally, necessitate robust elemental analysis for compliance, creating sustained market opportunities. The growing awareness and concern regarding the impact of heavy metals on human health and the environment are also significant societal drivers. Furthermore, the burgeoning need for quality control in manufacturing processes across various industries, from electronics to energy, contributes to market expansion.
Challenges Impacting Elemental Industry Growth
Several challenges can impact the growth trajectory of the Elemental Industry. Regulatory complexities and the constant need for method validation can create hurdles for manufacturers and end-users, requiring significant time and resources. Supply chain vulnerabilities, including the availability of specialized components and raw materials, can lead to production delays and increased costs, affecting market supply. Intense competitive pressures from both established multinational corporations and emerging specialized firms necessitate continuous innovation and strategic pricing, potentially impacting profit margins. The high cost of advanced instrumentation can also be a significant barrier to adoption, particularly for smaller enterprises and research institutions in developing economies. Furthermore, the shortage of skilled professionals capable of operating and maintaining complex elemental analysis systems can hinder widespread adoption and effective utilization of these technologies.
Key Players Shaping the Elemental Industry Market
- Verder Scientific GmbH & Co KG (ELTRA GmbH)
- HORIBA Ltd
- Analytik Jena GmbH+Co KG
- Eurofins Scientific
- Thermo Fisher Scientific Inc
- Bruker
- Agilent Technologies Inc
- Elemental Analysis Inc
- PerkinElmer Inc
- Angstrom Advanced Inc
- Shimadzu Corporation
- Rigaku Corporation
Significant Elemental Industry Industry Milestones
- July 2022: SPECTRO Analytical Instruments launched the SPECTROMAXx LMX10 arc/spark OES analyzer, featuring new advancements like extended calibration ranges and improved limits of detection (LODs) for metal analysis.
- May 2022: Analytik Jena introduced its PlasmaQuant MS ICP-MS series, offering high-throughput drinking water analysis capable of analyzing 60 samples per hour for 21 elements with low standard deviation.
Future Outlook for Elemental Industry Market
The future outlook for the Elemental Industry is exceptionally promising, driven by an ever-increasing demand for precise and comprehensive elemental characterization. Emerging opportunities lie in the expansion of elemental analysis applications in fields like battery technology, renewable energy materials, and personalized medicine, where intricate elemental compositions are critical. The continued integration of automation, AI, and cloud-based data solutions will streamline workflows and enhance data interpretation, making advanced elemental analysis more accessible and efficient. Furthermore, the growing emphasis on sustainability and the circular economy will necessitate advanced elemental analysis for material recycling and environmental remediation. Strategic partnerships, technological collaborations, and a focus on developing cost-effective solutions will be pivotal for market players to capitalize on the substantial growth potential and address evolving industry needs.
Elemental Industry Segmentation
-
1. Type
- 1.1. Organic Elemental Analysis
- 1.2. Inorganic Elemental Analysis
-
2. Technology
-
2.1. Destructive Technologies
- 2.1.1. Wet Digestion
- 2.1.2. Combustion Analysis
- 2.1.3. Others
-
2.2. Nondestructive Technologies
- 2.2.1. X-Ray Fluorescence Spectroscopy (XRF)
- 2.2.2. Fourier Transform Infrared Spectroscopy (FTIR)
-
2.1. Destructive Technologies
-
3. End User
- 3.1. Pharmaceutical and Biotechnology Companies
- 3.2. Research Organizations
- 3.3. Others
Elemental Industry Segmentation By Geography
-
1. North America
- 1.1. United States
- 1.2. Canada
- 1.3. Mexico
-
2. Europe
- 2.1. Germany
- 2.2. United Kingdom
- 2.3. France
- 2.4. Italy
- 2.5. Spain
- 2.6. Rest of Europe
-
3. Asia Pacific
- 3.1. China
- 3.2. Japan
- 3.3. India
- 3.4. Australia
- 3.5. South Korea
- 3.6. Rest of Asia Pacific
-
4. Middle East and Africa
- 4.1. GCC
- 4.2. South Africa
- 4.3. Rest of Middle East and Africa
-
5. South America
- 5.1. Brazil
- 5.2. Argentina
- 5.3. Rest of South America
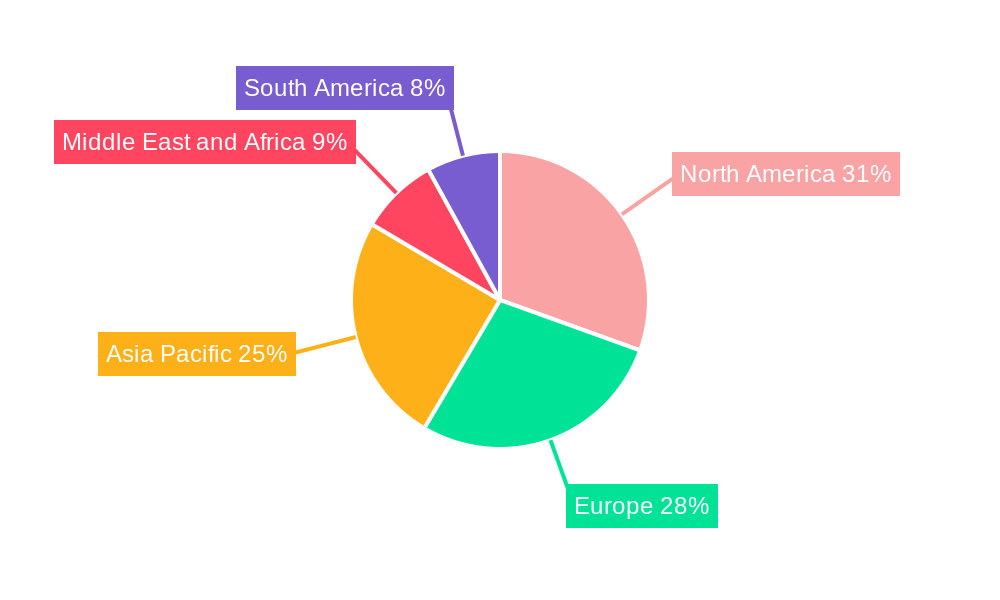
Elemental Industry Regional Market Share
Geographic Coverage of Elemental Industry
Elemental Industry REPORT HIGHLIGHTS
| Aspects | Details |
|---|---|
| Study Period | 2020-2034 |
| Base Year | 2025 |
| Estimated Year | 2026 |
| Forecast Period | 2026-2034 |
| Historical Period | 2020-2025 |
| Growth Rate | CAGR of 6.5% from 2020-2034 |
| Segmentation |
|
Table of Contents
- 1. Introduction
- 1.1. Research Scope
- 1.2. Market Segmentation
- 1.3. Research Objective
- 1.4. Definitions and Assumptions
- 2. Executive Summary
- 2.1. Market Snapshot
- 3. Market Dynamics
- 3.1. Market Drivers
- 3.2. Market Restrains
- 3.3. Market Trends
- 3.4. Market Opportunities
- 4. Market Factor Analysis
- 4.1. Porters Five Forces
- 4.1.1. Bargaining Power of Suppliers
- 4.1.2. Bargaining Power of Buyers
- 4.1.3. Threat of New Entrants
- 4.1.4. Threat of Substitutes
- 4.1.5. Competitive Rivalry
- 4.2. PESTEL analysis
- 4.3. BCG Analysis
- 4.3.1. Stars (High Growth, High Market Share)
- 4.3.2. Cash Cows (Low Growth, High Market Share)
- 4.3.3. Question Mark (High Growth, Low Market Share)
- 4.3.4. Dogs (Low Growth, Low Market Share)
- 4.4. Ansoff Matrix Analysis
- 4.5. Supply Chain Analysis
- 4.6. Regulatory Landscape
- 4.7. Current Market Potential and Opportunity Assessment (TAM–SAM–SOM Framework)
- 4.8. TIR Analyst Note
- 4.1. Porters Five Forces
- 5. Market Analysis, Insights and Forecast 2021-2033
- 5.1. Market Analysis, Insights and Forecast - by Type
- 5.1.1. Organic Elemental Analysis
- 5.1.2. Inorganic Elemental Analysis
- 5.2. Market Analysis, Insights and Forecast - by Technology
- 5.2.1. Destructive Technologies
- 5.2.1.1. Wet Digestion
- 5.2.1.2. Combustion Analysis
- 5.2.1.3. Others
- 5.2.2. Nondestructive Technologies
- 5.2.2.1. X-Ray Fluorescence Spectroscopy (XRF)
- 5.2.2.2. Fourier Transform Infrared Spectroscopy (FTIR)
- 5.2.1. Destructive Technologies
- 5.3. Market Analysis, Insights and Forecast - by End User
- 5.3.1. Pharmaceutical and Biotechnology Companies
- 5.3.2. Research Organizations
- 5.3.3. Others
- 5.4. Market Analysis, Insights and Forecast - by Region
- 5.4.1. North America
- 5.4.2. Europe
- 5.4.3. Asia Pacific
- 5.4.4. Middle East and Africa
- 5.4.5. South America
- 5.1. Market Analysis, Insights and Forecast - by Type
- 6. Global Elemental Industry Analysis, Insights and Forecast, 2021-2033
- 6.1. Market Analysis, Insights and Forecast - by Type
- 6.1.1. Organic Elemental Analysis
- 6.1.2. Inorganic Elemental Analysis
- 6.2. Market Analysis, Insights and Forecast - by Technology
- 6.2.1. Destructive Technologies
- 6.2.1.1. Wet Digestion
- 6.2.1.2. Combustion Analysis
- 6.2.1.3. Others
- 6.2.2. Nondestructive Technologies
- 6.2.2.1. X-Ray Fluorescence Spectroscopy (XRF)
- 6.2.2.2. Fourier Transform Infrared Spectroscopy (FTIR)
- 6.2.1. Destructive Technologies
- 6.3. Market Analysis, Insights and Forecast - by End User
- 6.3.1. Pharmaceutical and Biotechnology Companies
- 6.3.2. Research Organizations
- 6.3.3. Others
- 6.1. Market Analysis, Insights and Forecast - by Type
- 7. North America Elemental Industry Analysis, Insights and Forecast, 2020-2032
- 7.1. Market Analysis, Insights and Forecast - by Type
- 7.1.1. Organic Elemental Analysis
- 7.1.2. Inorganic Elemental Analysis
- 7.2. Market Analysis, Insights and Forecast - by Technology
- 7.2.1. Destructive Technologies
- 7.2.1.1. Wet Digestion
- 7.2.1.2. Combustion Analysis
- 7.2.1.3. Others
- 7.2.2. Nondestructive Technologies
- 7.2.2.1. X-Ray Fluorescence Spectroscopy (XRF)
- 7.2.2.2. Fourier Transform Infrared Spectroscopy (FTIR)
- 7.2.1. Destructive Technologies
- 7.3. Market Analysis, Insights and Forecast - by End User
- 7.3.1. Pharmaceutical and Biotechnology Companies
- 7.3.2. Research Organizations
- 7.3.3. Others
- 7.1. Market Analysis, Insights and Forecast - by Type
- 8. Europe Elemental Industry Analysis, Insights and Forecast, 2020-2032
- 8.1. Market Analysis, Insights and Forecast - by Type
- 8.1.1. Organic Elemental Analysis
- 8.1.2. Inorganic Elemental Analysis
- 8.2. Market Analysis, Insights and Forecast - by Technology
- 8.2.1. Destructive Technologies
- 8.2.1.1. Wet Digestion
- 8.2.1.2. Combustion Analysis
- 8.2.1.3. Others
- 8.2.2. Nondestructive Technologies
- 8.2.2.1. X-Ray Fluorescence Spectroscopy (XRF)
- 8.2.2.2. Fourier Transform Infrared Spectroscopy (FTIR)
- 8.2.1. Destructive Technologies
- 8.3. Market Analysis, Insights and Forecast - by End User
- 8.3.1. Pharmaceutical and Biotechnology Companies
- 8.3.2. Research Organizations
- 8.3.3. Others
- 8.1. Market Analysis, Insights and Forecast - by Type
- 9. Asia Pacific Elemental Industry Analysis, Insights and Forecast, 2020-2032
- 9.1. Market Analysis, Insights and Forecast - by Type
- 9.1.1. Organic Elemental Analysis
- 9.1.2. Inorganic Elemental Analysis
- 9.2. Market Analysis, Insights and Forecast - by Technology
- 9.2.1. Destructive Technologies
- 9.2.1.1. Wet Digestion
- 9.2.1.2. Combustion Analysis
- 9.2.1.3. Others
- 9.2.2. Nondestructive Technologies
- 9.2.2.1. X-Ray Fluorescence Spectroscopy (XRF)
- 9.2.2.2. Fourier Transform Infrared Spectroscopy (FTIR)
- 9.2.1. Destructive Technologies
- 9.3. Market Analysis, Insights and Forecast - by End User
- 9.3.1. Pharmaceutical and Biotechnology Companies
- 9.3.2. Research Organizations
- 9.3.3. Others
- 9.1. Market Analysis, Insights and Forecast - by Type
- 10. Middle East and Africa Elemental Industry Analysis, Insights and Forecast, 2020-2032
- 10.1. Market Analysis, Insights and Forecast - by Type
- 10.1.1. Organic Elemental Analysis
- 10.1.2. Inorganic Elemental Analysis
- 10.2. Market Analysis, Insights and Forecast - by Technology
- 10.2.1. Destructive Technologies
- 10.2.1.1. Wet Digestion
- 10.2.1.2. Combustion Analysis
- 10.2.1.3. Others
- 10.2.2. Nondestructive Technologies
- 10.2.2.1. X-Ray Fluorescence Spectroscopy (XRF)
- 10.2.2.2. Fourier Transform Infrared Spectroscopy (FTIR)
- 10.2.1. Destructive Technologies
- 10.3. Market Analysis, Insights and Forecast - by End User
- 10.3.1. Pharmaceutical and Biotechnology Companies
- 10.3.2. Research Organizations
- 10.3.3. Others
- 10.1. Market Analysis, Insights and Forecast - by Type
- 11. South America Elemental Industry Analysis, Insights and Forecast, 2020-2032
- 11.1. Market Analysis, Insights and Forecast - by Type
- 11.1.1. Organic Elemental Analysis
- 11.1.2. Inorganic Elemental Analysis
- 11.2. Market Analysis, Insights and Forecast - by Technology
- 11.2.1. Destructive Technologies
- 11.2.1.1. Wet Digestion
- 11.2.1.2. Combustion Analysis
- 11.2.1.3. Others
- 11.2.2. Nondestructive Technologies
- 11.2.2.1. X-Ray Fluorescence Spectroscopy (XRF)
- 11.2.2.2. Fourier Transform Infrared Spectroscopy (FTIR)
- 11.2.1. Destructive Technologies
- 11.3. Market Analysis, Insights and Forecast - by End User
- 11.3.1. Pharmaceutical and Biotechnology Companies
- 11.3.2. Research Organizations
- 11.3.3. Others
- 11.1. Market Analysis, Insights and Forecast - by Type
- 12. Competitive Analysis
- 12.1. Company Profiles
- 12.1.1 Verder Scientific GmbH & Co KG (ELTRA GmbH)
- 12.1.1.1. Company Overview
- 12.1.1.2. Products
- 12.1.1.3. Company Financials
- 12.1.1.4. SWOT Analysis
- 12.1.2 HORIBA Ltd
- 12.1.2.1. Company Overview
- 12.1.2.2. Products
- 12.1.2.3. Company Financials
- 12.1.2.4. SWOT Analysis
- 12.1.3 Analytik Jena GmbH+Co KG
- 12.1.3.1. Company Overview
- 12.1.3.2. Products
- 12.1.3.3. Company Financials
- 12.1.3.4. SWOT Analysis
- 12.1.4 Eurofins Scientific
- 12.1.4.1. Company Overview
- 12.1.4.2. Products
- 12.1.4.3. Company Financials
- 12.1.4.4. SWOT Analysis
- 12.1.5 Thermo Fisher Scientific Inc
- 12.1.5.1. Company Overview
- 12.1.5.2. Products
- 12.1.5.3. Company Financials
- 12.1.5.4. SWOT Analysis
- 12.1.6 Bruker
- 12.1.6.1. Company Overview
- 12.1.6.2. Products
- 12.1.6.3. Company Financials
- 12.1.6.4. SWOT Analysis
- 12.1.7 Agilent Technologies Inc
- 12.1.7.1. Company Overview
- 12.1.7.2. Products
- 12.1.7.3. Company Financials
- 12.1.7.4. SWOT Analysis
- 12.1.8 Elemental Analysis Inc
- 12.1.8.1. Company Overview
- 12.1.8.2. Products
- 12.1.8.3. Company Financials
- 12.1.8.4. SWOT Analysis
- 12.1.9 PerkinElmer Inc
- 12.1.9.1. Company Overview
- 12.1.9.2. Products
- 12.1.9.3. Company Financials
- 12.1.9.4. SWOT Analysis
- 12.1.10 Angstrom Advanced Inc
- 12.1.10.1. Company Overview
- 12.1.10.2. Products
- 12.1.10.3. Company Financials
- 12.1.10.4. SWOT Analysis
- 12.1.11 Shimadzu Corporation
- 12.1.11.1. Company Overview
- 12.1.11.2. Products
- 12.1.11.3. Company Financials
- 12.1.11.4. SWOT Analysis
- 12.1.12 Rigaku Corporation
- 12.1.12.1. Company Overview
- 12.1.12.2. Products
- 12.1.12.3. Company Financials
- 12.1.12.4. SWOT Analysis
- 12.1.1 Verder Scientific GmbH & Co KG (ELTRA GmbH)
- 12.2. Market Entropy
- 12.2.1 Company's Key Areas Served
- 12.2.2 Recent Developments
- 12.3. Company Market Share Analysis 2025
- 12.3.1 Top 5 Companies Market Share Analysis
- 12.3.2 Top 3 Companies Market Share Analysis
- 12.4. List of Potential Customers
- 13. Research Methodology
List of Figures
- Figure 1: Global Elemental Industry Revenue Breakdown (billion, %) by Region 2025 & 2033
- Figure 2: Global Elemental Industry Volume Breakdown (K Unit, %) by Region 2025 & 2033
- Figure 3: North America Elemental Industry Revenue (billion), by Type 2025 & 2033
- Figure 4: North America Elemental Industry Volume (K Unit), by Type 2025 & 2033
- Figure 5: North America Elemental Industry Revenue Share (%), by Type 2025 & 2033
- Figure 6: North America Elemental Industry Volume Share (%), by Type 2025 & 2033
- Figure 7: North America Elemental Industry Revenue (billion), by Technology 2025 & 2033
- Figure 8: North America Elemental Industry Volume (K Unit), by Technology 2025 & 2033
- Figure 9: North America Elemental Industry Revenue Share (%), by Technology 2025 & 2033
- Figure 10: North America Elemental Industry Volume Share (%), by Technology 2025 & 2033
- Figure 11: North America Elemental Industry Revenue (billion), by End User 2025 & 2033
- Figure 12: North America Elemental Industry Volume (K Unit), by End User 2025 & 2033
- Figure 13: North America Elemental Industry Revenue Share (%), by End User 2025 & 2033
- Figure 14: North America Elemental Industry Volume Share (%), by End User 2025 & 2033
- Figure 15: North America Elemental Industry Revenue (billion), by Country 2025 & 2033
- Figure 16: North America Elemental Industry Volume (K Unit), by Country 2025 & 2033
- Figure 17: North America Elemental Industry Revenue Share (%), by Country 2025 & 2033
- Figure 18: North America Elemental Industry Volume Share (%), by Country 2025 & 2033
- Figure 19: Europe Elemental Industry Revenue (billion), by Type 2025 & 2033
- Figure 20: Europe Elemental Industry Volume (K Unit), by Type 2025 & 2033
- Figure 21: Europe Elemental Industry Revenue Share (%), by Type 2025 & 2033
- Figure 22: Europe Elemental Industry Volume Share (%), by Type 2025 & 2033
- Figure 23: Europe Elemental Industry Revenue (billion), by Technology 2025 & 2033
- Figure 24: Europe Elemental Industry Volume (K Unit), by Technology 2025 & 2033
- Figure 25: Europe Elemental Industry Revenue Share (%), by Technology 2025 & 2033
- Figure 26: Europe Elemental Industry Volume Share (%), by Technology 2025 & 2033
- Figure 27: Europe Elemental Industry Revenue (billion), by End User 2025 & 2033
- Figure 28: Europe Elemental Industry Volume (K Unit), by End User 2025 & 2033
- Figure 29: Europe Elemental Industry Revenue Share (%), by End User 2025 & 2033
- Figure 30: Europe Elemental Industry Volume Share (%), by End User 2025 & 2033
- Figure 31: Europe Elemental Industry Revenue (billion), by Country 2025 & 2033
- Figure 32: Europe Elemental Industry Volume (K Unit), by Country 2025 & 2033
- Figure 33: Europe Elemental Industry Revenue Share (%), by Country 2025 & 2033
- Figure 34: Europe Elemental Industry Volume Share (%), by Country 2025 & 2033
- Figure 35: Asia Pacific Elemental Industry Revenue (billion), by Type 2025 & 2033
- Figure 36: Asia Pacific Elemental Industry Volume (K Unit), by Type 2025 & 2033
- Figure 37: Asia Pacific Elemental Industry Revenue Share (%), by Type 2025 & 2033
- Figure 38: Asia Pacific Elemental Industry Volume Share (%), by Type 2025 & 2033
- Figure 39: Asia Pacific Elemental Industry Revenue (billion), by Technology 2025 & 2033
- Figure 40: Asia Pacific Elemental Industry Volume (K Unit), by Technology 2025 & 2033
- Figure 41: Asia Pacific Elemental Industry Revenue Share (%), by Technology 2025 & 2033
- Figure 42: Asia Pacific Elemental Industry Volume Share (%), by Technology 2025 & 2033
- Figure 43: Asia Pacific Elemental Industry Revenue (billion), by End User 2025 & 2033
- Figure 44: Asia Pacific Elemental Industry Volume (K Unit), by End User 2025 & 2033
- Figure 45: Asia Pacific Elemental Industry Revenue Share (%), by End User 2025 & 2033
- Figure 46: Asia Pacific Elemental Industry Volume Share (%), by End User 2025 & 2033
- Figure 47: Asia Pacific Elemental Industry Revenue (billion), by Country 2025 & 2033
- Figure 48: Asia Pacific Elemental Industry Volume (K Unit), by Country 2025 & 2033
- Figure 49: Asia Pacific Elemental Industry Revenue Share (%), by Country 2025 & 2033
- Figure 50: Asia Pacific Elemental Industry Volume Share (%), by Country 2025 & 2033
- Figure 51: Middle East and Africa Elemental Industry Revenue (billion), by Type 2025 & 2033
- Figure 52: Middle East and Africa Elemental Industry Volume (K Unit), by Type 2025 & 2033
- Figure 53: Middle East and Africa Elemental Industry Revenue Share (%), by Type 2025 & 2033
- Figure 54: Middle East and Africa Elemental Industry Volume Share (%), by Type 2025 & 2033
- Figure 55: Middle East and Africa Elemental Industry Revenue (billion), by Technology 2025 & 2033
- Figure 56: Middle East and Africa Elemental Industry Volume (K Unit), by Technology 2025 & 2033
- Figure 57: Middle East and Africa Elemental Industry Revenue Share (%), by Technology 2025 & 2033
- Figure 58: Middle East and Africa Elemental Industry Volume Share (%), by Technology 2025 & 2033
- Figure 59: Middle East and Africa Elemental Industry Revenue (billion), by End User 2025 & 2033
- Figure 60: Middle East and Africa Elemental Industry Volume (K Unit), by End User 2025 & 2033
- Figure 61: Middle East and Africa Elemental Industry Revenue Share (%), by End User 2025 & 2033
- Figure 62: Middle East and Africa Elemental Industry Volume Share (%), by End User 2025 & 2033
- Figure 63: Middle East and Africa Elemental Industry Revenue (billion), by Country 2025 & 2033
- Figure 64: Middle East and Africa Elemental Industry Volume (K Unit), by Country 2025 & 2033
- Figure 65: Middle East and Africa Elemental Industry Revenue Share (%), by Country 2025 & 2033
- Figure 66: Middle East and Africa Elemental Industry Volume Share (%), by Country 2025 & 2033
- Figure 67: South America Elemental Industry Revenue (billion), by Type 2025 & 2033
- Figure 68: South America Elemental Industry Volume (K Unit), by Type 2025 & 2033
- Figure 69: South America Elemental Industry Revenue Share (%), by Type 2025 & 2033
- Figure 70: South America Elemental Industry Volume Share (%), by Type 2025 & 2033
- Figure 71: South America Elemental Industry Revenue (billion), by Technology 2025 & 2033
- Figure 72: South America Elemental Industry Volume (K Unit), by Technology 2025 & 2033
- Figure 73: South America Elemental Industry Revenue Share (%), by Technology 2025 & 2033
- Figure 74: South America Elemental Industry Volume Share (%), by Technology 2025 & 2033
- Figure 75: South America Elemental Industry Revenue (billion), by End User 2025 & 2033
- Figure 76: South America Elemental Industry Volume (K Unit), by End User 2025 & 2033
- Figure 77: South America Elemental Industry Revenue Share (%), by End User 2025 & 2033
- Figure 78: South America Elemental Industry Volume Share (%), by End User 2025 & 2033
- Figure 79: South America Elemental Industry Revenue (billion), by Country 2025 & 2033
- Figure 80: South America Elemental Industry Volume (K Unit), by Country 2025 & 2033
- Figure 81: South America Elemental Industry Revenue Share (%), by Country 2025 & 2033
- Figure 82: South America Elemental Industry Volume Share (%), by Country 2025 & 2033
List of Tables
- Table 1: Global Elemental Industry Revenue billion Forecast, by Type 2020 & 2033
- Table 2: Global Elemental Industry Volume K Unit Forecast, by Type 2020 & 2033
- Table 3: Global Elemental Industry Revenue billion Forecast, by Technology 2020 & 2033
- Table 4: Global Elemental Industry Volume K Unit Forecast, by Technology 2020 & 2033
- Table 5: Global Elemental Industry Revenue billion Forecast, by End User 2020 & 2033
- Table 6: Global Elemental Industry Volume K Unit Forecast, by End User 2020 & 2033
- Table 7: Global Elemental Industry Revenue billion Forecast, by Region 2020 & 2033
- Table 8: Global Elemental Industry Volume K Unit Forecast, by Region 2020 & 2033
- Table 9: Global Elemental Industry Revenue billion Forecast, by Type 2020 & 2033
- Table 10: Global Elemental Industry Volume K Unit Forecast, by Type 2020 & 2033
- Table 11: Global Elemental Industry Revenue billion Forecast, by Technology 2020 & 2033
- Table 12: Global Elemental Industry Volume K Unit Forecast, by Technology 2020 & 2033
- Table 13: Global Elemental Industry Revenue billion Forecast, by End User 2020 & 2033
- Table 14: Global Elemental Industry Volume K Unit Forecast, by End User 2020 & 2033
- Table 15: Global Elemental Industry Revenue billion Forecast, by Country 2020 & 2033
- Table 16: Global Elemental Industry Volume K Unit Forecast, by Country 2020 & 2033
- Table 17: United States Elemental Industry Revenue (billion) Forecast, by Application 2020 & 2033
- Table 18: United States Elemental Industry Volume (K Unit) Forecast, by Application 2020 & 2033
- Table 19: Canada Elemental Industry Revenue (billion) Forecast, by Application 2020 & 2033
- Table 20: Canada Elemental Industry Volume (K Unit) Forecast, by Application 2020 & 2033
- Table 21: Mexico Elemental Industry Revenue (billion) Forecast, by Application 2020 & 2033
- Table 22: Mexico Elemental Industry Volume (K Unit) Forecast, by Application 2020 & 2033
- Table 23: Global Elemental Industry Revenue billion Forecast, by Type 2020 & 2033
- Table 24: Global Elemental Industry Volume K Unit Forecast, by Type 2020 & 2033
- Table 25: Global Elemental Industry Revenue billion Forecast, by Technology 2020 & 2033
- Table 26: Global Elemental Industry Volume K Unit Forecast, by Technology 2020 & 2033
- Table 27: Global Elemental Industry Revenue billion Forecast, by End User 2020 & 2033
- Table 28: Global Elemental Industry Volume K Unit Forecast, by End User 2020 & 2033
- Table 29: Global Elemental Industry Revenue billion Forecast, by Country 2020 & 2033
- Table 30: Global Elemental Industry Volume K Unit Forecast, by Country 2020 & 2033
- Table 31: Germany Elemental Industry Revenue (billion) Forecast, by Application 2020 & 2033
- Table 32: Germany Elemental Industry Volume (K Unit) Forecast, by Application 2020 & 2033
- Table 33: United Kingdom Elemental Industry Revenue (billion) Forecast, by Application 2020 & 2033
- Table 34: United Kingdom Elemental Industry Volume (K Unit) Forecast, by Application 2020 & 2033
- Table 35: France Elemental Industry Revenue (billion) Forecast, by Application 2020 & 2033
- Table 36: France Elemental Industry Volume (K Unit) Forecast, by Application 2020 & 2033
- Table 37: Italy Elemental Industry Revenue (billion) Forecast, by Application 2020 & 2033
- Table 38: Italy Elemental Industry Volume (K Unit) Forecast, by Application 2020 & 2033
- Table 39: Spain Elemental Industry Revenue (billion) Forecast, by Application 2020 & 2033
- Table 40: Spain Elemental Industry Volume (K Unit) Forecast, by Application 2020 & 2033
- Table 41: Rest of Europe Elemental Industry Revenue (billion) Forecast, by Application 2020 & 2033
- Table 42: Rest of Europe Elemental Industry Volume (K Unit) Forecast, by Application 2020 & 2033
- Table 43: Global Elemental Industry Revenue billion Forecast, by Type 2020 & 2033
- Table 44: Global Elemental Industry Volume K Unit Forecast, by Type 2020 & 2033
- Table 45: Global Elemental Industry Revenue billion Forecast, by Technology 2020 & 2033
- Table 46: Global Elemental Industry Volume K Unit Forecast, by Technology 2020 & 2033
- Table 47: Global Elemental Industry Revenue billion Forecast, by End User 2020 & 2033
- Table 48: Global Elemental Industry Volume K Unit Forecast, by End User 2020 & 2033
- Table 49: Global Elemental Industry Revenue billion Forecast, by Country 2020 & 2033
- Table 50: Global Elemental Industry Volume K Unit Forecast, by Country 2020 & 2033
- Table 51: China Elemental Industry Revenue (billion) Forecast, by Application 2020 & 2033
- Table 52: China Elemental Industry Volume (K Unit) Forecast, by Application 2020 & 2033
- Table 53: Japan Elemental Industry Revenue (billion) Forecast, by Application 2020 & 2033
- Table 54: Japan Elemental Industry Volume (K Unit) Forecast, by Application 2020 & 2033
- Table 55: India Elemental Industry Revenue (billion) Forecast, by Application 2020 & 2033
- Table 56: India Elemental Industry Volume (K Unit) Forecast, by Application 2020 & 2033
- Table 57: Australia Elemental Industry Revenue (billion) Forecast, by Application 2020 & 2033
- Table 58: Australia Elemental Industry Volume (K Unit) Forecast, by Application 2020 & 2033
- Table 59: South Korea Elemental Industry Revenue (billion) Forecast, by Application 2020 & 2033
- Table 60: South Korea Elemental Industry Volume (K Unit) Forecast, by Application 2020 & 2033
- Table 61: Rest of Asia Pacific Elemental Industry Revenue (billion) Forecast, by Application 2020 & 2033
- Table 62: Rest of Asia Pacific Elemental Industry Volume (K Unit) Forecast, by Application 2020 & 2033
- Table 63: Global Elemental Industry Revenue billion Forecast, by Type 2020 & 2033
- Table 64: Global Elemental Industry Volume K Unit Forecast, by Type 2020 & 2033
- Table 65: Global Elemental Industry Revenue billion Forecast, by Technology 2020 & 2033
- Table 66: Global Elemental Industry Volume K Unit Forecast, by Technology 2020 & 2033
- Table 67: Global Elemental Industry Revenue billion Forecast, by End User 2020 & 2033
- Table 68: Global Elemental Industry Volume K Unit Forecast, by End User 2020 & 2033
- Table 69: Global Elemental Industry Revenue billion Forecast, by Country 2020 & 2033
- Table 70: Global Elemental Industry Volume K Unit Forecast, by Country 2020 & 2033
- Table 71: GCC Elemental Industry Revenue (billion) Forecast, by Application 2020 & 2033
- Table 72: GCC Elemental Industry Volume (K Unit) Forecast, by Application 2020 & 2033
- Table 73: South Africa Elemental Industry Revenue (billion) Forecast, by Application 2020 & 2033
- Table 74: South Africa Elemental Industry Volume (K Unit) Forecast, by Application 2020 & 2033
- Table 75: Rest of Middle East and Africa Elemental Industry Revenue (billion) Forecast, by Application 2020 & 2033
- Table 76: Rest of Middle East and Africa Elemental Industry Volume (K Unit) Forecast, by Application 2020 & 2033
- Table 77: Global Elemental Industry Revenue billion Forecast, by Type 2020 & 2033
- Table 78: Global Elemental Industry Volume K Unit Forecast, by Type 2020 & 2033
- Table 79: Global Elemental Industry Revenue billion Forecast, by Technology 2020 & 2033
- Table 80: Global Elemental Industry Volume K Unit Forecast, by Technology 2020 & 2033
- Table 81: Global Elemental Industry Revenue billion Forecast, by End User 2020 & 2033
- Table 82: Global Elemental Industry Volume K Unit Forecast, by End User 2020 & 2033
- Table 83: Global Elemental Industry Revenue billion Forecast, by Country 2020 & 2033
- Table 84: Global Elemental Industry Volume K Unit Forecast, by Country 2020 & 2033
- Table 85: Brazil Elemental Industry Revenue (billion) Forecast, by Application 2020 & 2033
- Table 86: Brazil Elemental Industry Volume (K Unit) Forecast, by Application 2020 & 2033
- Table 87: Argentina Elemental Industry Revenue (billion) Forecast, by Application 2020 & 2033
- Table 88: Argentina Elemental Industry Volume (K Unit) Forecast, by Application 2020 & 2033
- Table 89: Rest of South America Elemental Industry Revenue (billion) Forecast, by Application 2020 & 2033
- Table 90: Rest of South America Elemental Industry Volume (K Unit) Forecast, by Application 2020 & 2033
Frequently Asked Questions
1. What is the projected Compound Annual Growth Rate (CAGR) of the Elemental Industry?
The projected CAGR is approximately 6.5%.
2. Which companies are prominent players in the Elemental Industry?
Key companies in the market include Verder Scientific GmbH & Co KG (ELTRA GmbH), HORIBA Ltd, Analytik Jena GmbH+Co KG, Eurofins Scientific, Thermo Fisher Scientific Inc, Bruker, Agilent Technologies Inc, Elemental Analysis Inc, PerkinElmer Inc, Angstrom Advanced Inc, Shimadzu Corporation, Rigaku Corporation.
3. What are the main segments of the Elemental Industry?
The market segments include Type, Technology, End User.
4. Can you provide details about the market size?
The market size is estimated to be USD 1.93 billion as of 2022.
5. What are some drivers contributing to market growth?
Growing R&D Funding in Life Sciences; Mandating Government Regulations for Elemental Analysis of Pharmaceutical and Healthcare Products.
6. What are the notable trends driving market growth?
Inorganic Elemental Analysis Dominate the Global Elemental Analysis Market During the Forecast Period.
7. Are there any restraints impacting market growth?
Lack of Skilled Personnel.
8. Can you provide examples of recent developments in the market?
In July 2022, SPECTRO Analytical Instruments launched the SPECTROMAXx LMX10 arc/spark OES analyzer for elemental analysis in metal-producing and fabricating plants and iron and non-ferrous foundries. The LMX10 has new advancements, including complete new factory calibrations, extended calibration ranges and element selections, optimized source excitation parameters, and improved limits of detection (LODs).
9. What pricing options are available for accessing the report?
Pricing options include single-user, multi-user, and enterprise licenses priced at USD 4750, USD 5250, and USD 8750 respectively.
10. Is the market size provided in terms of value or volume?
The market size is provided in terms of value, measured in billion and volume, measured in K Unit.
11. Are there any specific market keywords associated with the report?
Yes, the market keyword associated with the report is "Elemental Industry," which aids in identifying and referencing the specific market segment covered.
12. How do I determine which pricing option suits my needs best?
The pricing options vary based on user requirements and access needs. Individual users may opt for single-user licenses, while businesses requiring broader access may choose multi-user or enterprise licenses for cost-effective access to the report.
13. Are there any additional resources or data provided in the Elemental Industry report?
While the report offers comprehensive insights, it's advisable to review the specific contents or supplementary materials provided to ascertain if additional resources or data are available.
14. How can I stay updated on further developments or reports in the Elemental Industry?
To stay informed about further developments, trends, and reports in the Elemental Industry, consider subscribing to industry newsletters, following relevant companies and organizations, or regularly checking reputable industry news sources and publications.
Methodology
Step 1 - Identification of Relevant Samples Size from Population Database


Step 2 - Approaches for Defining Global Market Size (Value, Volume* & Price*)

Note*: In applicable scenarios
Step 3 - Data Sources
Primary Research
- Web Analytics
- Survey Reports
- Research Institute
- Latest Research Reports
- Opinion Leaders
Secondary Research
- Annual Reports
- White Paper
- Latest Press Release
- Industry Association
- Paid Database
- Investor Presentations

Step 4 - Data Triangulation
Involves using different sources of information in order to increase the validity of a study
These sources are likely to be stakeholders in a program - participants, other researchers, program staff, other community members, and so on.
Then we put all data in single framework & apply various statistical tools to find out the dynamic on the market.
During the analysis stage, feedback from the stakeholder groups would be compared to determine areas of agreement as well as areas of divergence