

Key Insights
The global Exoskeleton Market is poised for explosive growth, projected to reach USD 2.49 billion in 2025 and expand at an astonishing Compound Annual Growth Rate (CAGR) of 43.1% through 2033. This remarkable trajectory is fueled by significant advancements in robotics, artificial intelligence, and material science, which are making exoskeletons more sophisticated, affordable, and accessible. Key drivers include the increasing prevalence of mobility-impairing conditions such as strokes and spinal cord injuries, coupled with an aging global population requiring enhanced support for daily living and rehabilitation. Furthermore, the growing adoption of exoskeletons in industrial and military sectors for load-bearing assistance and enhanced performance is a substantial growth catalyst. The market is segmented across various applications, with rehabilitation exoskeletons leading the charge, followed by augmentation and therapeutic use cases. Within product types, both stationary and mobile exoskeletons are witnessing robust demand, catering to diverse user needs from clinical settings to on-field applications.
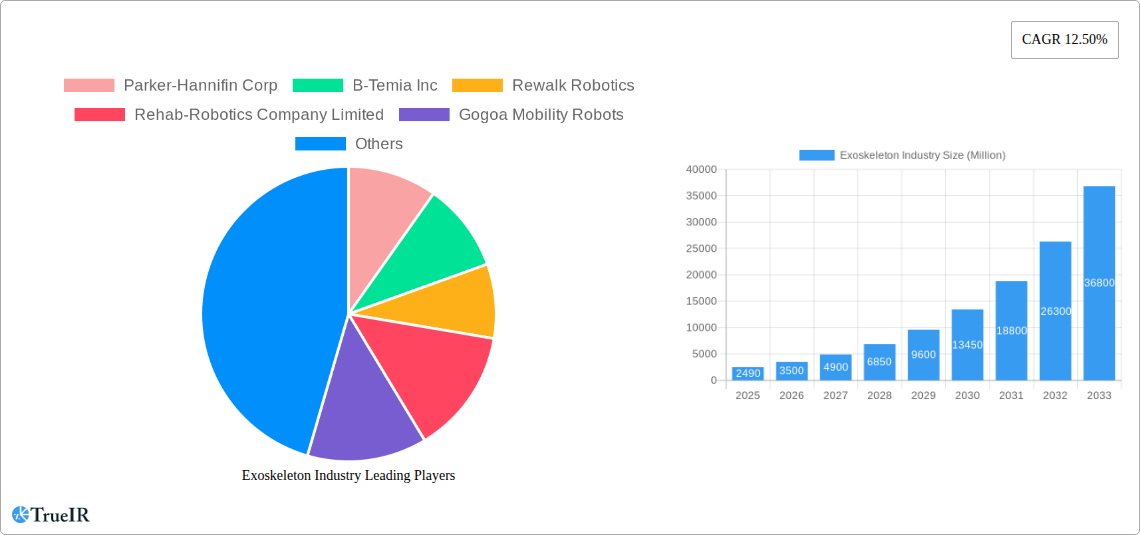
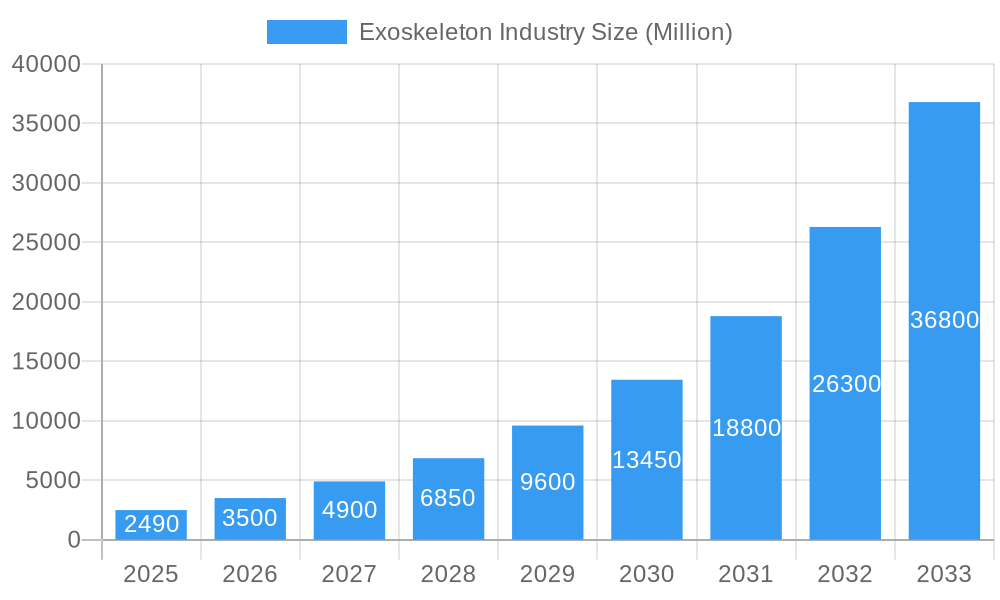
Exoskeleton Industry Market Size (In Billion)
The exoskeleton market's impressive expansion is also underpinned by several emerging trends. Personalized and adaptive exoskeletons that learn and respond to individual user movements and needs are gaining traction. The integration of advanced sensor technologies and intuitive control systems is enhancing user experience and efficacy. While the market is overwhelmingly optimistic, certain restraints, such as the high initial cost of advanced systems and the need for extensive user training, may present challenges. However, ongoing research and development, coupled with increasing government initiatives and funding for assistive technologies, are expected to mitigate these limitations. Geographically, North America and Europe are currently leading the market due to well-established healthcare infrastructure and early adoption rates. However, the Asia Pacific region is anticipated to exhibit the fastest growth, driven by rapid industrialization, increasing healthcare expenditure, and a burgeoning elderly population. Prominent players like Parker-Hannifin Corp, Rewalk Robotics, and Ekso Bionics Holdings are actively investing in innovation and strategic partnerships to capture a larger market share.
Exoskeleton Industry Company Market Share
This comprehensive report delves into the dynamic exoskeleton industry, a rapidly evolving sector poised to transform rehabilitation, industrial augmentation, and personal mobility. Spanning from the historical period of 2019–2024, with a base year of 2025 and an extensive forecast period extending to 2033, this analysis provides unparalleled insights into market structure, competitive landscape, key trends, dominant segments, product innovations, growth drivers, challenges, and the key players shaping this groundbreaking industry. Explore market sizes estimated in the billions, projected CAGR, and in-depth analysis of segments including Treatment Type (Rehabilitation, Augmentation), Body Part Type (Upper Body, Lower Body), and Product Type (Stationary, Mobile). Leverage high-volume keywords such as "exoskeleton technology," "wearable robotics," "assistive devices," "industrial exoskeletons," "rehabilitation robotics," and "mobility solutions" to enhance search visibility and engage a global audience of researchers, investors, manufacturers, and end-users.
Exoskeleton Industry Market Structure & Competitive Landscape
The exoskeleton industry exhibits a moderately concentrated market structure, with a growing number of innovative companies vying for dominance. Key innovation drivers include advancements in artificial intelligence, miniaturization of components, improved battery technology, and increased understanding of biomechanics. Regulatory impacts, particularly concerning medical device approvals and worker safety standards, play a crucial role in market entry and product development. Product substitutes, while currently limited, may emerge from advanced prosthetics and sophisticated assistive technologies. End-user segmentation is broad, encompassing healthcare providers, industrial manufacturers, military organizations, and individuals seeking enhanced mobility. Mergers and acquisitions (M&A) are becoming increasingly prevalent as larger corporations seek to acquire cutting-edge technologies and expand their market reach. During the historical period (2019-2024), an estimated $5.2 billion was invested across 250+ M&A deals within the broader robotics sector, with a significant portion flowing into exoskeleton development. Current concentration ratios suggest the top five players hold approximately 40% of the market share, with a notable trend towards consolidation in the rehabilitation segment.
- Innovation Drivers: AI-powered control systems, lightweight composite materials, advanced sensor integration, personalized user interfaces.
- Regulatory Impacts: FDA approvals for medical devices, OSHA guidelines for industrial safety, military procurement specifications.
- End-User Segmentation: Healthcare (rehabilitation, therapy), Industrial (manufacturing, logistics, construction), Military (troop augmentation, load bearing), Consumer (personal mobility, accessibility).
- M&A Trends: Strategic acquisitions for technology integration, partnerships for market expansion, venture capital funding for startups.
Exoskeleton Industry Market Trends & Opportunities
The exoskeleton market is poised for explosive growth, with an estimated market size of $8.5 billion in the base year 2025, projected to reach $25.3 billion by 2033, exhibiting a robust Compound Annual Growth Rate (CAGR) of approximately 14.5% during the forecast period (2025–2033). This significant expansion is fueled by a confluence of technological advancements, increasing global demand for assistive solutions, and growing awareness of the benefits of wearable robotic technology.
Technological shifts are at the forefront of this growth. Miniaturization of motors, sensors, and actuators, coupled with the development of more intelligent AI algorithms, is leading to exoskeletons that are lighter, more agile, and capable of more natural human-like movement. Advanced materials like carbon fiber composites are enhancing durability and reducing weight, making these devices more practical for extended use. The integration of sophisticated biosensors allows exoskeletons to adapt in real-time to user intent, providing more intuitive and effective assistance.
Consumer preferences are also evolving. In the healthcare sector, there is a growing demand for exoskeletons that can facilitate faster and more effective rehabilitation for patients with spinal cord injuries, stroke, and other neurological conditions. The desire for greater independence and improved quality of life is a powerful motivator. In industrial settings, companies are increasingly recognizing the potential of exoskeletons to reduce worker fatigue, prevent injuries, and boost productivity, especially in tasks involving heavy lifting or repetitive motions. The military sector continues to explore exoskeletons for troop augmentation, enhancing soldier capabilities in demanding operational environments.
Competitive dynamics within the exoskeleton industry are intensifying. Established players are investing heavily in R&D to maintain their edge, while nimble startups are emerging with disruptive technologies and novel applications. The market penetration rate for industrial exoskeletons, while still nascent, is expected to accelerate as cost-effectiveness and proven ROI become more apparent. For rehabilitation exoskeletons, the increasing adoption by healthcare institutions and the growing aging population present significant market opportunities. The global market for exoskeletons is estimated to have reached $4.1 billion in 2023, underscoring the substantial growth trajectory.
Dominant Markets & Segments in Exoskeleton Industry
The exoskeleton industry is witnessing significant growth across various segments, with Lower Body applications currently dominating the market, accounting for an estimated 60% of market revenue in the base year 2025. This dominance is largely driven by the extensive applications of lower body exoskeletons in Rehabilitation, a treatment type that represents 70% of the overall market. Countries in North America and Europe are leading the charge, contributing approximately 65% to the global market share due to advanced healthcare infrastructure, strong government initiatives supporting assistive technologies, and a higher disposable income for sophisticated medical equipment.
The Rehabilitation segment is propelled by a growing prevalence of neurological disorders, an aging global population, and increasing awareness of the efficacy of exoskeleton-assisted therapy. Infrastructure development in healthcare facilities, including specialized rehabilitation centers, further bolsters this segment. Policies promoting the integration of advanced medical technologies into patient care are also key growth drivers. For instance, reimbursement policies for exoskeleton-based therapies in countries like the United States and Germany are accelerating adoption.
The Augmentation segment, while smaller, is exhibiting rapid growth, particularly in industrial and military applications. This segment benefits from the need to enhance human physical capabilities in demanding work environments and operational settings. Investments in R&D for industrial exoskeletons are driven by the pursuit of improved worker safety, reduced musculoskeletal injuries, and increased productivity. Mobile product types, both for rehabilitation and augmentation, are gaining traction over stationary ones, offering greater flexibility and user autonomy. The increasing adoption of advanced materials and AI in Mobile exoskeletons is a critical factor in this trend. The Lower Body segment's dominance is expected to persist in the near term due to its established use cases in mobility assistance and therapeutic interventions.
- Leading Region: North America and Europe
- Dominant Treatment Type: Rehabilitation
- Dominant Body Part Type: Lower Body
- Key Growth Drivers for Rehabilitation: Aging population, increasing incidence of neurological disorders, advanced healthcare infrastructure, favorable reimbursement policies.
- Key Growth Drivers for Augmentation: Industrial automation, worker safety initiatives, military modernization programs, demand for enhanced human performance.
- Product Type Trend: Shift towards Mobile exoskeletons for greater flexibility and autonomy.
Exoskeleton Industry Product Analysis
The exoskeleton industry is characterized by a relentless pursuit of product innovation, focusing on enhanced user experience, improved functionality, and broader applicability. Key product advancements include the development of lighter, more ergonomic designs utilizing advanced composite materials and miniaturized actuators, leading to a more comfortable and less intrusive user experience. Integration of AI and machine learning algorithms is enabling more intuitive control, allowing exoskeletons to better interpret user intent and provide seamless, adaptive assistance. Applications are expanding beyond traditional rehabilitation to include industrial augmentation for heavy lifting and repetitive tasks, military troop support, and even consumer-level mobility assistance. The competitive advantage lies in developing exoskeletons that offer superior power-to-weight ratios, extended battery life, and personalized user profiles, thereby maximizing efficacy and user adoption.
Key Drivers, Barriers & Challenges in Exoskeleton Industry
The exoskeleton industry is propelled by significant growth drivers, including rapid technological advancements in robotics and AI, increasing global demand for assistive devices due to an aging population and rising incidence of mobility impairments, and growing awareness of the benefits of exoskeletons in both rehabilitation and industrial augmentation. Government initiatives and funding for research and development also play a crucial role. For example, military contracts and healthcare grants provide substantial impetus.
However, the industry faces considerable barriers and challenges. High manufacturing costs and the resulting premium pricing of exoskeletons limit widespread adoption, particularly in developing economies. Regulatory hurdles and the need for extensive clinical trials and approvals, especially for medical devices, can slow down market entry. Public perception and user acceptance, including the psychological barrier of relying on robotic assistance, also need to be addressed. Furthermore, integration challenges with existing infrastructure and the need for specialized training for operators and therapists present logistical obstacles. Supply chain complexities for specialized components and the competitive pressure from alternative assistive technologies also contribute to these challenges. The estimated cost of advanced medical exoskeletons can range from $50,000 to $150,000+, a significant barrier to individual purchase.
Growth Drivers in the Exoskeleton Industry Market
The exoskeleton industry is experiencing robust growth driven by several key factors. Technological innovation remains paramount, with continuous improvements in AI for intuitive control, advancements in materials science for lighter and stronger devices, and miniaturization of components leading to more compact and user-friendly designs. Economically, the increasing global healthcare expenditure, coupled with a growing emphasis on proactive rehabilitation and worker well-being, creates substantial demand. Government policies and initiatives, such as funding for R&D in assistive technologies and incentives for adopting industrial safety equipment, further fuel market expansion. For instance, national robotics initiatives in countries like South Korea and Japan are actively promoting the development and adoption of exoskeletons. The rising prevalence of age-related mobility issues and neurological conditions globally also acts as a strong demographic driver.
Challenges Impacting Exoskeleton Industry Growth
Despite its promising trajectory, the exoskeleton industry grapples with significant challenges that impede its growth. The substantial cost of development and manufacturing translates into high retail prices, making these advanced devices unaffordable for a large segment of the potential user base. Navigating the complex and often lengthy regulatory approval processes, especially for medical-grade exoskeletons, presents a major hurdle. Supply chain disruptions for specialized components, exacerbated by global economic volatility, can impact production timelines and costs. Furthermore, competitive pressures from established players and emerging technologies, alongside the need for extensive user training and integration into existing workflows or care protocols, add to the complexity. Overcoming user inertia and demonstrating clear, quantifiable ROI are crucial for broader market acceptance.
Key Players Shaping the Exoskeleton Industry Market
- Parker-Hannifin Corp
- B-Temia Inc
- Rewalk Robotics
- Rehab-Robotics Company Limited
- Gogoa Mobility Robots
- Bioservo Technologies AB
- Bionik Laboratories Corp
- Cyberdyne Inc
- Ekso Bionics Holdings
- Bioness Inc
Significant Exoskeleton Industry Industry Milestones
- 2019: Ekso Bionics Holdings secures FDA clearance for its EksoNR robotic exoskeleton, expanding its reach in rehabilitation.
- 2020: Cyberdyne Inc. advances its HAL exoskeleton technology with new applications for rehabilitation and industrial use.
- 2021: ReWalk Robotics receives CE marking for its ReStore™ Soft Exosuit, marking a significant step in wearable robotic rehabilitation.
- 2022: Parker-Hannifin Corp. introduces advanced solutions in its robotics and automation portfolio, including components for exoskeleton development.
- 2023: B-Temia Inc. focuses on its Keeogo™ exoskeleton for therapeutic purposes, expanding clinical trials and partnerships.
- 2024 (Estimated): Increased investment in soft robotics and AI integration for more agile and responsive exoskeleton systems.
Future Outlook for Exoskeleton Industry Market
The future outlook for the exoskeleton industry is exceptionally bright, driven by ongoing technological advancements, expanding applications, and increasing global adoption. Strategic opportunities lie in the development of more affordable and accessible exoskeleton solutions, the integration of advanced AI for predictive maintenance and enhanced user experience, and the expansion into emerging markets. The growing emphasis on preventative healthcare and industrial safety, coupled with supportive government policies, will continue to be significant growth catalysts. Market penetration is projected to accelerate as the benefits of enhanced mobility, improved rehabilitation outcomes, and increased human augmentation capabilities become more widely recognized and validated. The market is expected to witness further consolidation and strategic alliances as companies vie for leadership in this transformative sector, with projected market values reaching tens of billions of dollars within the next decade.
Exoskeleton Industry Segmentation
-
1. Treatment Type
- 1.1. Rehabilitation
- 1.2. Augmentation
-
2. Body Part Type
- 2.1. Upper Body
- 2.2. Lower Body
-
3. Product Type
- 3.1. Stationary
- 3.2. Mobile
Exoskeleton Industry Segmentation By Geography
-
1. North America
- 1.1. United States
- 1.2. Canada
- 1.3. Mexico
-
2. Europe
- 2.1. Germany
- 2.2. United Kingdom
- 2.3. France
- 2.4. Italy
- 2.5. Spain
- 2.6. Rest of Europe
-
3. Asia Pacific
- 3.1. China
- 3.2. Japan
- 3.3. India
- 3.4. Australia
- 3.5. South Korea
- 3.6. Rest of Asia Pacific
-
4. Middle East and Africa
- 4.1. GCC
- 4.2. South Africa
- 4.3. Rest of Middle East and Africa
-
5. South America
- 5.1. Brazil
- 5.2. Argentina
- 5.3. Rest of South America
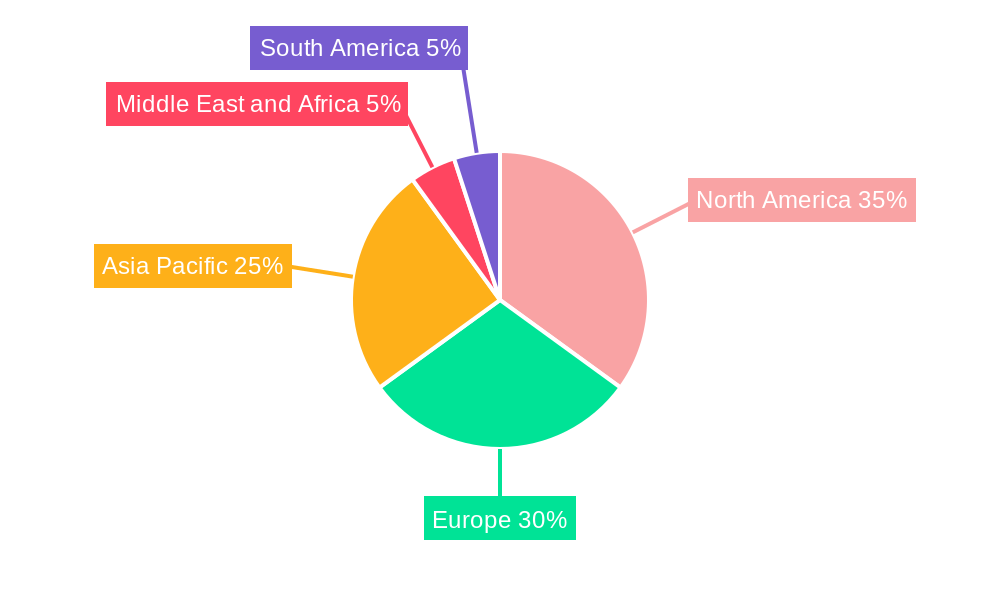
Exoskeleton Industry Regional Market Share
Geographic Coverage of Exoskeleton Industry
Exoskeleton Industry REPORT HIGHLIGHTS
| Aspects | Details |
|---|---|
| Study Period | 2020-2034 |
| Base Year | 2025 |
| Estimated Year | 2026 |
| Forecast Period | 2026-2034 |
| Historical Period | 2020-2025 |
| Growth Rate | CAGR of 43.1% from 2020-2034 |
| Segmentation |
|
Table of Contents
- 1. Introduction
- 1.1. Research Scope
- 1.2. Market Segmentation
- 1.3. Research Methodology
- 1.4. Definitions and Assumptions
- 2. Executive Summary
- 2.1. Introduction
- 3. Market Dynamics
- 3.1. Introduction
- 3.2. Market Drivers
- 3.2.1. Growing Demand from Healthcare Sector for Robotic Rehabilitation; Advancement in Robotic Technologies; Huge Investment for the Development of the Exoskeleton Technology
- 3.3. Market Restrains
- 3.3.1. Risks Involved with Using Exoskeletons Due to Vague Safety Guidelines
- 3.4. Market Trends
- 3.4.1. The Mobile Segment is Expected to Hold the Largest Share by Product Type Over the Forecast Period
- 4. Market Factor Analysis
- 4.1. Porters Five Forces
- 4.2. Supply/Value Chain
- 4.3. PESTEL analysis
- 4.4. Market Entropy
- 4.5. Patent/Trademark Analysis
- 5. Global Exoskeleton Industry Analysis, Insights and Forecast, 2020-2032
- 5.1. Market Analysis, Insights and Forecast - by Treatment Type
- 5.1.1. Rehabilitation
- 5.1.2. Augmentation
- 5.2. Market Analysis, Insights and Forecast - by Body Part Type
- 5.2.1. Upper Body
- 5.2.2. Lower Body
- 5.3. Market Analysis, Insights and Forecast - by Product Type
- 5.3.1. Stationary
- 5.3.2. Mobile
- 5.4. Market Analysis, Insights and Forecast - by Region
- 5.4.1. North America
- 5.4.2. Europe
- 5.4.3. Asia Pacific
- 5.4.4. Middle East and Africa
- 5.4.5. South America
- 5.1. Market Analysis, Insights and Forecast - by Treatment Type
- 6. North America Exoskeleton Industry Analysis, Insights and Forecast, 2020-2032
- 6.1. Market Analysis, Insights and Forecast - by Treatment Type
- 6.1.1. Rehabilitation
- 6.1.2. Augmentation
- 6.2. Market Analysis, Insights and Forecast - by Body Part Type
- 6.2.1. Upper Body
- 6.2.2. Lower Body
- 6.3. Market Analysis, Insights and Forecast - by Product Type
- 6.3.1. Stationary
- 6.3.2. Mobile
- 6.1. Market Analysis, Insights and Forecast - by Treatment Type
- 7. Europe Exoskeleton Industry Analysis, Insights and Forecast, 2020-2032
- 7.1. Market Analysis, Insights and Forecast - by Treatment Type
- 7.1.1. Rehabilitation
- 7.1.2. Augmentation
- 7.2. Market Analysis, Insights and Forecast - by Body Part Type
- 7.2.1. Upper Body
- 7.2.2. Lower Body
- 7.3. Market Analysis, Insights and Forecast - by Product Type
- 7.3.1. Stationary
- 7.3.2. Mobile
- 7.1. Market Analysis, Insights and Forecast - by Treatment Type
- 8. Asia Pacific Exoskeleton Industry Analysis, Insights and Forecast, 2020-2032
- 8.1. Market Analysis, Insights and Forecast - by Treatment Type
- 8.1.1. Rehabilitation
- 8.1.2. Augmentation
- 8.2. Market Analysis, Insights and Forecast - by Body Part Type
- 8.2.1. Upper Body
- 8.2.2. Lower Body
- 8.3. Market Analysis, Insights and Forecast - by Product Type
- 8.3.1. Stationary
- 8.3.2. Mobile
- 8.1. Market Analysis, Insights and Forecast - by Treatment Type
- 9. Middle East and Africa Exoskeleton Industry Analysis, Insights and Forecast, 2020-2032
- 9.1. Market Analysis, Insights and Forecast - by Treatment Type
- 9.1.1. Rehabilitation
- 9.1.2. Augmentation
- 9.2. Market Analysis, Insights and Forecast - by Body Part Type
- 9.2.1. Upper Body
- 9.2.2. Lower Body
- 9.3. Market Analysis, Insights and Forecast - by Product Type
- 9.3.1. Stationary
- 9.3.2. Mobile
- 9.1. Market Analysis, Insights and Forecast - by Treatment Type
- 10. South America Exoskeleton Industry Analysis, Insights and Forecast, 2020-2032
- 10.1. Market Analysis, Insights and Forecast - by Treatment Type
- 10.1.1. Rehabilitation
- 10.1.2. Augmentation
- 10.2. Market Analysis, Insights and Forecast - by Body Part Type
- 10.2.1. Upper Body
- 10.2.2. Lower Body
- 10.3. Market Analysis, Insights and Forecast - by Product Type
- 10.3.1. Stationary
- 10.3.2. Mobile
- 10.1. Market Analysis, Insights and Forecast - by Treatment Type
- 11. Competitive Analysis
- 11.1. Global Market Share Analysis 2025
- 11.2. Company Profiles
- 11.2.1 Parker-Hannifin Corp
- 11.2.1.1. Overview
- 11.2.1.2. Products
- 11.2.1.3. SWOT Analysis
- 11.2.1.4. Recent Developments
- 11.2.1.5. Financials (Based on Availability)
- 11.2.2 B-Temia Inc
- 11.2.2.1. Overview
- 11.2.2.2. Products
- 11.2.2.3. SWOT Analysis
- 11.2.2.4. Recent Developments
- 11.2.2.5. Financials (Based on Availability)
- 11.2.3 Rewalk Robotics
- 11.2.3.1. Overview
- 11.2.3.2. Products
- 11.2.3.3. SWOT Analysis
- 11.2.3.4. Recent Developments
- 11.2.3.5. Financials (Based on Availability)
- 11.2.4 Rehab-Robotics Company Limited
- 11.2.4.1. Overview
- 11.2.4.2. Products
- 11.2.4.3. SWOT Analysis
- 11.2.4.4. Recent Developments
- 11.2.4.5. Financials (Based on Availability)
- 11.2.5 Gogoa Mobility Robots
- 11.2.5.1. Overview
- 11.2.5.2. Products
- 11.2.5.3. SWOT Analysis
- 11.2.5.4. Recent Developments
- 11.2.5.5. Financials (Based on Availability)
- 11.2.6 Bioservo Technologies AB
- 11.2.6.1. Overview
- 11.2.6.2. Products
- 11.2.6.3. SWOT Analysis
- 11.2.6.4. Recent Developments
- 11.2.6.5. Financials (Based on Availability)
- 11.2.7 Bionik Laboratories Corp
- 11.2.7.1. Overview
- 11.2.7.2. Products
- 11.2.7.3. SWOT Analysis
- 11.2.7.4. Recent Developments
- 11.2.7.5. Financials (Based on Availability)
- 11.2.8 Cyberdyne Inc
- 11.2.8.1. Overview
- 11.2.8.2. Products
- 11.2.8.3. SWOT Analysis
- 11.2.8.4. Recent Developments
- 11.2.8.5. Financials (Based on Availability)
- 11.2.9 Ekso Bionics Holdings
- 11.2.9.1. Overview
- 11.2.9.2. Products
- 11.2.9.3. SWOT Analysis
- 11.2.9.4. Recent Developments
- 11.2.9.5. Financials (Based on Availability)
- 11.2.10 Bioness Inc
- 11.2.10.1. Overview
- 11.2.10.2. Products
- 11.2.10.3. SWOT Analysis
- 11.2.10.4. Recent Developments
- 11.2.10.5. Financials (Based on Availability)
- 11.2.1 Parker-Hannifin Corp
List of Figures
- Figure 1: Global Exoskeleton Industry Revenue Breakdown (undefined, %) by Region 2025 & 2033
- Figure 2: North America Exoskeleton Industry Revenue (undefined), by Treatment Type 2025 & 2033
- Figure 3: North America Exoskeleton Industry Revenue Share (%), by Treatment Type 2025 & 2033
- Figure 4: North America Exoskeleton Industry Revenue (undefined), by Body Part Type 2025 & 2033
- Figure 5: North America Exoskeleton Industry Revenue Share (%), by Body Part Type 2025 & 2033
- Figure 6: North America Exoskeleton Industry Revenue (undefined), by Product Type 2025 & 2033
- Figure 7: North America Exoskeleton Industry Revenue Share (%), by Product Type 2025 & 2033
- Figure 8: North America Exoskeleton Industry Revenue (undefined), by Country 2025 & 2033
- Figure 9: North America Exoskeleton Industry Revenue Share (%), by Country 2025 & 2033
- Figure 10: Europe Exoskeleton Industry Revenue (undefined), by Treatment Type 2025 & 2033
- Figure 11: Europe Exoskeleton Industry Revenue Share (%), by Treatment Type 2025 & 2033
- Figure 12: Europe Exoskeleton Industry Revenue (undefined), by Body Part Type 2025 & 2033
- Figure 13: Europe Exoskeleton Industry Revenue Share (%), by Body Part Type 2025 & 2033
- Figure 14: Europe Exoskeleton Industry Revenue (undefined), by Product Type 2025 & 2033
- Figure 15: Europe Exoskeleton Industry Revenue Share (%), by Product Type 2025 & 2033
- Figure 16: Europe Exoskeleton Industry Revenue (undefined), by Country 2025 & 2033
- Figure 17: Europe Exoskeleton Industry Revenue Share (%), by Country 2025 & 2033
- Figure 18: Asia Pacific Exoskeleton Industry Revenue (undefined), by Treatment Type 2025 & 2033
- Figure 19: Asia Pacific Exoskeleton Industry Revenue Share (%), by Treatment Type 2025 & 2033
- Figure 20: Asia Pacific Exoskeleton Industry Revenue (undefined), by Body Part Type 2025 & 2033
- Figure 21: Asia Pacific Exoskeleton Industry Revenue Share (%), by Body Part Type 2025 & 2033
- Figure 22: Asia Pacific Exoskeleton Industry Revenue (undefined), by Product Type 2025 & 2033
- Figure 23: Asia Pacific Exoskeleton Industry Revenue Share (%), by Product Type 2025 & 2033
- Figure 24: Asia Pacific Exoskeleton Industry Revenue (undefined), by Country 2025 & 2033
- Figure 25: Asia Pacific Exoskeleton Industry Revenue Share (%), by Country 2025 & 2033
- Figure 26: Middle East and Africa Exoskeleton Industry Revenue (undefined), by Treatment Type 2025 & 2033
- Figure 27: Middle East and Africa Exoskeleton Industry Revenue Share (%), by Treatment Type 2025 & 2033
- Figure 28: Middle East and Africa Exoskeleton Industry Revenue (undefined), by Body Part Type 2025 & 2033
- Figure 29: Middle East and Africa Exoskeleton Industry Revenue Share (%), by Body Part Type 2025 & 2033
- Figure 30: Middle East and Africa Exoskeleton Industry Revenue (undefined), by Product Type 2025 & 2033
- Figure 31: Middle East and Africa Exoskeleton Industry Revenue Share (%), by Product Type 2025 & 2033
- Figure 32: Middle East and Africa Exoskeleton Industry Revenue (undefined), by Country 2025 & 2033
- Figure 33: Middle East and Africa Exoskeleton Industry Revenue Share (%), by Country 2025 & 2033
- Figure 34: South America Exoskeleton Industry Revenue (undefined), by Treatment Type 2025 & 2033
- Figure 35: South America Exoskeleton Industry Revenue Share (%), by Treatment Type 2025 & 2033
- Figure 36: South America Exoskeleton Industry Revenue (undefined), by Body Part Type 2025 & 2033
- Figure 37: South America Exoskeleton Industry Revenue Share (%), by Body Part Type 2025 & 2033
- Figure 38: South America Exoskeleton Industry Revenue (undefined), by Product Type 2025 & 2033
- Figure 39: South America Exoskeleton Industry Revenue Share (%), by Product Type 2025 & 2033
- Figure 40: South America Exoskeleton Industry Revenue (undefined), by Country 2025 & 2033
- Figure 41: South America Exoskeleton Industry Revenue Share (%), by Country 2025 & 2033
List of Tables
- Table 1: Global Exoskeleton Industry Revenue undefined Forecast, by Treatment Type 2020 & 2033
- Table 2: Global Exoskeleton Industry Revenue undefined Forecast, by Body Part Type 2020 & 2033
- Table 3: Global Exoskeleton Industry Revenue undefined Forecast, by Product Type 2020 & 2033
- Table 4: Global Exoskeleton Industry Revenue undefined Forecast, by Region 2020 & 2033
- Table 5: Global Exoskeleton Industry Revenue undefined Forecast, by Treatment Type 2020 & 2033
- Table 6: Global Exoskeleton Industry Revenue undefined Forecast, by Body Part Type 2020 & 2033
- Table 7: Global Exoskeleton Industry Revenue undefined Forecast, by Product Type 2020 & 2033
- Table 8: Global Exoskeleton Industry Revenue undefined Forecast, by Country 2020 & 2033
- Table 9: United States Exoskeleton Industry Revenue (undefined) Forecast, by Application 2020 & 2033
- Table 10: Canada Exoskeleton Industry Revenue (undefined) Forecast, by Application 2020 & 2033
- Table 11: Mexico Exoskeleton Industry Revenue (undefined) Forecast, by Application 2020 & 2033
- Table 12: Global Exoskeleton Industry Revenue undefined Forecast, by Treatment Type 2020 & 2033
- Table 13: Global Exoskeleton Industry Revenue undefined Forecast, by Body Part Type 2020 & 2033
- Table 14: Global Exoskeleton Industry Revenue undefined Forecast, by Product Type 2020 & 2033
- Table 15: Global Exoskeleton Industry Revenue undefined Forecast, by Country 2020 & 2033
- Table 16: Germany Exoskeleton Industry Revenue (undefined) Forecast, by Application 2020 & 2033
- Table 17: United Kingdom Exoskeleton Industry Revenue (undefined) Forecast, by Application 2020 & 2033
- Table 18: France Exoskeleton Industry Revenue (undefined) Forecast, by Application 2020 & 2033
- Table 19: Italy Exoskeleton Industry Revenue (undefined) Forecast, by Application 2020 & 2033
- Table 20: Spain Exoskeleton Industry Revenue (undefined) Forecast, by Application 2020 & 2033
- Table 21: Rest of Europe Exoskeleton Industry Revenue (undefined) Forecast, by Application 2020 & 2033
- Table 22: Global Exoskeleton Industry Revenue undefined Forecast, by Treatment Type 2020 & 2033
- Table 23: Global Exoskeleton Industry Revenue undefined Forecast, by Body Part Type 2020 & 2033
- Table 24: Global Exoskeleton Industry Revenue undefined Forecast, by Product Type 2020 & 2033
- Table 25: Global Exoskeleton Industry Revenue undefined Forecast, by Country 2020 & 2033
- Table 26: China Exoskeleton Industry Revenue (undefined) Forecast, by Application 2020 & 2033
- Table 27: Japan Exoskeleton Industry Revenue (undefined) Forecast, by Application 2020 & 2033
- Table 28: India Exoskeleton Industry Revenue (undefined) Forecast, by Application 2020 & 2033
- Table 29: Australia Exoskeleton Industry Revenue (undefined) Forecast, by Application 2020 & 2033
- Table 30: South Korea Exoskeleton Industry Revenue (undefined) Forecast, by Application 2020 & 2033
- Table 31: Rest of Asia Pacific Exoskeleton Industry Revenue (undefined) Forecast, by Application 2020 & 2033
- Table 32: Global Exoskeleton Industry Revenue undefined Forecast, by Treatment Type 2020 & 2033
- Table 33: Global Exoskeleton Industry Revenue undefined Forecast, by Body Part Type 2020 & 2033
- Table 34: Global Exoskeleton Industry Revenue undefined Forecast, by Product Type 2020 & 2033
- Table 35: Global Exoskeleton Industry Revenue undefined Forecast, by Country 2020 & 2033
- Table 36: GCC Exoskeleton Industry Revenue (undefined) Forecast, by Application 2020 & 2033
- Table 37: South Africa Exoskeleton Industry Revenue (undefined) Forecast, by Application 2020 & 2033
- Table 38: Rest of Middle East and Africa Exoskeleton Industry Revenue (undefined) Forecast, by Application 2020 & 2033
- Table 39: Global Exoskeleton Industry Revenue undefined Forecast, by Treatment Type 2020 & 2033
- Table 40: Global Exoskeleton Industry Revenue undefined Forecast, by Body Part Type 2020 & 2033
- Table 41: Global Exoskeleton Industry Revenue undefined Forecast, by Product Type 2020 & 2033
- Table 42: Global Exoskeleton Industry Revenue undefined Forecast, by Country 2020 & 2033
- Table 43: Brazil Exoskeleton Industry Revenue (undefined) Forecast, by Application 2020 & 2033
- Table 44: Argentina Exoskeleton Industry Revenue (undefined) Forecast, by Application 2020 & 2033
- Table 45: Rest of South America Exoskeleton Industry Revenue (undefined) Forecast, by Application 2020 & 2033
Frequently Asked Questions
1. What is the projected Compound Annual Growth Rate (CAGR) of the Exoskeleton Industry?
The projected CAGR is approximately 43.1%.
2. Which companies are prominent players in the Exoskeleton Industry?
Key companies in the market include Parker-Hannifin Corp, B-Temia Inc, Rewalk Robotics, Rehab-Robotics Company Limited, Gogoa Mobility Robots, Bioservo Technologies AB, Bionik Laboratories Corp, Cyberdyne Inc, Ekso Bionics Holdings, Bioness Inc.
3. What are the main segments of the Exoskeleton Industry?
The market segments include Treatment Type, Body Part Type, Product Type.
4. Can you provide details about the market size?
The market size is estimated to be USD XXX N/A as of 2022.
5. What are some drivers contributing to market growth?
Growing Demand from Healthcare Sector for Robotic Rehabilitation; Advancement in Robotic Technologies; Huge Investment for the Development of the Exoskeleton Technology.
6. What are the notable trends driving market growth?
The Mobile Segment is Expected to Hold the Largest Share by Product Type Over the Forecast Period.
7. Are there any restraints impacting market growth?
Risks Involved with Using Exoskeletons Due to Vague Safety Guidelines.
8. Can you provide examples of recent developments in the market?
N/A
9. What pricing options are available for accessing the report?
Pricing options include single-user, multi-user, and enterprise licenses priced at USD 4750, USD 5250, and USD 8750 respectively.
10. Is the market size provided in terms of value or volume?
The market size is provided in terms of value, measured in N/A.
11. Are there any specific market keywords associated with the report?
Yes, the market keyword associated with the report is "Exoskeleton Industry," which aids in identifying and referencing the specific market segment covered.
12. How do I determine which pricing option suits my needs best?
The pricing options vary based on user requirements and access needs. Individual users may opt for single-user licenses, while businesses requiring broader access may choose multi-user or enterprise licenses for cost-effective access to the report.
13. Are there any additional resources or data provided in the Exoskeleton Industry report?
While the report offers comprehensive insights, it's advisable to review the specific contents or supplementary materials provided to ascertain if additional resources or data are available.
14. How can I stay updated on further developments or reports in the Exoskeleton Industry?
To stay informed about further developments, trends, and reports in the Exoskeleton Industry, consider subscribing to industry newsletters, following relevant companies and organizations, or regularly checking reputable industry news sources and publications.
Methodology
Step 1 - Identification of Relevant Samples Size from Population Database


Step 2 - Approaches for Defining Global Market Size (Value, Volume* & Price*)

Note*: In applicable scenarios
Step 3 - Data Sources
Primary Research
- Web Analytics
- Survey Reports
- Research Institute
- Latest Research Reports
- Opinion Leaders
Secondary Research
- Annual Reports
- White Paper
- Latest Press Release
- Industry Association
- Paid Database
- Investor Presentations

Step 4 - Data Triangulation
Involves using different sources of information in order to increase the validity of a study
These sources are likely to be stakeholders in a program - participants, other researchers, program staff, other community members, and so on.
Then we put all data in single framework & apply various statistical tools to find out the dynamic on the market.
During the analysis stage, feedback from the stakeholder groups would be compared to determine areas of agreement as well as areas of divergence