

Key Insights
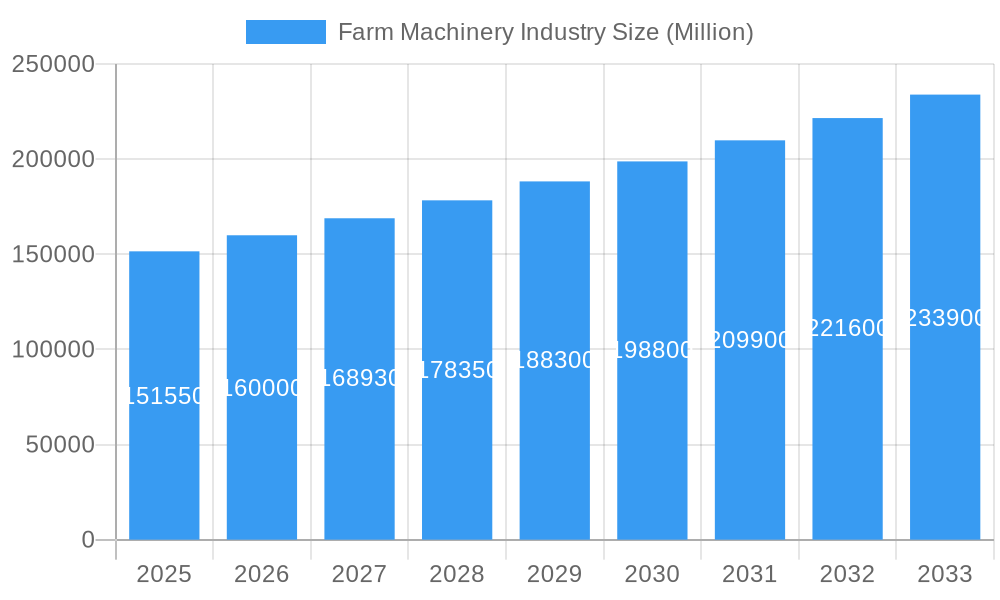
The global farm machinery market, valued at $151.55 billion in 2025, is projected to experience robust growth, exhibiting a Compound Annual Growth Rate (CAGR) of 5.40% from 2025 to 2033. This expansion is driven by several key factors. Firstly, the increasing global population necessitates heightened agricultural output, fueling demand for efficient and technologically advanced farm machinery. Secondly, the growing adoption of precision farming techniques, including GPS-guided equipment and data analytics, enhances productivity and reduces operational costs, further stimulating market growth. Thirdly, favorable government policies and subsidies in several regions are encouraging farmers to invest in modernizing their equipment. However, factors like fluctuating commodity prices, high initial investment costs for advanced machinery, and the potential impact of climate change on agricultural yields present challenges to market expansion. Segmentation reveals significant opportunities within specific tractor horsepower ranges (40-99 HP and >100 HP) and machinery types crucial for plowing and cultivating. The market is highly competitive, with established players like Deere & Company, Mahindra & Mahindra, and Kubota Corporation alongside other significant manufacturers. Regional analysis shows North America and Europe as established markets, while Asia-Pacific presents substantial growth potential driven by increasing agricultural activities and modernization initiatives in developing economies.
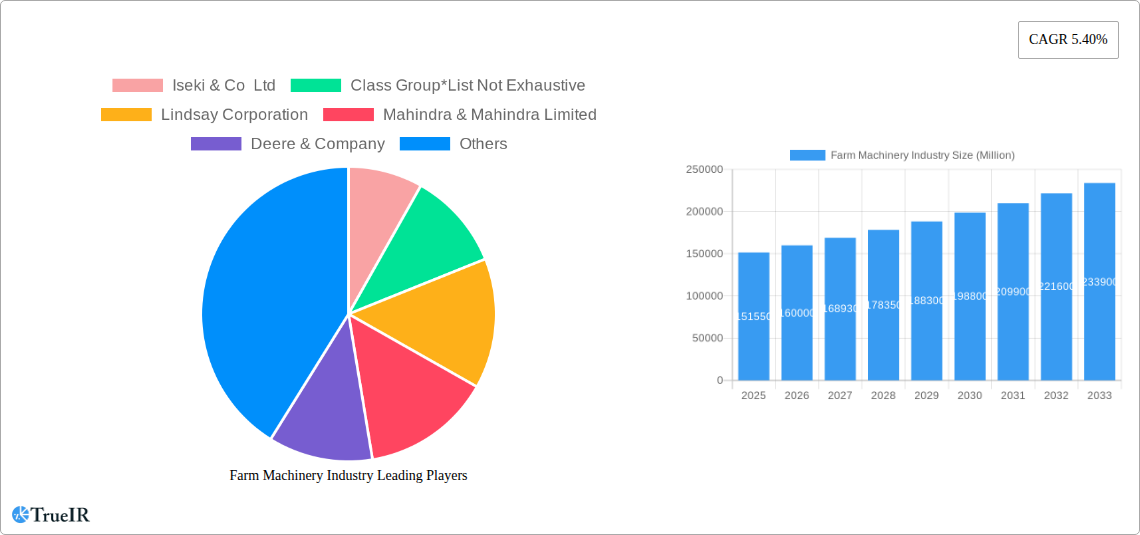
Farm Machinery Industry Market Size (In Billion)
The market's growth trajectory is expected to be influenced by technological advancements, such as autonomous tractors and AI-powered agricultural management systems. These innovations promise greater efficiency, reduced labor costs, and optimized resource utilization. The market will also witness increasing integration of smart farming technologies, including IoT sensors and data analytics platforms, enhancing decision-making and overall farm management. Furthermore, the sustainability focus in agriculture will drive demand for fuel-efficient and environmentally friendly machinery. Competition will likely intensify as manufacturers strive to offer advanced features and superior after-sales services to gain market share. The market's future growth relies on continued technological innovation, favorable government support, and stable commodity prices, making it an attractive sector for investment and expansion.
Farm Machinery Industry Company Market Share
Farm Machinery Industry Market Report: 2019-2033
This comprehensive report provides an in-depth analysis of the global farm machinery industry, covering market size, trends, competitive landscape, and future outlook from 2019 to 2033. The study period (2019-2024) provides a historical context, while the forecast period (2025-2033), with a base year of 2025 and estimated year of 2025, offers valuable projections for industry stakeholders. This report is crucial for businesses, investors, and policymakers seeking to understand and capitalize on opportunities within this dynamic sector. The market is valued at $xx Million in 2025 and is projected to reach $xx Million by 2033, exhibiting a robust CAGR.
Farm Machinery Industry Market Structure & Competitive Landscape
The global farm machinery market exhibits a moderately concentrated structure, dominated by a few key enterprises that command a substantial market share. While the precise Herfindahl-Hirschman Index (HHI) is estimated at xx, signifying a moderate level of concentration, the market remains competitive due to the active participation of numerous smaller companies specializing in niche segments. Innovation is a pivotal force, propelled by the increasing adoption of precision agriculture technologies, automation, and advanced data analytics aimed at enhancing farm efficiency and maximizing crop yields. Furthermore, evolving environmental regulations, which advocate for sustainable farming practices, significantly shape product development strategies and influence overall market dynamics. The threat posed by product substitutes, such as manual labor or alternative cultivation methods, is increasingly limited in the face of the growing scale and sophistication of modern agricultural operations.
Segmentation by end-users is primarily dictated by farm size and the specific operational focus. Large-scale commercial farms represent the primary demand for high-horsepower tractors and sophisticated machinery. In contrast, smaller agricultural operations tend to favor compact utility tractors and simpler equipment. The past few years have witnessed considerable Mergers and Acquisitions (M&A) activity, with approximately xx M&A deals recorded in the historical period. This consolidation has been instrumental in augmenting market share, fostering innovation, and driving increased investment in research and development (R&D), leading to a broader portfolio of advanced farm machinery products. The trend towards strategic alliances between farm machinery manufacturers and technology firms is also on the rise, with the objective of integrating cutting-edge technologies into farm equipment and facilitating data-driven decision-making processes.
Farm Machinery Industry Market Trends & Opportunities
The global farm machinery market is experiencing substantial growth driven by several factors. Rising global population and increasing demand for food are key drivers, pushing the need for efficient and productive farming practices. Technological advancements, such as autonomous tractors, precision spraying systems, and data-driven analytics, significantly improve yields and resource utilization. These technologies not only increase efficiency but also improve sustainability by reducing waste and environmental impact. Changing consumer preferences for higher-quality and more sustainably produced food are also fueling innovation and market growth.
The market penetration rate for advanced farming technologies like precision agriculture is still relatively low, presenting significant growth opportunities. Market size is expected to grow significantly in the forecast period due to increasing investment in agricultural infrastructure, government support for technological adoption, and rising disposable incomes in developing countries. The compound annual growth rate (CAGR) for the forecast period is projected to be xx%, showcasing substantial market expansion. Competitive dynamics are shaped by ongoing product innovation, cost competitiveness, and the ability to provide comprehensive solutions and services to farmers.
Dominant Markets & Segments in Farm Machinery Industry
North America currently leads the global farm machinery market in terms of market share. However, the Asia Pacific and Latin American regions are rapidly emerging as significant growth markets, fueled by substantial investments in agricultural infrastructure, supportive government policies, and a burgeoning demand for agricultural products. Countries such as India, Brazil, and China are demonstrating particularly strong growth trajectories.
- Leading Segments: High-horsepower tractors (exceeding 100 HP) and plowing and cultivating machinery are currently the dominant segments, driven by the robust demand from large-scale commercial farming operations.
- Growth Drivers:
- Expansion of arable land under cultivation.
- Technological advancements leading to significant improvements in operational efficiency.
- Favorable government initiatives promoting the modernization of agricultural practices.
- Increasing global consumer demand for higher-quality food products.
- Widespread adoption of precision farming techniques and smart agricultural solutions.
Farm Machinery Industry Product Analysis
Recent product innovations within the farm machinery industry are predominantly centered on enhancing automation, precision, and sustainability. The introduction of autonomous tractors, GPS-guided planting and spraying systems, and sophisticated data-driven analytics is significantly contributing to improved farming efficiency and higher crop yields. The seamless integration of sensors, artificial intelligence (AI), and the Internet of Things (IoT) technologies is revolutionizing farm operations by enabling optimized resource utilization, minimizing waste, and boosting overall profitability. The market exhibits a strong receptiveness to these advanced technologies, particularly among large-scale commercial farms that are keen on enhancing operational efficiency and maintaining a competitive edge.
Key Drivers, Barriers & Challenges in Farm Machinery Industry
Key Drivers:
- Technological advancements: Automation, precision agriculture, and data analytics are increasing efficiency and productivity.
- Growing global population: Increased food demand necessitates higher agricultural output.
- Government support and policies: Subsidies and initiatives promoting agricultural modernization drive adoption.
Challenges:
- High initial investment costs: Advanced technologies can be expensive to implement, posing a barrier for smaller farms.
- Supply chain disruptions: Global events can impact the availability of components and raw materials.
- Regulatory hurdles: Compliance with environmental and safety regulations can be complex. The impact of supply chain issues on production costs has been estimated at approximately xx% in the past year.
Growth Drivers in the Farm Machinery Industry Market
The key drivers for growth in the farm machinery market include technological advancements, increasing global food demand, government support for agricultural modernization, and rising disposable incomes in developing economies. The integration of artificial intelligence and Internet of Things (IoT) technologies is transforming agricultural practices, leading to higher yields and improved resource management. Furthermore, the growing awareness of sustainable agriculture practices is driving the development of environmentally friendly farm machinery.
Challenges Impacting Farm Machinery Growth
Key challenges impacting the industry include high initial investment costs for advanced technologies, reliance on complex global supply chains which are prone to disruptions, and regulatory compliance. These factors can impact market penetration and growth potential. Fluctuations in commodity prices and intense competition further complicate the industry's growth trajectory.
Key Players Shaping the Farm Machinery Industry Market
- Iseki & Co Ltd
- Claas Group*
- Lindsay Corporation
- Mahindra & Mahindra Limited
- Deere & Company
- Daedong Industrial Co Ltd
- CNH Industrial NV
- Kubota Corporation
- JC Bamford Excavators Limited
- AGCO Corporation
*List Not Exhaustive
Significant Farm Machinery Industry Milestones
- February 2024: John Deere and GUSS Automation unveiled the Electric GUSS, the world's first fully electric autonomous herbicide orchard sprayer, significantly advancing precision agriculture and sustainability.
- February 2024: John Deere launched autonomy-ready tractors, C-Series air carts, and weed-sensing sprayers at the Commodity Classic, showcasing its commitment to innovation and automation.
- February 2024: Mahindra introduced two new sub-compact and compact tractor models, enhancing user experience and expanding its product portfolio.
Future Outlook for Farm Machinery Industry Market
The farm machinery industry is on a trajectory of sustained growth, propelled by continuous technological advancements, the escalating global demand for food, and supportive governmental policies. Strategic opportunities abound in the development and deployment of more sustainable and efficient farming technologies, particularly those that address critical challenges such as climate change and resource scarcity. The potential for market expansion is considerable, especially in emerging economies and within segments that are actively embracing advanced technological solutions.
Farm Machinery Industry Segmentation
- 1. Production Analysis
- 2. Consumption Analysis
- 3. Import Market Analysis (Value & Volume)
- 4. Export Market Analysis (Value & Volume)
- 5. Price Trend Analysis
Farm Machinery Industry Segmentation By Geography
-
1. North America
- 1.1. United States
- 1.2. Canada
- 1.3. Mexico
-
2. South America
- 2.1. Brazil
- 2.2. Argentina
- 2.3. Rest of South America
-
3. Europe
- 3.1. United Kingdom
- 3.2. Germany
- 3.3. France
- 3.4. Italy
- 3.5. Spain
- 3.6. Russia
- 3.7. Benelux
- 3.8. Nordics
- 3.9. Rest of Europe
-
4. Middle East & Africa
- 4.1. Turkey
- 4.2. Israel
- 4.3. GCC
- 4.4. North Africa
- 4.5. South Africa
- 4.6. Rest of Middle East & Africa
-
5. Asia Pacific
- 5.1. China
- 5.2. India
- 5.3. Japan
- 5.4. South Korea
- 5.5. ASEAN
- 5.6. Oceania
- 5.7. Rest of Asia Pacific
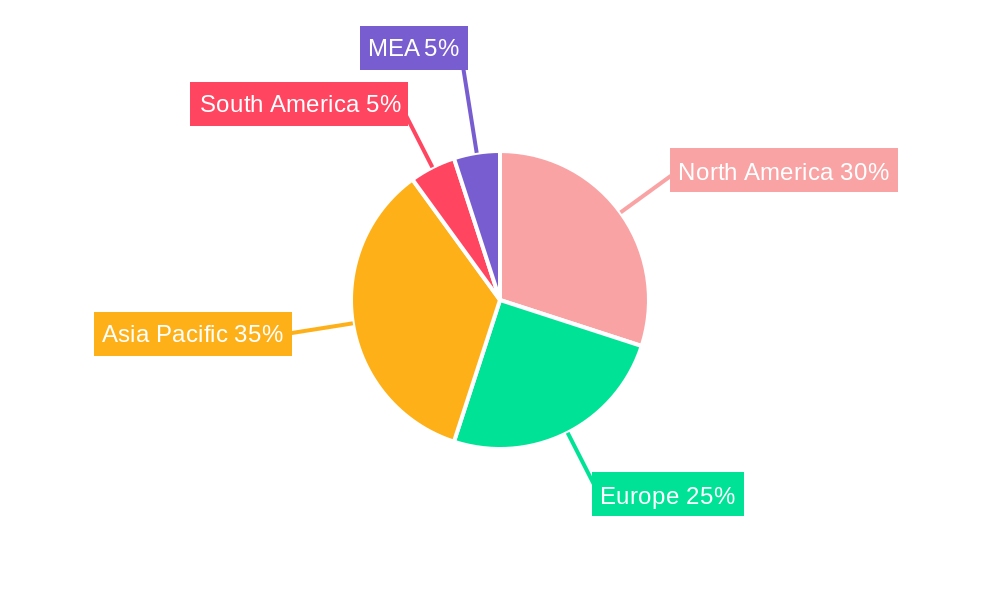
Farm Machinery Industry Regional Market Share
Geographic Coverage of Farm Machinery Industry
Farm Machinery Industry REPORT HIGHLIGHTS
| Aspects | Details |
|---|---|
| Study Period | 2020-2034 |
| Base Year | 2025 |
| Estimated Year | 2026 |
| Forecast Period | 2026-2034 |
| Historical Period | 2020-2025 |
| Growth Rate | CAGR of 5.40% from 2020-2034 |
| Segmentation |
|
Table of Contents
- 1. Introduction
- 1.1. Research Scope
- 1.2. Market Segmentation
- 1.3. Research Methodology
- 1.4. Definitions and Assumptions
- 2. Executive Summary
- 2.1. Introduction
- 3. Market Dynamics
- 3.1. Introduction
- 3.2. Market Drivers
- 3.2.1. Low Availability of Skilled Labor; Technological Advancements
- 3.3. Market Restrains
- 3.3.1. Increasing Farm Expenditure; Security Concerns in Modern Farming Machinery
- 3.4. Market Trends
- 3.4.1. Low Availability of Skilled Labor
- 4. Market Factor Analysis
- 4.1. Porters Five Forces
- 4.2. Supply/Value Chain
- 4.3. PESTEL analysis
- 4.4. Market Entropy
- 4.5. Patent/Trademark Analysis
- 5. Global Farm Machinery Industry Analysis, Insights and Forecast, 2020-2032
- 5.1. Market Analysis, Insights and Forecast - by Production Analysis
- 5.2. Market Analysis, Insights and Forecast - by Consumption Analysis
- 5.3. Market Analysis, Insights and Forecast - by Import Market Analysis (Value & Volume)
- 5.4. Market Analysis, Insights and Forecast - by Export Market Analysis (Value & Volume)
- 5.5. Market Analysis, Insights and Forecast - by Price Trend Analysis
- 5.6. Market Analysis, Insights and Forecast - by Region
- 5.6.1. North America
- 5.6.2. South America
- 5.6.3. Europe
- 5.6.4. Middle East & Africa
- 5.6.5. Asia Pacific
- 5.1. Market Analysis, Insights and Forecast - by Production Analysis
- 6. North America Farm Machinery Industry Analysis, Insights and Forecast, 2020-2032
- 6.1. Market Analysis, Insights and Forecast - by Production Analysis
- 6.2. Market Analysis, Insights and Forecast - by Consumption Analysis
- 6.3. Market Analysis, Insights and Forecast - by Import Market Analysis (Value & Volume)
- 6.4. Market Analysis, Insights and Forecast - by Export Market Analysis (Value & Volume)
- 6.5. Market Analysis, Insights and Forecast - by Price Trend Analysis
- 6.1. Market Analysis, Insights and Forecast - by Production Analysis
- 7. South America Farm Machinery Industry Analysis, Insights and Forecast, 2020-2032
- 7.1. Market Analysis, Insights and Forecast - by Production Analysis
- 7.2. Market Analysis, Insights and Forecast - by Consumption Analysis
- 7.3. Market Analysis, Insights and Forecast - by Import Market Analysis (Value & Volume)
- 7.4. Market Analysis, Insights and Forecast - by Export Market Analysis (Value & Volume)
- 7.5. Market Analysis, Insights and Forecast - by Price Trend Analysis
- 7.1. Market Analysis, Insights and Forecast - by Production Analysis
- 8. Europe Farm Machinery Industry Analysis, Insights and Forecast, 2020-2032
- 8.1. Market Analysis, Insights and Forecast - by Production Analysis
- 8.2. Market Analysis, Insights and Forecast - by Consumption Analysis
- 8.3. Market Analysis, Insights and Forecast - by Import Market Analysis (Value & Volume)
- 8.4. Market Analysis, Insights and Forecast - by Export Market Analysis (Value & Volume)
- 8.5. Market Analysis, Insights and Forecast - by Price Trend Analysis
- 8.1. Market Analysis, Insights and Forecast - by Production Analysis
- 9. Middle East & Africa Farm Machinery Industry Analysis, Insights and Forecast, 2020-2032
- 9.1. Market Analysis, Insights and Forecast - by Production Analysis
- 9.2. Market Analysis, Insights and Forecast - by Consumption Analysis
- 9.3. Market Analysis, Insights and Forecast - by Import Market Analysis (Value & Volume)
- 9.4. Market Analysis, Insights and Forecast - by Export Market Analysis (Value & Volume)
- 9.5. Market Analysis, Insights and Forecast - by Price Trend Analysis
- 9.1. Market Analysis, Insights and Forecast - by Production Analysis
- 10. Asia Pacific Farm Machinery Industry Analysis, Insights and Forecast, 2020-2032
- 10.1. Market Analysis, Insights and Forecast - by Production Analysis
- 10.2. Market Analysis, Insights and Forecast - by Consumption Analysis
- 10.3. Market Analysis, Insights and Forecast - by Import Market Analysis (Value & Volume)
- 10.4. Market Analysis, Insights and Forecast - by Export Market Analysis (Value & Volume)
- 10.5. Market Analysis, Insights and Forecast - by Price Trend Analysis
- 10.1. Market Analysis, Insights and Forecast - by Production Analysis
- 11. Competitive Analysis
- 11.1. Global Market Share Analysis 2025
- 11.2. Company Profiles
- 11.2.1 Iseki & Co Ltd
- 11.2.1.1. Overview
- 11.2.1.2. Products
- 11.2.1.3. SWOT Analysis
- 11.2.1.4. Recent Developments
- 11.2.1.5. Financials (Based on Availability)
- 11.2.2 Class Group*List Not Exhaustive
- 11.2.2.1. Overview
- 11.2.2.2. Products
- 11.2.2.3. SWOT Analysis
- 11.2.2.4. Recent Developments
- 11.2.2.5. Financials (Based on Availability)
- 11.2.3 Lindsay Corporation
- 11.2.3.1. Overview
- 11.2.3.2. Products
- 11.2.3.3. SWOT Analysis
- 11.2.3.4. Recent Developments
- 11.2.3.5. Financials (Based on Availability)
- 11.2.4 Mahindra & Mahindra Limited
- 11.2.4.1. Overview
- 11.2.4.2. Products
- 11.2.4.3. SWOT Analysis
- 11.2.4.4. Recent Developments
- 11.2.4.5. Financials (Based on Availability)
- 11.2.5 Deere & Company
- 11.2.5.1. Overview
- 11.2.5.2. Products
- 11.2.5.3. SWOT Analysis
- 11.2.5.4. Recent Developments
- 11.2.5.5. Financials (Based on Availability)
- 11.2.6 Daedong Industrial Co Ltd
- 11.2.6.1. Overview
- 11.2.6.2. Products
- 11.2.6.3. SWOT Analysis
- 11.2.6.4. Recent Developments
- 11.2.6.5. Financials (Based on Availability)
- 11.2.7 CNH Industrial NV
- 11.2.7.1. Overview
- 11.2.7.2. Products
- 11.2.7.3. SWOT Analysis
- 11.2.7.4. Recent Developments
- 11.2.7.5. Financials (Based on Availability)
- 11.2.8 Kubota Corporation
- 11.2.8.1. Overview
- 11.2.8.2. Products
- 11.2.8.3. SWOT Analysis
- 11.2.8.4. Recent Developments
- 11.2.8.5. Financials (Based on Availability)
- 11.2.9 JC Bamford Excavators Limited
- 11.2.9.1. Overview
- 11.2.9.2. Products
- 11.2.9.3. SWOT Analysis
- 11.2.9.4. Recent Developments
- 11.2.9.5. Financials (Based on Availability)
- 11.2.10 AGCO Corporation
- 11.2.10.1. Overview
- 11.2.10.2. Products
- 11.2.10.3. SWOT Analysis
- 11.2.10.4. Recent Developments
- 11.2.10.5. Financials (Based on Availability)
- 11.2.1 Iseki & Co Ltd
List of Figures
- Figure 1: Global Farm Machinery Industry Revenue Breakdown (Million, %) by Region 2025 & 2033
- Figure 2: North America Farm Machinery Industry Revenue (Million), by Production Analysis 2025 & 2033
- Figure 3: North America Farm Machinery Industry Revenue Share (%), by Production Analysis 2025 & 2033
- Figure 4: North America Farm Machinery Industry Revenue (Million), by Consumption Analysis 2025 & 2033
- Figure 5: North America Farm Machinery Industry Revenue Share (%), by Consumption Analysis 2025 & 2033
- Figure 6: North America Farm Machinery Industry Revenue (Million), by Import Market Analysis (Value & Volume) 2025 & 2033
- Figure 7: North America Farm Machinery Industry Revenue Share (%), by Import Market Analysis (Value & Volume) 2025 & 2033
- Figure 8: North America Farm Machinery Industry Revenue (Million), by Export Market Analysis (Value & Volume) 2025 & 2033
- Figure 9: North America Farm Machinery Industry Revenue Share (%), by Export Market Analysis (Value & Volume) 2025 & 2033
- Figure 10: North America Farm Machinery Industry Revenue (Million), by Price Trend Analysis 2025 & 2033
- Figure 11: North America Farm Machinery Industry Revenue Share (%), by Price Trend Analysis 2025 & 2033
- Figure 12: North America Farm Machinery Industry Revenue (Million), by Country 2025 & 2033
- Figure 13: North America Farm Machinery Industry Revenue Share (%), by Country 2025 & 2033
- Figure 14: South America Farm Machinery Industry Revenue (Million), by Production Analysis 2025 & 2033
- Figure 15: South America Farm Machinery Industry Revenue Share (%), by Production Analysis 2025 & 2033
- Figure 16: South America Farm Machinery Industry Revenue (Million), by Consumption Analysis 2025 & 2033
- Figure 17: South America Farm Machinery Industry Revenue Share (%), by Consumption Analysis 2025 & 2033
- Figure 18: South America Farm Machinery Industry Revenue (Million), by Import Market Analysis (Value & Volume) 2025 & 2033
- Figure 19: South America Farm Machinery Industry Revenue Share (%), by Import Market Analysis (Value & Volume) 2025 & 2033
- Figure 20: South America Farm Machinery Industry Revenue (Million), by Export Market Analysis (Value & Volume) 2025 & 2033
- Figure 21: South America Farm Machinery Industry Revenue Share (%), by Export Market Analysis (Value & Volume) 2025 & 2033
- Figure 22: South America Farm Machinery Industry Revenue (Million), by Price Trend Analysis 2025 & 2033
- Figure 23: South America Farm Machinery Industry Revenue Share (%), by Price Trend Analysis 2025 & 2033
- Figure 24: South America Farm Machinery Industry Revenue (Million), by Country 2025 & 2033
- Figure 25: South America Farm Machinery Industry Revenue Share (%), by Country 2025 & 2033
- Figure 26: Europe Farm Machinery Industry Revenue (Million), by Production Analysis 2025 & 2033
- Figure 27: Europe Farm Machinery Industry Revenue Share (%), by Production Analysis 2025 & 2033
- Figure 28: Europe Farm Machinery Industry Revenue (Million), by Consumption Analysis 2025 & 2033
- Figure 29: Europe Farm Machinery Industry Revenue Share (%), by Consumption Analysis 2025 & 2033
- Figure 30: Europe Farm Machinery Industry Revenue (Million), by Import Market Analysis (Value & Volume) 2025 & 2033
- Figure 31: Europe Farm Machinery Industry Revenue Share (%), by Import Market Analysis (Value & Volume) 2025 & 2033
- Figure 32: Europe Farm Machinery Industry Revenue (Million), by Export Market Analysis (Value & Volume) 2025 & 2033
- Figure 33: Europe Farm Machinery Industry Revenue Share (%), by Export Market Analysis (Value & Volume) 2025 & 2033
- Figure 34: Europe Farm Machinery Industry Revenue (Million), by Price Trend Analysis 2025 & 2033
- Figure 35: Europe Farm Machinery Industry Revenue Share (%), by Price Trend Analysis 2025 & 2033
- Figure 36: Europe Farm Machinery Industry Revenue (Million), by Country 2025 & 2033
- Figure 37: Europe Farm Machinery Industry Revenue Share (%), by Country 2025 & 2033
- Figure 38: Middle East & Africa Farm Machinery Industry Revenue (Million), by Production Analysis 2025 & 2033
- Figure 39: Middle East & Africa Farm Machinery Industry Revenue Share (%), by Production Analysis 2025 & 2033
- Figure 40: Middle East & Africa Farm Machinery Industry Revenue (Million), by Consumption Analysis 2025 & 2033
- Figure 41: Middle East & Africa Farm Machinery Industry Revenue Share (%), by Consumption Analysis 2025 & 2033
- Figure 42: Middle East & Africa Farm Machinery Industry Revenue (Million), by Import Market Analysis (Value & Volume) 2025 & 2033
- Figure 43: Middle East & Africa Farm Machinery Industry Revenue Share (%), by Import Market Analysis (Value & Volume) 2025 & 2033
- Figure 44: Middle East & Africa Farm Machinery Industry Revenue (Million), by Export Market Analysis (Value & Volume) 2025 & 2033
- Figure 45: Middle East & Africa Farm Machinery Industry Revenue Share (%), by Export Market Analysis (Value & Volume) 2025 & 2033
- Figure 46: Middle East & Africa Farm Machinery Industry Revenue (Million), by Price Trend Analysis 2025 & 2033
- Figure 47: Middle East & Africa Farm Machinery Industry Revenue Share (%), by Price Trend Analysis 2025 & 2033
- Figure 48: Middle East & Africa Farm Machinery Industry Revenue (Million), by Country 2025 & 2033
- Figure 49: Middle East & Africa Farm Machinery Industry Revenue Share (%), by Country 2025 & 2033
- Figure 50: Asia Pacific Farm Machinery Industry Revenue (Million), by Production Analysis 2025 & 2033
- Figure 51: Asia Pacific Farm Machinery Industry Revenue Share (%), by Production Analysis 2025 & 2033
- Figure 52: Asia Pacific Farm Machinery Industry Revenue (Million), by Consumption Analysis 2025 & 2033
- Figure 53: Asia Pacific Farm Machinery Industry Revenue Share (%), by Consumption Analysis 2025 & 2033
- Figure 54: Asia Pacific Farm Machinery Industry Revenue (Million), by Import Market Analysis (Value & Volume) 2025 & 2033
- Figure 55: Asia Pacific Farm Machinery Industry Revenue Share (%), by Import Market Analysis (Value & Volume) 2025 & 2033
- Figure 56: Asia Pacific Farm Machinery Industry Revenue (Million), by Export Market Analysis (Value & Volume) 2025 & 2033
- Figure 57: Asia Pacific Farm Machinery Industry Revenue Share (%), by Export Market Analysis (Value & Volume) 2025 & 2033
- Figure 58: Asia Pacific Farm Machinery Industry Revenue (Million), by Price Trend Analysis 2025 & 2033
- Figure 59: Asia Pacific Farm Machinery Industry Revenue Share (%), by Price Trend Analysis 2025 & 2033
- Figure 60: Asia Pacific Farm Machinery Industry Revenue (Million), by Country 2025 & 2033
- Figure 61: Asia Pacific Farm Machinery Industry Revenue Share (%), by Country 2025 & 2033
List of Tables
- Table 1: Global Farm Machinery Industry Revenue Million Forecast, by Production Analysis 2020 & 2033
- Table 2: Global Farm Machinery Industry Revenue Million Forecast, by Consumption Analysis 2020 & 2033
- Table 3: Global Farm Machinery Industry Revenue Million Forecast, by Import Market Analysis (Value & Volume) 2020 & 2033
- Table 4: Global Farm Machinery Industry Revenue Million Forecast, by Export Market Analysis (Value & Volume) 2020 & 2033
- Table 5: Global Farm Machinery Industry Revenue Million Forecast, by Price Trend Analysis 2020 & 2033
- Table 6: Global Farm Machinery Industry Revenue Million Forecast, by Region 2020 & 2033
- Table 7: Global Farm Machinery Industry Revenue Million Forecast, by Production Analysis 2020 & 2033
- Table 8: Global Farm Machinery Industry Revenue Million Forecast, by Consumption Analysis 2020 & 2033
- Table 9: Global Farm Machinery Industry Revenue Million Forecast, by Import Market Analysis (Value & Volume) 2020 & 2033
- Table 10: Global Farm Machinery Industry Revenue Million Forecast, by Export Market Analysis (Value & Volume) 2020 & 2033
- Table 11: Global Farm Machinery Industry Revenue Million Forecast, by Price Trend Analysis 2020 & 2033
- Table 12: Global Farm Machinery Industry Revenue Million Forecast, by Country 2020 & 2033
- Table 13: United States Farm Machinery Industry Revenue (Million) Forecast, by Application 2020 & 2033
- Table 14: Canada Farm Machinery Industry Revenue (Million) Forecast, by Application 2020 & 2033
- Table 15: Mexico Farm Machinery Industry Revenue (Million) Forecast, by Application 2020 & 2033
- Table 16: Global Farm Machinery Industry Revenue Million Forecast, by Production Analysis 2020 & 2033
- Table 17: Global Farm Machinery Industry Revenue Million Forecast, by Consumption Analysis 2020 & 2033
- Table 18: Global Farm Machinery Industry Revenue Million Forecast, by Import Market Analysis (Value & Volume) 2020 & 2033
- Table 19: Global Farm Machinery Industry Revenue Million Forecast, by Export Market Analysis (Value & Volume) 2020 & 2033
- Table 20: Global Farm Machinery Industry Revenue Million Forecast, by Price Trend Analysis 2020 & 2033
- Table 21: Global Farm Machinery Industry Revenue Million Forecast, by Country 2020 & 2033
- Table 22: Brazil Farm Machinery Industry Revenue (Million) Forecast, by Application 2020 & 2033
- Table 23: Argentina Farm Machinery Industry Revenue (Million) Forecast, by Application 2020 & 2033
- Table 24: Rest of South America Farm Machinery Industry Revenue (Million) Forecast, by Application 2020 & 2033
- Table 25: Global Farm Machinery Industry Revenue Million Forecast, by Production Analysis 2020 & 2033
- Table 26: Global Farm Machinery Industry Revenue Million Forecast, by Consumption Analysis 2020 & 2033
- Table 27: Global Farm Machinery Industry Revenue Million Forecast, by Import Market Analysis (Value & Volume) 2020 & 2033
- Table 28: Global Farm Machinery Industry Revenue Million Forecast, by Export Market Analysis (Value & Volume) 2020 & 2033
- Table 29: Global Farm Machinery Industry Revenue Million Forecast, by Price Trend Analysis 2020 & 2033
- Table 30: Global Farm Machinery Industry Revenue Million Forecast, by Country 2020 & 2033
- Table 31: United Kingdom Farm Machinery Industry Revenue (Million) Forecast, by Application 2020 & 2033
- Table 32: Germany Farm Machinery Industry Revenue (Million) Forecast, by Application 2020 & 2033
- Table 33: France Farm Machinery Industry Revenue (Million) Forecast, by Application 2020 & 2033
- Table 34: Italy Farm Machinery Industry Revenue (Million) Forecast, by Application 2020 & 2033
- Table 35: Spain Farm Machinery Industry Revenue (Million) Forecast, by Application 2020 & 2033
- Table 36: Russia Farm Machinery Industry Revenue (Million) Forecast, by Application 2020 & 2033
- Table 37: Benelux Farm Machinery Industry Revenue (Million) Forecast, by Application 2020 & 2033
- Table 38: Nordics Farm Machinery Industry Revenue (Million) Forecast, by Application 2020 & 2033
- Table 39: Rest of Europe Farm Machinery Industry Revenue (Million) Forecast, by Application 2020 & 2033
- Table 40: Global Farm Machinery Industry Revenue Million Forecast, by Production Analysis 2020 & 2033
- Table 41: Global Farm Machinery Industry Revenue Million Forecast, by Consumption Analysis 2020 & 2033
- Table 42: Global Farm Machinery Industry Revenue Million Forecast, by Import Market Analysis (Value & Volume) 2020 & 2033
- Table 43: Global Farm Machinery Industry Revenue Million Forecast, by Export Market Analysis (Value & Volume) 2020 & 2033
- Table 44: Global Farm Machinery Industry Revenue Million Forecast, by Price Trend Analysis 2020 & 2033
- Table 45: Global Farm Machinery Industry Revenue Million Forecast, by Country 2020 & 2033
- Table 46: Turkey Farm Machinery Industry Revenue (Million) Forecast, by Application 2020 & 2033
- Table 47: Israel Farm Machinery Industry Revenue (Million) Forecast, by Application 2020 & 2033
- Table 48: GCC Farm Machinery Industry Revenue (Million) Forecast, by Application 2020 & 2033
- Table 49: North Africa Farm Machinery Industry Revenue (Million) Forecast, by Application 2020 & 2033
- Table 50: South Africa Farm Machinery Industry Revenue (Million) Forecast, by Application 2020 & 2033
- Table 51: Rest of Middle East & Africa Farm Machinery Industry Revenue (Million) Forecast, by Application 2020 & 2033
- Table 52: Global Farm Machinery Industry Revenue Million Forecast, by Production Analysis 2020 & 2033
- Table 53: Global Farm Machinery Industry Revenue Million Forecast, by Consumption Analysis 2020 & 2033
- Table 54: Global Farm Machinery Industry Revenue Million Forecast, by Import Market Analysis (Value & Volume) 2020 & 2033
- Table 55: Global Farm Machinery Industry Revenue Million Forecast, by Export Market Analysis (Value & Volume) 2020 & 2033
- Table 56: Global Farm Machinery Industry Revenue Million Forecast, by Price Trend Analysis 2020 & 2033
- Table 57: Global Farm Machinery Industry Revenue Million Forecast, by Country 2020 & 2033
- Table 58: China Farm Machinery Industry Revenue (Million) Forecast, by Application 2020 & 2033
- Table 59: India Farm Machinery Industry Revenue (Million) Forecast, by Application 2020 & 2033
- Table 60: Japan Farm Machinery Industry Revenue (Million) Forecast, by Application 2020 & 2033
- Table 61: South Korea Farm Machinery Industry Revenue (Million) Forecast, by Application 2020 & 2033
- Table 62: ASEAN Farm Machinery Industry Revenue (Million) Forecast, by Application 2020 & 2033
- Table 63: Oceania Farm Machinery Industry Revenue (Million) Forecast, by Application 2020 & 2033
- Table 64: Rest of Asia Pacific Farm Machinery Industry Revenue (Million) Forecast, by Application 2020 & 2033
Frequently Asked Questions
1. What is the projected Compound Annual Growth Rate (CAGR) of the Farm Machinery Industry?
The projected CAGR is approximately 5.40%.
2. Which companies are prominent players in the Farm Machinery Industry?
Key companies in the market include Iseki & Co Ltd, Class Group*List Not Exhaustive, Lindsay Corporation, Mahindra & Mahindra Limited, Deere & Company, Daedong Industrial Co Ltd, CNH Industrial NV, Kubota Corporation, JC Bamford Excavators Limited, AGCO Corporation.
3. What are the main segments of the Farm Machinery Industry?
The market segments include Production Analysis, Consumption Analysis, Import Market Analysis (Value & Volume), Export Market Analysis (Value & Volume), Price Trend Analysis.
4. Can you provide details about the market size?
The market size is estimated to be USD 151.55 Million as of 2022.
5. What are some drivers contributing to market growth?
Low Availability of Skilled Labor; Technological Advancements.
6. What are the notable trends driving market growth?
Low Availability of Skilled Labor.
7. Are there any restraints impacting market growth?
Increasing Farm Expenditure; Security Concerns in Modern Farming Machinery.
8. Can you provide examples of recent developments in the market?
February 2024: John Deere and GUSS Automation unveiled the Electric GUSS, the world's first fully electric autonomous herbicide orchard sprayer. This innovative machine allows growers to control multiple sprayers remotely and features a sport spraying weed detection system that reduces herbicide use and increases sustainability. Electric gas is a significant development in precision agriculture.
9. What pricing options are available for accessing the report?
Pricing options include single-user, multi-user, and enterprise licenses priced at USD 4750, USD 5250, and USD 8750 respectively.
10. Is the market size provided in terms of value or volume?
The market size is provided in terms of value, measured in Million.
11. Are there any specific market keywords associated with the report?
Yes, the market keyword associated with the report is "Farm Machinery Industry," which aids in identifying and referencing the specific market segment covered.
12. How do I determine which pricing option suits my needs best?
The pricing options vary based on user requirements and access needs. Individual users may opt for single-user licenses, while businesses requiring broader access may choose multi-user or enterprise licenses for cost-effective access to the report.
13. Are there any additional resources or data provided in the Farm Machinery Industry report?
While the report offers comprehensive insights, it's advisable to review the specific contents or supplementary materials provided to ascertain if additional resources or data are available.
14. How can I stay updated on further developments or reports in the Farm Machinery Industry?
To stay informed about further developments, trends, and reports in the Farm Machinery Industry, consider subscribing to industry newsletters, following relevant companies and organizations, or regularly checking reputable industry news sources and publications.
Methodology
Step 1 - Identification of Relevant Samples Size from Population Database


Step 2 - Approaches for Defining Global Market Size (Value, Volume* & Price*)

Note*: In applicable scenarios
Step 3 - Data Sources
Primary Research
- Web Analytics
- Survey Reports
- Research Institute
- Latest Research Reports
- Opinion Leaders
Secondary Research
- Annual Reports
- White Paper
- Latest Press Release
- Industry Association
- Paid Database
- Investor Presentations

Step 4 - Data Triangulation
Involves using different sources of information in order to increase the validity of a study
These sources are likely to be stakeholders in a program - participants, other researchers, program staff, other community members, and so on.
Then we put all data in single framework & apply various statistical tools to find out the dynamic on the market.
During the analysis stage, feedback from the stakeholder groups would be compared to determine areas of agreement as well as areas of divergence