

Key Insights
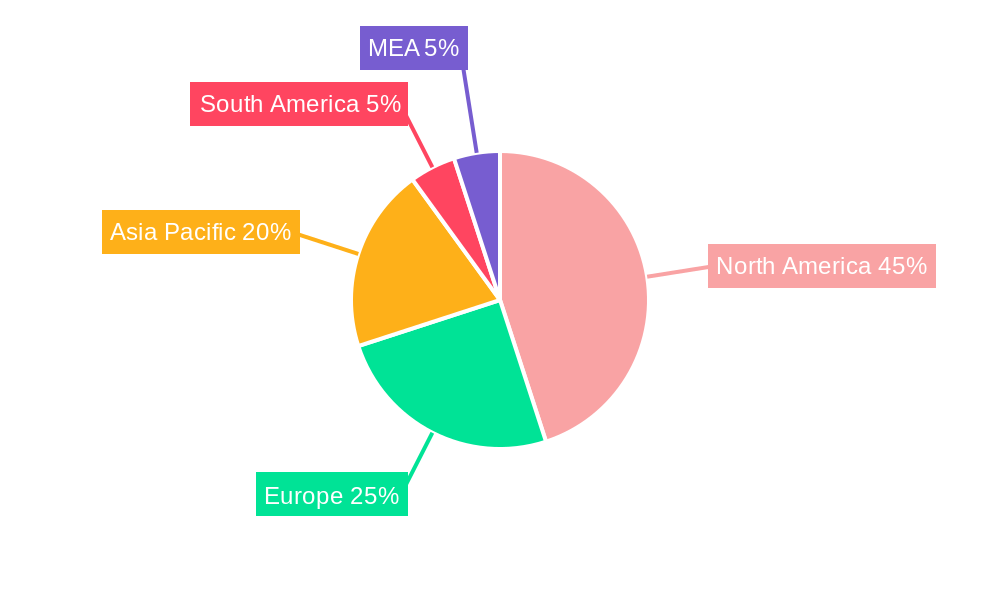
The global fresh cherries market, projected to reach $68 billion in 2025, is set to expand at a Compound Annual Growth Rate (CAGR) of 6.9% between 2025 and 2033. This growth is propelled by escalating consumer demand for nutritious and convenient snack options, coupled with rising disposable incomes that encourage spending on premium fruits. Innovations in packaging that extend shelf life and enhanced logistics are further supporting market expansion by improving accessibility and minimizing post-harvest losses. The market is segmented by cherry variety (Bing, Rainier, Royal Ann, Montmorency), application (direct consumption, processed goods such as jams and juices), and distribution channels (supermarkets, hypermarkets, e-commerce). North America, led by the United States and Canada, currently holds the largest market share due to established production and consumption patterns. However, the Asia-Pacific region presents substantial growth opportunities, driven by expanding middle-class populations and evolving dietary preferences.
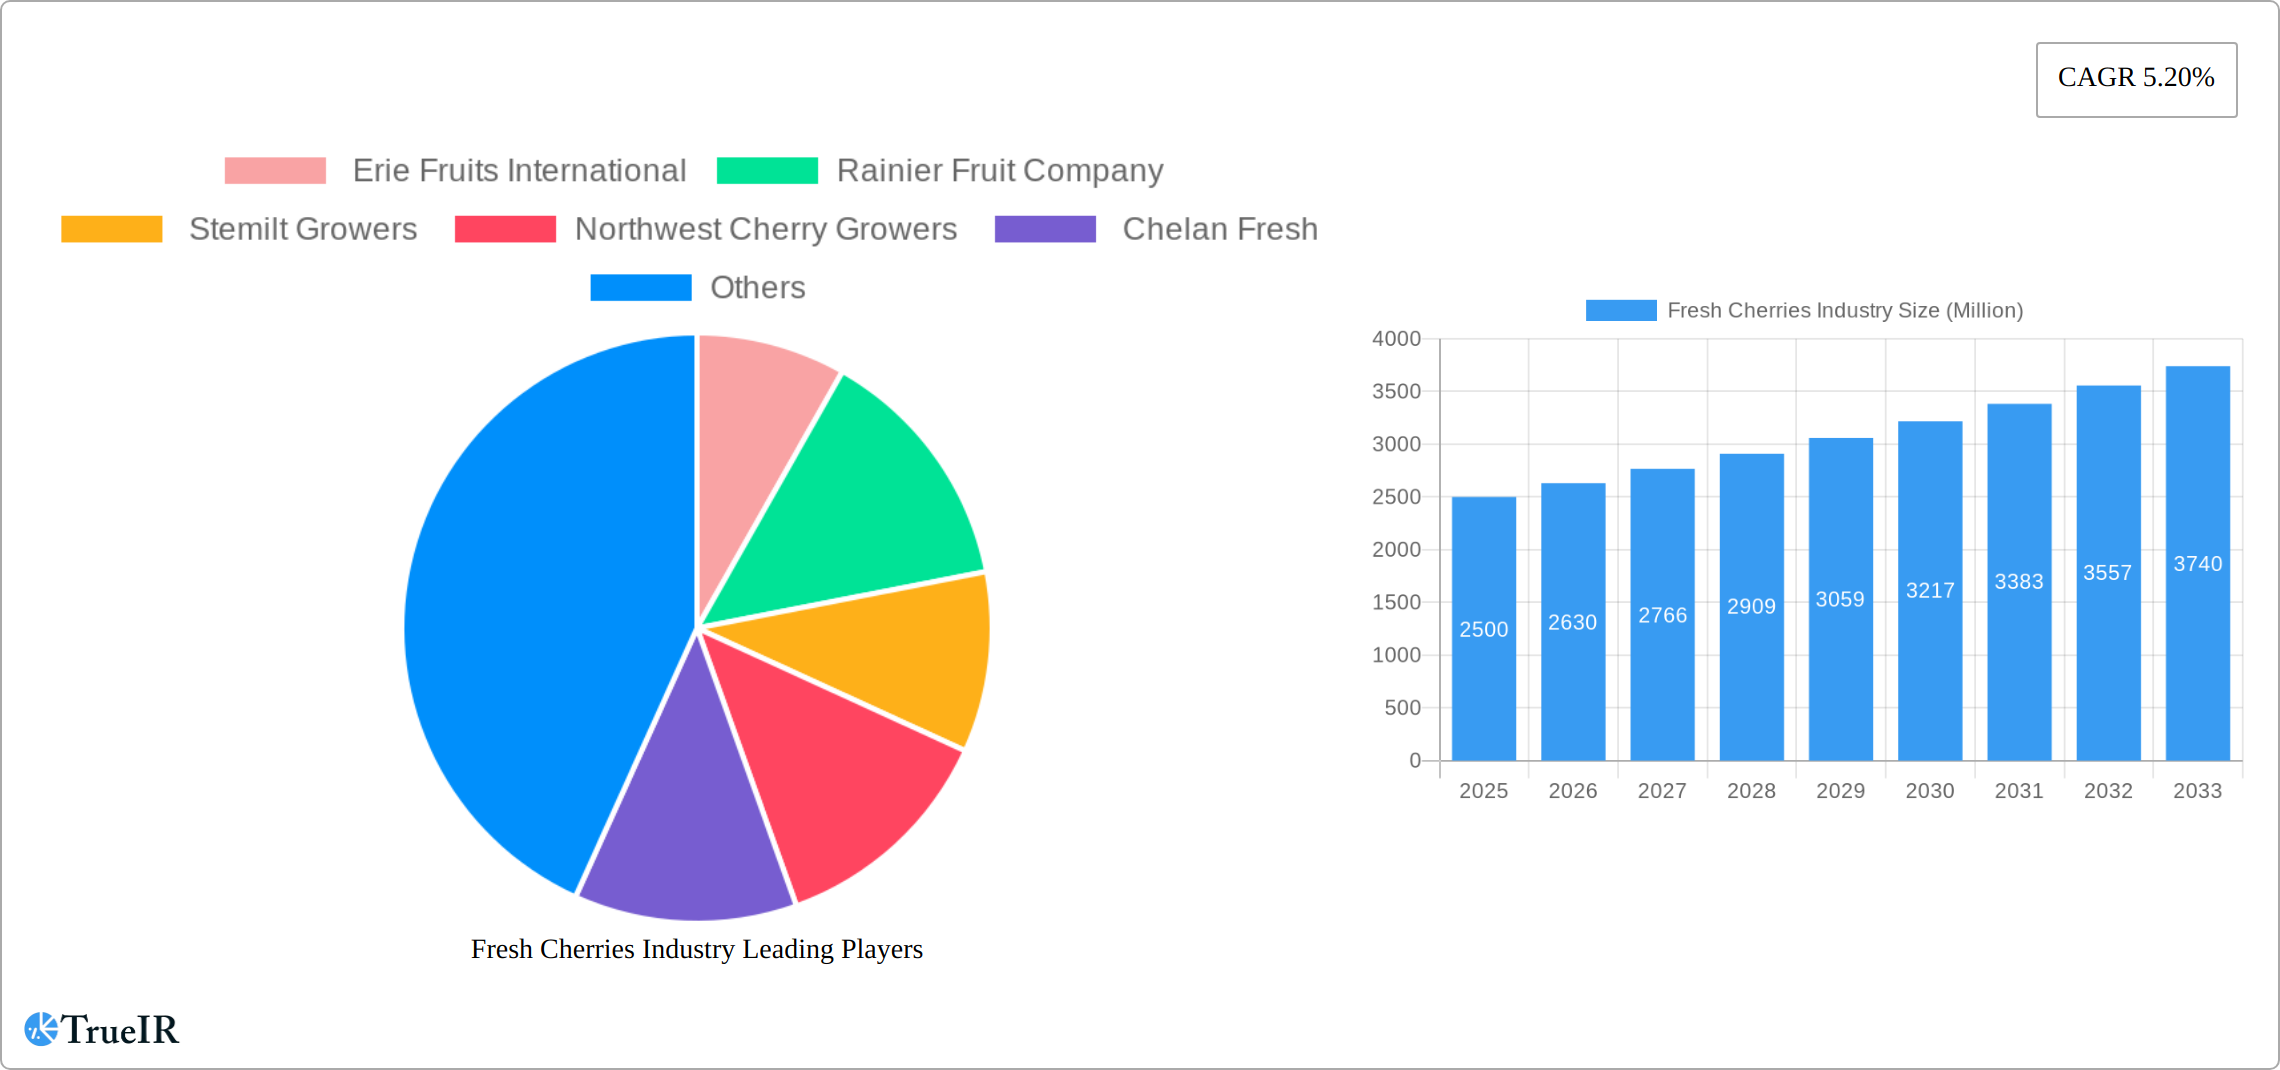
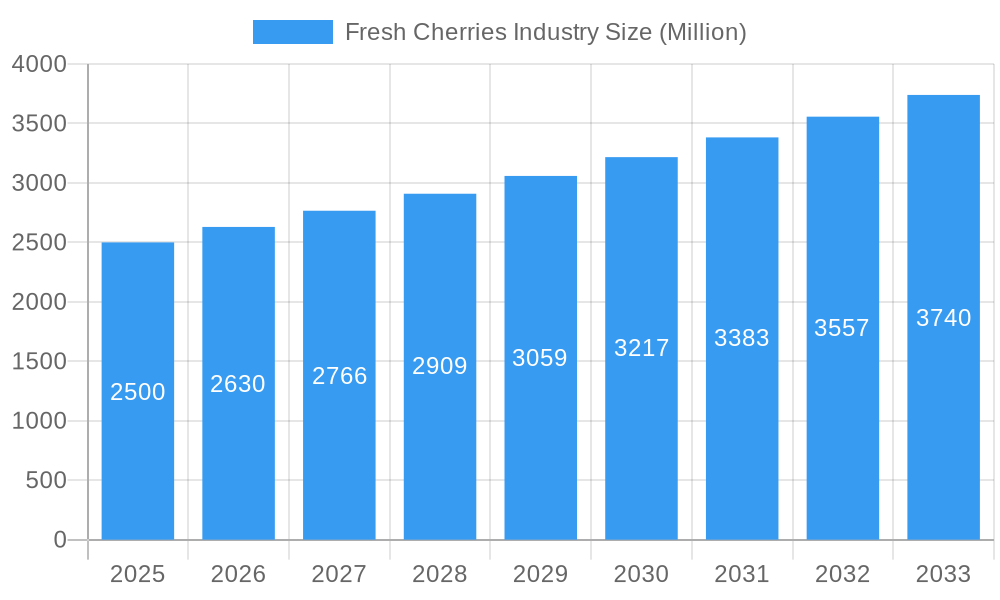
Fresh Cherries Industry Market Size (In Billion)
Key players in the fresh cherry sector, including Erie Fruits International, Rainier Fruit Company, Stemilt Growers, Northwest Cherry Growers, and Chelan Fresh, are implementing strategies focused on product portfolio expansion, supply chain optimization, and robust branding and marketing efforts to secure market share. The industry faces challenges such as seasonal production limitations, vulnerability to weather events, and price volatility. Nevertheless, advancements in cultivation technologies, improved cold storage infrastructure, and the development of alternative distribution channels, notably e-commerce, are actively addressing these constraints. The increasing adoption of sustainable farming practices and a growing consumer preference for locally sourced produce are significant trends influencing the fresh cherry market's future. Strategic market expansion and the development of value-added products are crucial for success in this dynamic industry.
Fresh Cherries Industry Company Market Share
Fresh Cherries Industry Report: 2019-2033 Market Analysis & Forecast
This comprehensive report provides a detailed analysis of the global fresh cherries industry, covering the period 2019-2033. With a focus on market size, segmentation, competitive landscape, and future trends, this report is an invaluable resource for industry stakeholders, investors, and anyone seeking to understand this dynamic market. The report leverages extensive data analysis and incorporates key developments to provide actionable insights. The estimated market value in 2025 is projected to be xx Million, with a Compound Annual Growth Rate (CAGR) of xx% from 2025 to 2033.
Fresh Cherries Industry Market Structure & Competitive Landscape
The global fresh cherry market exhibits a moderately concentrated structure, with several key players commanding significant market share. While precise figures for the Herfindahl-Hirschman Index (HHI) are commercially sensitive, industry analysis suggests a moderately competitive landscape. Innovation is fueled by advancements in precision agriculture, sophisticated irrigation systems, improved packaging extending shelf life (reducing post-harvest losses), and the continuous development of new cherry varieties with enhanced flavor profiles and disease resistance. Regulatory factors, including stringent food safety regulations and evolving international trade policies, significantly influence market dynamics and profitability. Furthermore, the availability of substitute products, such as other fresh fruits (berries, stone fruits, and even processed fruit snacks), exerts a considerable impact on overall market demand.
Market segmentation is primarily driven by end-users: direct consumption by individuals and processing by food manufacturers. The segment catering to fresh consumption currently dominates. Mergers and acquisitions (M&A) activity has been relatively robust in recent years. Although precise figures for M&A volume (2019-2024) are confidential, industry reports suggest significant investment. Key M&A trends include strategic acquisitions designed to expand geographic reach, diversify product portfolios, and enhance supply chain resilience.
- Concentration Ratio (CR4): [Insert Updated CR4 Data Here – or remove if unavailable]
- Key Innovation Drivers: Precision agriculture, advanced packaging technologies (modified atmosphere packaging, etc.), development of new cherry cultivars with enhanced characteristics (e.g., sweetness, size, disease resistance).
- Regulatory Impacts: Food safety standards (e.g., pesticide residues, microbial contamination), phytosanitary regulations, import/export tariffs and trade agreements.
- Major Substitutes: Other fresh fruits (berries, stone fruits, apples, grapes), dried fruits, and processed fruit products.
- M&A Activity: Significant activity observed, primarily focused on geographic expansion, vertical integration (acquiring growers or processors), and diversification of product offerings.
Fresh Cherries Industry Market Trends & Opportunities
The global fresh cherries market is experiencing robust growth, driven by rising consumer demand for healthy and convenient snacks, increasing disposable incomes in developing economies, and growing awareness of the health benefits associated with cherry consumption. Technological advancements such as improved cold storage and transportation methods are enabling longer shelf life and wider distribution. Consumer preferences are shifting towards organic and sustainably produced cherries, creating opportunities for producers who meet these demands. The market penetration rate of organic cherries is currently at xx%, projected to increase to xx% by 2033. The market size is expected to reach xx Million by 2033.
Competitive dynamics are characterized by increasing competition among major players, resulting in price pressure and a need for differentiation through product quality, branding, and sustainable practices. The CAGR for the forecast period (2025-2033) is estimated to be xx%.
Dominant Markets & Segments in Fresh Cherries Industry
The North American region, particularly the United States, currently dominates the global fresh cherries market, accounting for xx% of total volume. Within the type segment, Bing cherries hold the largest market share due to their popularity and widespread availability, followed by Rainier and Royal Ann cherries. The fresh application segment leads, owing to direct consumer consumption, while processed cherries (e.g., frozen, canned, juice) occupy a smaller, albeit growing, market share. Supermarkets and hypermarkets are the primary distribution channels, though e-commerce is steadily gaining traction.
- Key Growth Drivers in North America: Established infrastructure, favorable climatic conditions, strong consumer demand.
- Bing Cherry Dominance: High consumer preference, widespread availability.
- Fresh Consumption Dominance: Direct consumer consumption drives market growth.
- E-commerce Growth: Increasing online grocery shopping is expanding distribution channels.
Fresh Cherries Industry Product Analysis
Product innovation within the fresh cherry industry is heavily focused on enhancing shelf life through improved post-harvest handling and packaging techniques. This includes advancements in cold chain management, modified atmosphere packaging (MAP), and the exploration of novel preservation methods to minimize spoilage and maintain optimal fruit quality. Further innovation centers on improving taste and texture, developing new cherry varieties that cater to diverse consumer preferences (e.g., sweetness, tartness, size), and enhancing the overall sensory experience. Achieving a competitive advantage hinges on several key factors: delivering superior fruit quality, ensuring consistent supply throughout the season, implementing effective branding and marketing strategies, and maintaining efficient and reliable distribution networks reaching key retail channels.
Key Drivers, Barriers & Challenges in Fresh Cherries Industry
Key Drivers:
- Growing consumer demand for healthy and convenient snack options.
- Expansion of the global middle class and rising disposable incomes in developing economies.
- Technological advancements in farming practices (e.g., precision agriculture, drone technology, data analytics) and post-harvest handling.
- Increasing consumer awareness of the health benefits associated with cherry consumption (antioxidants, vitamins).
- Evolving consumer preferences towards sustainably produced food.
Key Challenges and Restraints:
- Perishable nature of fresh cherries leading to significant post-harvest losses. [Insert Updated Loss Estimate Here – or remove if unavailable]
- High susceptibility to weather-related damage and climate change impacts causing supply chain disruptions and price volatility.
- Intense competition from substitute fruits and other snack options.
- Stringent food safety and quality regulations increasing compliance costs.
- Labor shortages in key cherry-producing regions.
Growth Drivers in the Fresh Cherries Industry Market
The growth trajectory of the fresh cherry industry is propelled by a confluence of factors. Increasing consumer preference for healthy and convenient snacks, the expansion of global distribution channels (including e-commerce platforms), continuous advancements in farming and processing technologies, and rising disposable incomes worldwide all contribute significantly to market expansion. Moreover, government initiatives aimed at promoting sustainable agricultural practices and supporting the industry's overall development are creating a favorable environment for growth.
Challenges Impacting Fresh Cherries Industry Growth
Major challenges include the perishable nature of cherries leading to significant post-harvest losses, vulnerability to extreme weather events impacting yields, fierce competition from other fruit varieties, and the need to comply with stringent food safety and trade regulations. These challenges require innovative solutions across the entire supply chain.
Key Players Shaping the Fresh Cherries Industry Market
- Erie Fruits International
- Rainier Fruit Company
- Stemilt Growers
- Northwest Cherry Growers
- Chelan Fresh
Significant Fresh Cherries Industry Milestones
- December 2020: ProChile launched a retail promotion campaign for Chilean cherries in the Indian market, targeting premium consumers.
- July 2021: Modern intensive cherry orchards emerged in Uzbekistan, boosting global exports.
- October 2021: US imports of Chilean cherries totaled approximately 6,800 metric tons, indicating efforts to diversify markets beyond China.
Future Outlook for Fresh Cherries Industry Market
The future of the fresh cherry industry presents considerable opportunities. Continued growth in consumer demand, coupled with ongoing advancements in agricultural technology (e.g., improved disease resistance, automation), and strategic expansion into new markets will shape the industry's trajectory. Key opportunities include the development of value-added cherry products (e.g., juices, concentrates, dried cherries), the exploration of innovative processing and preservation techniques, and the strategic utilization of e-commerce platforms to optimize distribution and reach a broader customer base. Strategic collaborations and partnerships across the value chain will be instrumental in navigating the challenges and realizing the full potential of this dynamic market.
Fresh Cherries Industry Segmentation
- 1. Production Analysis
- 2. Consumption Analysis
- 3. Import Market Analysis (Value & Volume)
- 4. Export Market Analysis (Value & Volume)
- 5. Price Trend Analysis
Fresh Cherries Industry Segmentation By Geography
-
1. North America
- 1.1. United States
-
2. Europe
- 2.1. Spain
-
3. Asia Pacific
- 3.1. China
-
4. South America
- 4.1. Chile
-
5. Middle East and Africa
- 5.1. Turkey
Fresh Cherries Industry Regional Market Share
Geographic Coverage of Fresh Cherries Industry
Fresh Cherries Industry REPORT HIGHLIGHTS
| Aspects | Details |
|---|---|
| Study Period | 2020-2034 |
| Base Year | 2025 |
| Estimated Year | 2026 |
| Forecast Period | 2026-2034 |
| Historical Period | 2020-2025 |
| Growth Rate | CAGR of 6.9% from 2020-2034 |
| Segmentation |
|
Table of Contents
- 1. Introduction
- 1.1. Research Scope
- 1.2. Market Segmentation
- 1.3. Research Methodology
- 1.4. Definitions and Assumptions
- 2. Executive Summary
- 2.1. Introduction
- 3. Market Dynamics
- 3.1. Introduction
- 3.2. Market Drivers
- 3.2.1. ; Awareness About Health Benefits Associated With Pecan Consumption; Wide Application of Pecan
- 3.3. Market Restrains
- 3.3.1. ; Volatility in the Prices; Adverse Weather Conditions Affecting Yield
- 3.4. Market Trends
- 3.4.1. Increasing Demand for Imported Sweet Cherries
- 4. Market Factor Analysis
- 4.1. Porters Five Forces
- 4.2. Supply/Value Chain
- 4.3. PESTEL analysis
- 4.4. Market Entropy
- 4.5. Patent/Trademark Analysis
- 5. Global Fresh Cherries Industry Analysis, Insights and Forecast, 2020-2032
- 5.1. Market Analysis, Insights and Forecast - by Production Analysis
- 5.2. Market Analysis, Insights and Forecast - by Consumption Analysis
- 5.3. Market Analysis, Insights and Forecast - by Import Market Analysis (Value & Volume)
- 5.4. Market Analysis, Insights and Forecast - by Export Market Analysis (Value & Volume)
- 5.5. Market Analysis, Insights and Forecast - by Price Trend Analysis
- 5.6. Market Analysis, Insights and Forecast - by Region
- 5.6.1. North America
- 5.6.2. Europe
- 5.6.3. Asia Pacific
- 5.6.4. South America
- 5.6.5. Middle East and Africa
- 5.1. Market Analysis, Insights and Forecast - by Production Analysis
- 6. North America Fresh Cherries Industry Analysis, Insights and Forecast, 2020-2032
- 6.1. Market Analysis, Insights and Forecast - by Production Analysis
- 6.2. Market Analysis, Insights and Forecast - by Consumption Analysis
- 6.3. Market Analysis, Insights and Forecast - by Import Market Analysis (Value & Volume)
- 6.4. Market Analysis, Insights and Forecast - by Export Market Analysis (Value & Volume)
- 6.5. Market Analysis, Insights and Forecast - by Price Trend Analysis
- 6.1. Market Analysis, Insights and Forecast - by Production Analysis
- 7. Europe Fresh Cherries Industry Analysis, Insights and Forecast, 2020-2032
- 7.1. Market Analysis, Insights and Forecast - by Production Analysis
- 7.2. Market Analysis, Insights and Forecast - by Consumption Analysis
- 7.3. Market Analysis, Insights and Forecast - by Import Market Analysis (Value & Volume)
- 7.4. Market Analysis, Insights and Forecast - by Export Market Analysis (Value & Volume)
- 7.5. Market Analysis, Insights and Forecast - by Price Trend Analysis
- 7.1. Market Analysis, Insights and Forecast - by Production Analysis
- 8. Asia Pacific Fresh Cherries Industry Analysis, Insights and Forecast, 2020-2032
- 8.1. Market Analysis, Insights and Forecast - by Production Analysis
- 8.2. Market Analysis, Insights and Forecast - by Consumption Analysis
- 8.3. Market Analysis, Insights and Forecast - by Import Market Analysis (Value & Volume)
- 8.4. Market Analysis, Insights and Forecast - by Export Market Analysis (Value & Volume)
- 8.5. Market Analysis, Insights and Forecast - by Price Trend Analysis
- 8.1. Market Analysis, Insights and Forecast - by Production Analysis
- 9. South America Fresh Cherries Industry Analysis, Insights and Forecast, 2020-2032
- 9.1. Market Analysis, Insights and Forecast - by Production Analysis
- 9.2. Market Analysis, Insights and Forecast - by Consumption Analysis
- 9.3. Market Analysis, Insights and Forecast - by Import Market Analysis (Value & Volume)
- 9.4. Market Analysis, Insights and Forecast - by Export Market Analysis (Value & Volume)
- 9.5. Market Analysis, Insights and Forecast - by Price Trend Analysis
- 9.1. Market Analysis, Insights and Forecast - by Production Analysis
- 10. Middle East and Africa Fresh Cherries Industry Analysis, Insights and Forecast, 2020-2032
- 10.1. Market Analysis, Insights and Forecast - by Production Analysis
- 10.2. Market Analysis, Insights and Forecast - by Consumption Analysis
- 10.3. Market Analysis, Insights and Forecast - by Import Market Analysis (Value & Volume)
- 10.4. Market Analysis, Insights and Forecast - by Export Market Analysis (Value & Volume)
- 10.5. Market Analysis, Insights and Forecast - by Price Trend Analysis
- 10.1. Market Analysis, Insights and Forecast - by Production Analysis
- 11. Competitive Analysis
- 11.1. Global Market Share Analysis 2025
- 11.2. Company Profiles
- 11.2.1 Erie Fruits International
- 11.2.1.1. Overview
- 11.2.1.2. Products
- 11.2.1.3. SWOT Analysis
- 11.2.1.4. Recent Developments
- 11.2.1.5. Financials (Based on Availability)
- 11.2.2 Rainier Fruit Company
- 11.2.2.1. Overview
- 11.2.2.2. Products
- 11.2.2.3. SWOT Analysis
- 11.2.2.4. Recent Developments
- 11.2.2.5. Financials (Based on Availability)
- 11.2.3 Stemilt Growers
- 11.2.3.1. Overview
- 11.2.3.2. Products
- 11.2.3.3. SWOT Analysis
- 11.2.3.4. Recent Developments
- 11.2.3.5. Financials (Based on Availability)
- 11.2.4 Northwest Cherry Growers
- 11.2.4.1. Overview
- 11.2.4.2. Products
- 11.2.4.3. SWOT Analysis
- 11.2.4.4. Recent Developments
- 11.2.4.5. Financials (Based on Availability)
- 11.2.5 Chelan Fresh
- 11.2.5.1. Overview
- 11.2.5.2. Products
- 11.2.5.3. SWOT Analysis
- 11.2.5.4. Recent Developments
- 11.2.5.5. Financials (Based on Availability)
- 11.2.1 Erie Fruits International
List of Figures
- Figure 1: Global Fresh Cherries Industry Revenue Breakdown (billion, %) by Region 2025 & 2033
- Figure 2: Global Fresh Cherries Industry Volume Breakdown (Metric Tons, %) by Region 2025 & 2033
- Figure 3: North America Fresh Cherries Industry Revenue (billion), by Production Analysis 2025 & 2033
- Figure 4: North America Fresh Cherries Industry Volume (Metric Tons), by Production Analysis 2025 & 2033
- Figure 5: North America Fresh Cherries Industry Revenue Share (%), by Production Analysis 2025 & 2033
- Figure 6: North America Fresh Cherries Industry Volume Share (%), by Production Analysis 2025 & 2033
- Figure 7: North America Fresh Cherries Industry Revenue (billion), by Consumption Analysis 2025 & 2033
- Figure 8: North America Fresh Cherries Industry Volume (Metric Tons), by Consumption Analysis 2025 & 2033
- Figure 9: North America Fresh Cherries Industry Revenue Share (%), by Consumption Analysis 2025 & 2033
- Figure 10: North America Fresh Cherries Industry Volume Share (%), by Consumption Analysis 2025 & 2033
- Figure 11: North America Fresh Cherries Industry Revenue (billion), by Import Market Analysis (Value & Volume) 2025 & 2033
- Figure 12: North America Fresh Cherries Industry Volume (Metric Tons), by Import Market Analysis (Value & Volume) 2025 & 2033
- Figure 13: North America Fresh Cherries Industry Revenue Share (%), by Import Market Analysis (Value & Volume) 2025 & 2033
- Figure 14: North America Fresh Cherries Industry Volume Share (%), by Import Market Analysis (Value & Volume) 2025 & 2033
- Figure 15: North America Fresh Cherries Industry Revenue (billion), by Export Market Analysis (Value & Volume) 2025 & 2033
- Figure 16: North America Fresh Cherries Industry Volume (Metric Tons), by Export Market Analysis (Value & Volume) 2025 & 2033
- Figure 17: North America Fresh Cherries Industry Revenue Share (%), by Export Market Analysis (Value & Volume) 2025 & 2033
- Figure 18: North America Fresh Cherries Industry Volume Share (%), by Export Market Analysis (Value & Volume) 2025 & 2033
- Figure 19: North America Fresh Cherries Industry Revenue (billion), by Price Trend Analysis 2025 & 2033
- Figure 20: North America Fresh Cherries Industry Volume (Metric Tons), by Price Trend Analysis 2025 & 2033
- Figure 21: North America Fresh Cherries Industry Revenue Share (%), by Price Trend Analysis 2025 & 2033
- Figure 22: North America Fresh Cherries Industry Volume Share (%), by Price Trend Analysis 2025 & 2033
- Figure 23: North America Fresh Cherries Industry Revenue (billion), by Country 2025 & 2033
- Figure 24: North America Fresh Cherries Industry Volume (Metric Tons), by Country 2025 & 2033
- Figure 25: North America Fresh Cherries Industry Revenue Share (%), by Country 2025 & 2033
- Figure 26: North America Fresh Cherries Industry Volume Share (%), by Country 2025 & 2033
- Figure 27: Europe Fresh Cherries Industry Revenue (billion), by Production Analysis 2025 & 2033
- Figure 28: Europe Fresh Cherries Industry Volume (Metric Tons), by Production Analysis 2025 & 2033
- Figure 29: Europe Fresh Cherries Industry Revenue Share (%), by Production Analysis 2025 & 2033
- Figure 30: Europe Fresh Cherries Industry Volume Share (%), by Production Analysis 2025 & 2033
- Figure 31: Europe Fresh Cherries Industry Revenue (billion), by Consumption Analysis 2025 & 2033
- Figure 32: Europe Fresh Cherries Industry Volume (Metric Tons), by Consumption Analysis 2025 & 2033
- Figure 33: Europe Fresh Cherries Industry Revenue Share (%), by Consumption Analysis 2025 & 2033
- Figure 34: Europe Fresh Cherries Industry Volume Share (%), by Consumption Analysis 2025 & 2033
- Figure 35: Europe Fresh Cherries Industry Revenue (billion), by Import Market Analysis (Value & Volume) 2025 & 2033
- Figure 36: Europe Fresh Cherries Industry Volume (Metric Tons), by Import Market Analysis (Value & Volume) 2025 & 2033
- Figure 37: Europe Fresh Cherries Industry Revenue Share (%), by Import Market Analysis (Value & Volume) 2025 & 2033
- Figure 38: Europe Fresh Cherries Industry Volume Share (%), by Import Market Analysis (Value & Volume) 2025 & 2033
- Figure 39: Europe Fresh Cherries Industry Revenue (billion), by Export Market Analysis (Value & Volume) 2025 & 2033
- Figure 40: Europe Fresh Cherries Industry Volume (Metric Tons), by Export Market Analysis (Value & Volume) 2025 & 2033
- Figure 41: Europe Fresh Cherries Industry Revenue Share (%), by Export Market Analysis (Value & Volume) 2025 & 2033
- Figure 42: Europe Fresh Cherries Industry Volume Share (%), by Export Market Analysis (Value & Volume) 2025 & 2033
- Figure 43: Europe Fresh Cherries Industry Revenue (billion), by Price Trend Analysis 2025 & 2033
- Figure 44: Europe Fresh Cherries Industry Volume (Metric Tons), by Price Trend Analysis 2025 & 2033
- Figure 45: Europe Fresh Cherries Industry Revenue Share (%), by Price Trend Analysis 2025 & 2033
- Figure 46: Europe Fresh Cherries Industry Volume Share (%), by Price Trend Analysis 2025 & 2033
- Figure 47: Europe Fresh Cherries Industry Revenue (billion), by Country 2025 & 2033
- Figure 48: Europe Fresh Cherries Industry Volume (Metric Tons), by Country 2025 & 2033
- Figure 49: Europe Fresh Cherries Industry Revenue Share (%), by Country 2025 & 2033
- Figure 50: Europe Fresh Cherries Industry Volume Share (%), by Country 2025 & 2033
- Figure 51: Asia Pacific Fresh Cherries Industry Revenue (billion), by Production Analysis 2025 & 2033
- Figure 52: Asia Pacific Fresh Cherries Industry Volume (Metric Tons), by Production Analysis 2025 & 2033
- Figure 53: Asia Pacific Fresh Cherries Industry Revenue Share (%), by Production Analysis 2025 & 2033
- Figure 54: Asia Pacific Fresh Cherries Industry Volume Share (%), by Production Analysis 2025 & 2033
- Figure 55: Asia Pacific Fresh Cherries Industry Revenue (billion), by Consumption Analysis 2025 & 2033
- Figure 56: Asia Pacific Fresh Cherries Industry Volume (Metric Tons), by Consumption Analysis 2025 & 2033
- Figure 57: Asia Pacific Fresh Cherries Industry Revenue Share (%), by Consumption Analysis 2025 & 2033
- Figure 58: Asia Pacific Fresh Cherries Industry Volume Share (%), by Consumption Analysis 2025 & 2033
- Figure 59: Asia Pacific Fresh Cherries Industry Revenue (billion), by Import Market Analysis (Value & Volume) 2025 & 2033
- Figure 60: Asia Pacific Fresh Cherries Industry Volume (Metric Tons), by Import Market Analysis (Value & Volume) 2025 & 2033
- Figure 61: Asia Pacific Fresh Cherries Industry Revenue Share (%), by Import Market Analysis (Value & Volume) 2025 & 2033
- Figure 62: Asia Pacific Fresh Cherries Industry Volume Share (%), by Import Market Analysis (Value & Volume) 2025 & 2033
- Figure 63: Asia Pacific Fresh Cherries Industry Revenue (billion), by Export Market Analysis (Value & Volume) 2025 & 2033
- Figure 64: Asia Pacific Fresh Cherries Industry Volume (Metric Tons), by Export Market Analysis (Value & Volume) 2025 & 2033
- Figure 65: Asia Pacific Fresh Cherries Industry Revenue Share (%), by Export Market Analysis (Value & Volume) 2025 & 2033
- Figure 66: Asia Pacific Fresh Cherries Industry Volume Share (%), by Export Market Analysis (Value & Volume) 2025 & 2033
- Figure 67: Asia Pacific Fresh Cherries Industry Revenue (billion), by Price Trend Analysis 2025 & 2033
- Figure 68: Asia Pacific Fresh Cherries Industry Volume (Metric Tons), by Price Trend Analysis 2025 & 2033
- Figure 69: Asia Pacific Fresh Cherries Industry Revenue Share (%), by Price Trend Analysis 2025 & 2033
- Figure 70: Asia Pacific Fresh Cherries Industry Volume Share (%), by Price Trend Analysis 2025 & 2033
- Figure 71: Asia Pacific Fresh Cherries Industry Revenue (billion), by Country 2025 & 2033
- Figure 72: Asia Pacific Fresh Cherries Industry Volume (Metric Tons), by Country 2025 & 2033
- Figure 73: Asia Pacific Fresh Cherries Industry Revenue Share (%), by Country 2025 & 2033
- Figure 74: Asia Pacific Fresh Cherries Industry Volume Share (%), by Country 2025 & 2033
- Figure 75: South America Fresh Cherries Industry Revenue (billion), by Production Analysis 2025 & 2033
- Figure 76: South America Fresh Cherries Industry Volume (Metric Tons), by Production Analysis 2025 & 2033
- Figure 77: South America Fresh Cherries Industry Revenue Share (%), by Production Analysis 2025 & 2033
- Figure 78: South America Fresh Cherries Industry Volume Share (%), by Production Analysis 2025 & 2033
- Figure 79: South America Fresh Cherries Industry Revenue (billion), by Consumption Analysis 2025 & 2033
- Figure 80: South America Fresh Cherries Industry Volume (Metric Tons), by Consumption Analysis 2025 & 2033
- Figure 81: South America Fresh Cherries Industry Revenue Share (%), by Consumption Analysis 2025 & 2033
- Figure 82: South America Fresh Cherries Industry Volume Share (%), by Consumption Analysis 2025 & 2033
- Figure 83: South America Fresh Cherries Industry Revenue (billion), by Import Market Analysis (Value & Volume) 2025 & 2033
- Figure 84: South America Fresh Cherries Industry Volume (Metric Tons), by Import Market Analysis (Value & Volume) 2025 & 2033
- Figure 85: South America Fresh Cherries Industry Revenue Share (%), by Import Market Analysis (Value & Volume) 2025 & 2033
- Figure 86: South America Fresh Cherries Industry Volume Share (%), by Import Market Analysis (Value & Volume) 2025 & 2033
- Figure 87: South America Fresh Cherries Industry Revenue (billion), by Export Market Analysis (Value & Volume) 2025 & 2033
- Figure 88: South America Fresh Cherries Industry Volume (Metric Tons), by Export Market Analysis (Value & Volume) 2025 & 2033
- Figure 89: South America Fresh Cherries Industry Revenue Share (%), by Export Market Analysis (Value & Volume) 2025 & 2033
- Figure 90: South America Fresh Cherries Industry Volume Share (%), by Export Market Analysis (Value & Volume) 2025 & 2033
- Figure 91: South America Fresh Cherries Industry Revenue (billion), by Price Trend Analysis 2025 & 2033
- Figure 92: South America Fresh Cherries Industry Volume (Metric Tons), by Price Trend Analysis 2025 & 2033
- Figure 93: South America Fresh Cherries Industry Revenue Share (%), by Price Trend Analysis 2025 & 2033
- Figure 94: South America Fresh Cherries Industry Volume Share (%), by Price Trend Analysis 2025 & 2033
- Figure 95: South America Fresh Cherries Industry Revenue (billion), by Country 2025 & 2033
- Figure 96: South America Fresh Cherries Industry Volume (Metric Tons), by Country 2025 & 2033
- Figure 97: South America Fresh Cherries Industry Revenue Share (%), by Country 2025 & 2033
- Figure 98: South America Fresh Cherries Industry Volume Share (%), by Country 2025 & 2033
- Figure 99: Middle East and Africa Fresh Cherries Industry Revenue (billion), by Production Analysis 2025 & 2033
- Figure 100: Middle East and Africa Fresh Cherries Industry Volume (Metric Tons), by Production Analysis 2025 & 2033
- Figure 101: Middle East and Africa Fresh Cherries Industry Revenue Share (%), by Production Analysis 2025 & 2033
- Figure 102: Middle East and Africa Fresh Cherries Industry Volume Share (%), by Production Analysis 2025 & 2033
- Figure 103: Middle East and Africa Fresh Cherries Industry Revenue (billion), by Consumption Analysis 2025 & 2033
- Figure 104: Middle East and Africa Fresh Cherries Industry Volume (Metric Tons), by Consumption Analysis 2025 & 2033
- Figure 105: Middle East and Africa Fresh Cherries Industry Revenue Share (%), by Consumption Analysis 2025 & 2033
- Figure 106: Middle East and Africa Fresh Cherries Industry Volume Share (%), by Consumption Analysis 2025 & 2033
- Figure 107: Middle East and Africa Fresh Cherries Industry Revenue (billion), by Import Market Analysis (Value & Volume) 2025 & 2033
- Figure 108: Middle East and Africa Fresh Cherries Industry Volume (Metric Tons), by Import Market Analysis (Value & Volume) 2025 & 2033
- Figure 109: Middle East and Africa Fresh Cherries Industry Revenue Share (%), by Import Market Analysis (Value & Volume) 2025 & 2033
- Figure 110: Middle East and Africa Fresh Cherries Industry Volume Share (%), by Import Market Analysis (Value & Volume) 2025 & 2033
- Figure 111: Middle East and Africa Fresh Cherries Industry Revenue (billion), by Export Market Analysis (Value & Volume) 2025 & 2033
- Figure 112: Middle East and Africa Fresh Cherries Industry Volume (Metric Tons), by Export Market Analysis (Value & Volume) 2025 & 2033
- Figure 113: Middle East and Africa Fresh Cherries Industry Revenue Share (%), by Export Market Analysis (Value & Volume) 2025 & 2033
- Figure 114: Middle East and Africa Fresh Cherries Industry Volume Share (%), by Export Market Analysis (Value & Volume) 2025 & 2033
- Figure 115: Middle East and Africa Fresh Cherries Industry Revenue (billion), by Price Trend Analysis 2025 & 2033
- Figure 116: Middle East and Africa Fresh Cherries Industry Volume (Metric Tons), by Price Trend Analysis 2025 & 2033
- Figure 117: Middle East and Africa Fresh Cherries Industry Revenue Share (%), by Price Trend Analysis 2025 & 2033
- Figure 118: Middle East and Africa Fresh Cherries Industry Volume Share (%), by Price Trend Analysis 2025 & 2033
- Figure 119: Middle East and Africa Fresh Cherries Industry Revenue (billion), by Country 2025 & 2033
- Figure 120: Middle East and Africa Fresh Cherries Industry Volume (Metric Tons), by Country 2025 & 2033
- Figure 121: Middle East and Africa Fresh Cherries Industry Revenue Share (%), by Country 2025 & 2033
- Figure 122: Middle East and Africa Fresh Cherries Industry Volume Share (%), by Country 2025 & 2033
List of Tables
- Table 1: Global Fresh Cherries Industry Revenue billion Forecast, by Production Analysis 2020 & 2033
- Table 2: Global Fresh Cherries Industry Volume Metric Tons Forecast, by Production Analysis 2020 & 2033
- Table 3: Global Fresh Cherries Industry Revenue billion Forecast, by Consumption Analysis 2020 & 2033
- Table 4: Global Fresh Cherries Industry Volume Metric Tons Forecast, by Consumption Analysis 2020 & 2033
- Table 5: Global Fresh Cherries Industry Revenue billion Forecast, by Import Market Analysis (Value & Volume) 2020 & 2033
- Table 6: Global Fresh Cherries Industry Volume Metric Tons Forecast, by Import Market Analysis (Value & Volume) 2020 & 2033
- Table 7: Global Fresh Cherries Industry Revenue billion Forecast, by Export Market Analysis (Value & Volume) 2020 & 2033
- Table 8: Global Fresh Cherries Industry Volume Metric Tons Forecast, by Export Market Analysis (Value & Volume) 2020 & 2033
- Table 9: Global Fresh Cherries Industry Revenue billion Forecast, by Price Trend Analysis 2020 & 2033
- Table 10: Global Fresh Cherries Industry Volume Metric Tons Forecast, by Price Trend Analysis 2020 & 2033
- Table 11: Global Fresh Cherries Industry Revenue billion Forecast, by Region 2020 & 2033
- Table 12: Global Fresh Cherries Industry Volume Metric Tons Forecast, by Region 2020 & 2033
- Table 13: Global Fresh Cherries Industry Revenue billion Forecast, by Production Analysis 2020 & 2033
- Table 14: Global Fresh Cherries Industry Volume Metric Tons Forecast, by Production Analysis 2020 & 2033
- Table 15: Global Fresh Cherries Industry Revenue billion Forecast, by Consumption Analysis 2020 & 2033
- Table 16: Global Fresh Cherries Industry Volume Metric Tons Forecast, by Consumption Analysis 2020 & 2033
- Table 17: Global Fresh Cherries Industry Revenue billion Forecast, by Import Market Analysis (Value & Volume) 2020 & 2033
- Table 18: Global Fresh Cherries Industry Volume Metric Tons Forecast, by Import Market Analysis (Value & Volume) 2020 & 2033
- Table 19: Global Fresh Cherries Industry Revenue billion Forecast, by Export Market Analysis (Value & Volume) 2020 & 2033
- Table 20: Global Fresh Cherries Industry Volume Metric Tons Forecast, by Export Market Analysis (Value & Volume) 2020 & 2033
- Table 21: Global Fresh Cherries Industry Revenue billion Forecast, by Price Trend Analysis 2020 & 2033
- Table 22: Global Fresh Cherries Industry Volume Metric Tons Forecast, by Price Trend Analysis 2020 & 2033
- Table 23: Global Fresh Cherries Industry Revenue billion Forecast, by Country 2020 & 2033
- Table 24: Global Fresh Cherries Industry Volume Metric Tons Forecast, by Country 2020 & 2033
- Table 25: United States Fresh Cherries Industry Revenue (billion) Forecast, by Application 2020 & 2033
- Table 26: United States Fresh Cherries Industry Volume (Metric Tons) Forecast, by Application 2020 & 2033
- Table 27: Global Fresh Cherries Industry Revenue billion Forecast, by Production Analysis 2020 & 2033
- Table 28: Global Fresh Cherries Industry Volume Metric Tons Forecast, by Production Analysis 2020 & 2033
- Table 29: Global Fresh Cherries Industry Revenue billion Forecast, by Consumption Analysis 2020 & 2033
- Table 30: Global Fresh Cherries Industry Volume Metric Tons Forecast, by Consumption Analysis 2020 & 2033
- Table 31: Global Fresh Cherries Industry Revenue billion Forecast, by Import Market Analysis (Value & Volume) 2020 & 2033
- Table 32: Global Fresh Cherries Industry Volume Metric Tons Forecast, by Import Market Analysis (Value & Volume) 2020 & 2033
- Table 33: Global Fresh Cherries Industry Revenue billion Forecast, by Export Market Analysis (Value & Volume) 2020 & 2033
- Table 34: Global Fresh Cherries Industry Volume Metric Tons Forecast, by Export Market Analysis (Value & Volume) 2020 & 2033
- Table 35: Global Fresh Cherries Industry Revenue billion Forecast, by Price Trend Analysis 2020 & 2033
- Table 36: Global Fresh Cherries Industry Volume Metric Tons Forecast, by Price Trend Analysis 2020 & 2033
- Table 37: Global Fresh Cherries Industry Revenue billion Forecast, by Country 2020 & 2033
- Table 38: Global Fresh Cherries Industry Volume Metric Tons Forecast, by Country 2020 & 2033
- Table 39: Spain Fresh Cherries Industry Revenue (billion) Forecast, by Application 2020 & 2033
- Table 40: Spain Fresh Cherries Industry Volume (Metric Tons) Forecast, by Application 2020 & 2033
- Table 41: Global Fresh Cherries Industry Revenue billion Forecast, by Production Analysis 2020 & 2033
- Table 42: Global Fresh Cherries Industry Volume Metric Tons Forecast, by Production Analysis 2020 & 2033
- Table 43: Global Fresh Cherries Industry Revenue billion Forecast, by Consumption Analysis 2020 & 2033
- Table 44: Global Fresh Cherries Industry Volume Metric Tons Forecast, by Consumption Analysis 2020 & 2033
- Table 45: Global Fresh Cherries Industry Revenue billion Forecast, by Import Market Analysis (Value & Volume) 2020 & 2033
- Table 46: Global Fresh Cherries Industry Volume Metric Tons Forecast, by Import Market Analysis (Value & Volume) 2020 & 2033
- Table 47: Global Fresh Cherries Industry Revenue billion Forecast, by Export Market Analysis (Value & Volume) 2020 & 2033
- Table 48: Global Fresh Cherries Industry Volume Metric Tons Forecast, by Export Market Analysis (Value & Volume) 2020 & 2033
- Table 49: Global Fresh Cherries Industry Revenue billion Forecast, by Price Trend Analysis 2020 & 2033
- Table 50: Global Fresh Cherries Industry Volume Metric Tons Forecast, by Price Trend Analysis 2020 & 2033
- Table 51: Global Fresh Cherries Industry Revenue billion Forecast, by Country 2020 & 2033
- Table 52: Global Fresh Cherries Industry Volume Metric Tons Forecast, by Country 2020 & 2033
- Table 53: China Fresh Cherries Industry Revenue (billion) Forecast, by Application 2020 & 2033
- Table 54: China Fresh Cherries Industry Volume (Metric Tons) Forecast, by Application 2020 & 2033
- Table 55: Global Fresh Cherries Industry Revenue billion Forecast, by Production Analysis 2020 & 2033
- Table 56: Global Fresh Cherries Industry Volume Metric Tons Forecast, by Production Analysis 2020 & 2033
- Table 57: Global Fresh Cherries Industry Revenue billion Forecast, by Consumption Analysis 2020 & 2033
- Table 58: Global Fresh Cherries Industry Volume Metric Tons Forecast, by Consumption Analysis 2020 & 2033
- Table 59: Global Fresh Cherries Industry Revenue billion Forecast, by Import Market Analysis (Value & Volume) 2020 & 2033
- Table 60: Global Fresh Cherries Industry Volume Metric Tons Forecast, by Import Market Analysis (Value & Volume) 2020 & 2033
- Table 61: Global Fresh Cherries Industry Revenue billion Forecast, by Export Market Analysis (Value & Volume) 2020 & 2033
- Table 62: Global Fresh Cherries Industry Volume Metric Tons Forecast, by Export Market Analysis (Value & Volume) 2020 & 2033
- Table 63: Global Fresh Cherries Industry Revenue billion Forecast, by Price Trend Analysis 2020 & 2033
- Table 64: Global Fresh Cherries Industry Volume Metric Tons Forecast, by Price Trend Analysis 2020 & 2033
- Table 65: Global Fresh Cherries Industry Revenue billion Forecast, by Country 2020 & 2033
- Table 66: Global Fresh Cherries Industry Volume Metric Tons Forecast, by Country 2020 & 2033
- Table 67: Chile Fresh Cherries Industry Revenue (billion) Forecast, by Application 2020 & 2033
- Table 68: Chile Fresh Cherries Industry Volume (Metric Tons) Forecast, by Application 2020 & 2033
- Table 69: Global Fresh Cherries Industry Revenue billion Forecast, by Production Analysis 2020 & 2033
- Table 70: Global Fresh Cherries Industry Volume Metric Tons Forecast, by Production Analysis 2020 & 2033
- Table 71: Global Fresh Cherries Industry Revenue billion Forecast, by Consumption Analysis 2020 & 2033
- Table 72: Global Fresh Cherries Industry Volume Metric Tons Forecast, by Consumption Analysis 2020 & 2033
- Table 73: Global Fresh Cherries Industry Revenue billion Forecast, by Import Market Analysis (Value & Volume) 2020 & 2033
- Table 74: Global Fresh Cherries Industry Volume Metric Tons Forecast, by Import Market Analysis (Value & Volume) 2020 & 2033
- Table 75: Global Fresh Cherries Industry Revenue billion Forecast, by Export Market Analysis (Value & Volume) 2020 & 2033
- Table 76: Global Fresh Cherries Industry Volume Metric Tons Forecast, by Export Market Analysis (Value & Volume) 2020 & 2033
- Table 77: Global Fresh Cherries Industry Revenue billion Forecast, by Price Trend Analysis 2020 & 2033
- Table 78: Global Fresh Cherries Industry Volume Metric Tons Forecast, by Price Trend Analysis 2020 & 2033
- Table 79: Global Fresh Cherries Industry Revenue billion Forecast, by Country 2020 & 2033
- Table 80: Global Fresh Cherries Industry Volume Metric Tons Forecast, by Country 2020 & 2033
- Table 81: Turkey Fresh Cherries Industry Revenue (billion) Forecast, by Application 2020 & 2033
- Table 82: Turkey Fresh Cherries Industry Volume (Metric Tons) Forecast, by Application 2020 & 2033
Frequently Asked Questions
1. What is the projected Compound Annual Growth Rate (CAGR) of the Fresh Cherries Industry?
The projected CAGR is approximately 6.9%.
2. Which companies are prominent players in the Fresh Cherries Industry?
Key companies in the market include Erie Fruits International, Rainier Fruit Company , Stemilt Growers , Northwest Cherry Growers , Chelan Fresh .
3. What are the main segments of the Fresh Cherries Industry?
The market segments include Production Analysis, Consumption Analysis, Import Market Analysis (Value & Volume), Export Market Analysis (Value & Volume), Price Trend Analysis.
4. Can you provide details about the market size?
The market size is estimated to be USD 68 billion as of 2022.
5. What are some drivers contributing to market growth?
; Awareness About Health Benefits Associated With Pecan Consumption; Wide Application of Pecan.
6. What are the notable trends driving market growth?
Increasing Demand for Imported Sweet Cherries.
7. Are there any restraints impacting market growth?
; Volatility in the Prices; Adverse Weather Conditions Affecting Yield.
8. Can you provide examples of recent developments in the market?
October 2021: For the 2020-21 season, the United States Department of Agriculture (USDA) reported that US imports of Chilean cherries totaled about 6,800 metric tons. While China has been the main receiver of Chilean cherries, the industry is working diligently to develop other markets, including the United States.
9. What pricing options are available for accessing the report?
Pricing options include single-user, multi-user, and enterprise licenses priced at USD 4750, USD 5250, and USD 8750 respectively.
10. Is the market size provided in terms of value or volume?
The market size is provided in terms of value, measured in billion and volume, measured in Metric Tons.
11. Are there any specific market keywords associated with the report?
Yes, the market keyword associated with the report is "Fresh Cherries Industry," which aids in identifying and referencing the specific market segment covered.
12. How do I determine which pricing option suits my needs best?
The pricing options vary based on user requirements and access needs. Individual users may opt for single-user licenses, while businesses requiring broader access may choose multi-user or enterprise licenses for cost-effective access to the report.
13. Are there any additional resources or data provided in the Fresh Cherries Industry report?
While the report offers comprehensive insights, it's advisable to review the specific contents or supplementary materials provided to ascertain if additional resources or data are available.
14. How can I stay updated on further developments or reports in the Fresh Cherries Industry?
To stay informed about further developments, trends, and reports in the Fresh Cherries Industry, consider subscribing to industry newsletters, following relevant companies and organizations, or regularly checking reputable industry news sources and publications.
Methodology
Step 1 - Identification of Relevant Samples Size from Population Database


Step 2 - Approaches for Defining Global Market Size (Value, Volume* & Price*)

Note*: In applicable scenarios
Step 3 - Data Sources
Primary Research
- Web Analytics
- Survey Reports
- Research Institute
- Latest Research Reports
- Opinion Leaders
Secondary Research
- Annual Reports
- White Paper
- Latest Press Release
- Industry Association
- Paid Database
- Investor Presentations

Step 4 - Data Triangulation
Involves using different sources of information in order to increase the validity of a study
These sources are likely to be stakeholders in a program - participants, other researchers, program staff, other community members, and so on.
Then we put all data in single framework & apply various statistical tools to find out the dynamic on the market.
During the analysis stage, feedback from the stakeholder groups would be compared to determine areas of agreement as well as areas of divergence