

Key Insights
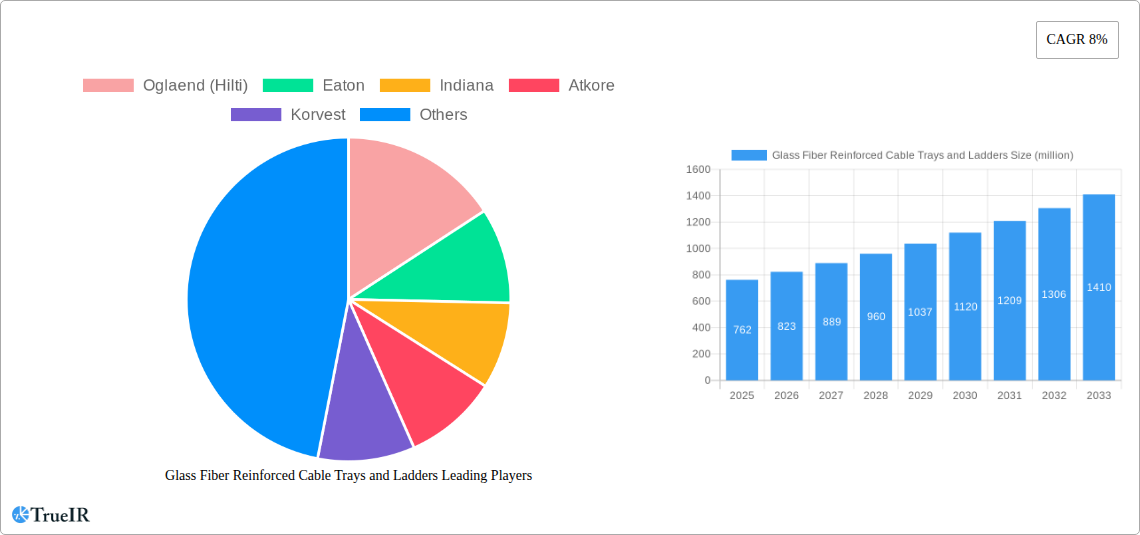
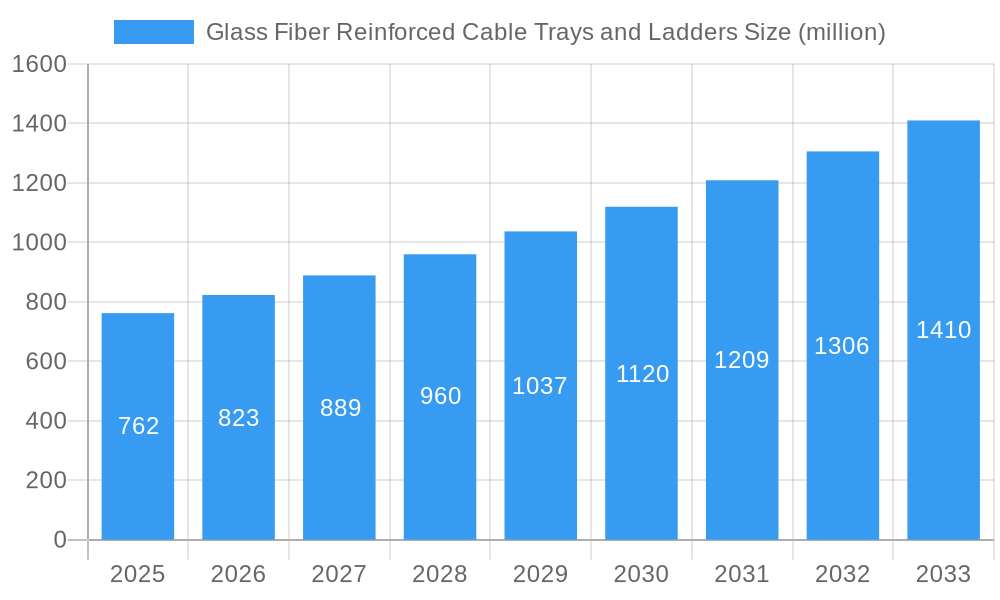
The global market for Glass Fiber Reinforced Plastic (GRP) cable trays and ladders is poised for significant expansion, projected to reach $762 million by 2025, demonstrating robust growth driven by escalating demand across diverse industrial sectors. This upward trajectory is underpinned by a compelling Compound Annual Growth Rate (CAGR) of 8%, indicating a healthy and sustained market expansion throughout the forecast period of 2025-2033. Key drivers fueling this growth include the inherent advantages of GRP materials – their superior corrosion resistance, high strength-to-weight ratio, and excellent electrical insulation properties, making them an ideal alternative to traditional metal-based solutions, particularly in harsh and corrosive environments. The burgeoning infrastructure development, coupled with the increasing adoption of advanced electrical and communication systems in sectors like IT and Telecom, Manufacturing, and Energy & Utility, further propels market penetration. The trend towards lightweight yet durable construction materials in industrial and infrastructure projects is a significant tailwind, as is the growing emphasis on safety and compliance with stringent industry standards.
Glass Fiber Reinforced Cable Trays and Ladders Market Size (In Million)
The market's dynamic nature is further shaped by its segmentation. The "IT and Telecom" and "Manufacturing" segments are anticipated to be prominent contributors due to the continuous evolution of data infrastructure and industrial automation. GRP perforated cable trays, offering enhanced ventilation and debris management, are expected to gain considerable traction alongside the traditional GRP ladder types. While the market presents substantial opportunities, certain restraints may influence its pace. The initial cost of GRP materials, although offset by long-term durability and reduced maintenance, can be a consideration for some adopters. Additionally, the availability of established metal cable tray systems and the need for specialized installation expertise might present minor hurdles. However, the overarching benefits of GRP, including its environmental friendliness and non-conductive nature, are increasingly outweighing these challenges, positioning the market for continued strong performance and innovation. Major players such as Eaton, Atkore, and Legrand are actively investing in product development and expanding their global reach to capitalize on this burgeoning demand.
Glass Fiber Reinforced Cable Trays and Ladders Company Market Share
This in-depth report provides a detailed analysis of the global Glass Fiber Reinforced (GRP) Cable Trays and Ladders market, encompassing historical trends, current dynamics, and future projections from 2019 to 2033. Leveraging high-volume SEO keywords, this report is meticulously crafted for industry professionals, stakeholders, and decision-makers seeking to understand market segmentation, competitive landscapes, technological advancements, and growth opportunities within this vital sector. The study period covers 2019–2033, with a base year of 2025 and a forecast period of 2025–2033, building upon the historical period of 2019–2024.
Glass Fiber Reinforced Cable Trays and Ladders Market Structure & Competitive Landscape
The global Glass Fiber Reinforced Cable Trays and Ladders market exhibits a moderately concentrated structure, with a few key players holding significant market share, estimated at over 60% in the base year of 2025. This concentration is driven by substantial initial investment requirements for manufacturing facilities and robust R&D capabilities. Innovation is a critical driver, with companies continuously investing in developing lighter, stronger, and more corrosion-resistant GRP materials. For instance, over the historical period (2019-2024), investments in material science research for GRP composites saw an average annual increase of approximately 5%. Regulatory impacts, particularly concerning safety standards and environmental compliance in sectors like Energy & Utility and Oil & Gas, are shaping product development and market entry strategies. The market's competitiveness is also influenced by the availability of product substitutes, such as traditional metal cable trays, which offer lower initial costs but often lack the superior corrosion resistance and weight advantages of GRP. End-user segmentation reveals a growing reliance on GRP solutions across IT and Telecom, Manufacturing, Energy & Utility, and Oil and Gas sectors, each with unique performance demands. Mergers and acquisitions (M&A) trends are observable, with larger entities acquiring smaller, specialized GRP manufacturers to expand their product portfolios and geographical reach. Over the forecast period (2025-2033), an estimated 10-15 significant M&A activities are anticipated, reflecting a consolidation drive.
Glass Fiber Reinforced Cable Trays and Ladders Market Trends & Opportunities
The global Glass Fiber Reinforced Cable Trays and Ladders market is poised for robust expansion, with a projected Compound Annual Growth Rate (CAGR) of approximately 7.5% between 2025 and 2033. This significant market size growth, estimated to reach over USD 2,500 million by 2033, is fueled by several interconnected trends. A primary driver is the escalating demand for durable, corrosion-resistant, and lightweight cable management solutions across diverse industrial applications, particularly in harsh environments prevalent in the Energy & Utility, Oil & Gas, and Mining sectors. Technological shifts are evident in the advancement of GRP manufacturing processes, enabling the production of more complex shapes and custom designs, thereby catering to specialized project requirements. Innovations in resin formulations and fiber reinforcement techniques are enhancing the mechanical strength and fire-retardant properties of GRP cable trays and ladders. Consumer preferences are increasingly leaning towards GRP due to its lower lifecycle costs compared to traditional materials, attributed to minimal maintenance requirements and extended product lifespan, often exceeding 20 years. The growing global emphasis on infrastructure development, including renewable energy projects and the expansion of digital communication networks, directly translates into increased demand for reliable cable support systems. Competitive dynamics are intensifying, with established players focusing on product differentiation through superior performance characteristics and a growing number of regional manufacturers entering the market. Market penetration rates for GRP cable trays and ladders are steadily increasing, especially in developed economies with stringent infrastructure and safety regulations, currently standing at an estimated 35% of the total cable tray market in 2025, with expectations to reach over 45% by 2033. The development of smart cable management systems integrating IoT capabilities within GRP structures presents a significant emerging opportunity. Furthermore, the rising adoption of GRP in offshore installations and chemical processing plants, where extreme environmental resistance is paramount, is a key growth avenue. The market is also benefiting from increasing awareness regarding the environmental advantages of GRP, such as its recyclability and lower carbon footprint during production compared to some metal alternatives. The trend towards modular construction in various industries also favors the adoption of GRP cable trays and ladders due to their ease of installation and flexibility.
Dominant Markets & Segments in Glass Fiber Reinforced Cable Trays and Ladders
North America currently holds a dominant position in the Glass Fiber Reinforced Cable Trays and Ladders market, driven by extensive infrastructure development, stringent safety regulations, and a strong presence of key end-user industries like Energy & Utility and Oil & Gas. Within North America, the United States accounts for over 70% of the regional market share, propelled by significant investments in petrochemical facilities and the expansion of data centers. Asia Pacific, particularly China and India, is emerging as a rapidly growing market, with an estimated CAGR of over 8% for the forecast period. This growth is attributed to large-scale industrialization, rapid urbanization, and substantial government initiatives focused on developing robust energy and telecommunication networks.
Application Segment Dominance:
- Energy & Utility: This segment is the largest contributor to the global GRP cable tray and ladder market, representing over 30% of the market share in 2025. Growth is fueled by the ongoing expansion of power grids, the increasing adoption of renewable energy sources (solar, wind, and hydro), and the need for corrosion-resistant solutions in substations and power plants. Government policies promoting energy independence and grid modernization further bolster this segment.
- Oil and Gas: Another significant segment, particularly in regions with substantial offshore and onshore exploration and production activities. The inherent resistance of GRP to corrosive chemicals, saltwater, and extreme temperatures makes it an ideal choice for refineries, pipelines, and offshore platforms. The demand here is closely tied to global oil prices and exploration investments.
- IT and Telecom: This segment is experiencing rapid growth due to the continuous expansion of 5G networks, data centers, and telecommunication infrastructure. GRP's non-conductive properties and resistance to electromagnetic interference (EMI) are crucial advantages in these sensitive environments.
- Manufacturing: Industrial facilities, including automotive, aerospace, and chemical manufacturing plants, are increasingly adopting GRP cable trays for their durability and chemical resistance.
- Mining: The demanding conditions in mining operations, characterized by dust, moisture, and corrosive elements, make GRP cable trays and ladders a preferred choice for their longevity and low maintenance.
Type Segment Dominance:
- GRP Ladder Type: This type segment is expected to hold the largest market share due to its robustness, ease of installation, and suitability for heavy-duty applications across various industries, particularly in Energy & Utility and Oil & Gas.
- GRP Perforated Type: This segment is gaining traction due to its flexibility in cable routing and ventilation properties, making it suitable for IT and Telecom and Manufacturing applications.
- Other Types: This includes specialized GRP cable tray systems designed for specific industrial needs, which are also witnessing steady demand.
Glass Fiber Reinforced Cable Trays and Ladders Product Analysis
Glass Fiber Reinforced Cable Trays and Ladders are distinguished by their exceptional material properties, offering superior resistance to corrosion, chemicals, and harsh environmental conditions compared to traditional metal alternatives. Innovations are focused on enhancing mechanical strength, improving fire-retardant capabilities through advanced resin formulations, and developing lightweight yet robust structures. These products find extensive applications in demanding sectors like Energy & Utility, Oil & Gas, and IT/Telecom due to their non-conductive nature, electromagnetic interference (EMI) shielding, and low maintenance requirements. The competitive advantage lies in their extended lifespan, estimated to be over 20 years, leading to lower lifecycle costs for end-users. Product customization is also a growing trend, with manufacturers offering tailored solutions to meet specific project specifications, further solidifying their market fit.
Key Drivers, Barriers & Challenges in Glass Fiber Reinforced Cable Trays and Ladders
Key Drivers:
The Glass Fiber Reinforced Cable Trays and Ladders market is propelled by significant growth catalysts. The increasing global investment in infrastructure development, particularly in renewable energy projects and telecommunication networks, directly translates into higher demand. The inherent superior corrosion resistance and lightweight properties of GRP, compared to traditional materials, make it the preferred choice in harsh environments. Stringent safety regulations and a growing emphasis on energy efficiency also favor GRP solutions. Technological advancements in composite materials and manufacturing processes are leading to improved product performance and cost-effectiveness, driving wider adoption. For example, the continuous improvement in resin technology has led to enhanced UV resistance and fire retardancy, meeting stricter industry standards.
Barriers & Challenges:
Despite strong growth prospects, the market faces several challenges. The initial cost of GRP cable trays and ladders can be higher than conventional metal options, posing a barrier for some price-sensitive customers, although lifecycle cost analysis often negates this concern. Supply chain disruptions for raw materials, particularly specialized resins and glass fibers, can impact production volumes and pricing. Intense competition from established metal tray manufacturers and the emergence of new GRP players create pricing pressures. Regulatory hurdles and the need for product standardization across different regions can also present complexities for manufacturers. For instance, fluctuating prices of raw materials like petroleum-based resins can create cost volatility, impacting profit margins. The perceived complexity of installation for certain GRP systems can also be a minor restraint, though training and innovative fastening systems are addressing this.
Growth Drivers in the Glass Fiber Reinforced Cable Trays and Ladders Market
The growth of the Glass Fiber Reinforced Cable Trays and Ladders market is primarily driven by the global surge in infrastructure development projects, especially in the renewable energy sector and expanding telecommunication networks. The superior corrosion resistance and lightweight nature of GRP materials make them highly attractive for use in demanding environments such as offshore oil rigs, chemical plants, and coastal power stations, where traditional materials rapidly degrade. Stringent safety regulations and a growing global focus on energy efficiency further bolster demand, as GRP's non-conductive properties and thermal insulation capabilities offer significant advantages. Technological advancements in composite material science and manufacturing processes, leading to enhanced durability, fire retardancy, and design flexibility, are also key growth enablers. For instance, the development of self-extinguishing GRP formulations is critical for applications in sensitive environments.
Challenges Impacting Glass Fiber Reinforced Cable Trays and Ladders Growth
While the market is expanding, several challenges impede its full growth potential. The initial capital expenditure for GRP cable trays and ladders can be a significant barrier for some smaller enterprises or projects with tight budgets, even though their long-term cost-effectiveness is well-established. Fluctuations in the prices of key raw materials, such as specialty resins and fiberglass, can lead to cost volatility and impact profit margins. The market also faces intense competition from established manufacturers of traditional metal cable trays, requiring continuous innovation and aggressive marketing to highlight the unique benefits of GRP. Supply chain vulnerabilities, particularly for specialized components and raw materials sourced globally, can lead to production delays and increased lead times, impacting project timelines. Regulatory compliance across different regions, with varying standards and approval processes, adds another layer of complexity for manufacturers aiming for global reach.
Key Players Shaping the Glass Fiber Reinforced Cable Trays and Ladders Market
- Oglaend (Hilti)
- Eaton
- Indiana
- Atkore
- Korvest
- Treadwell
- Niedax
- Thomas & Betts (ABB)
- Unitech
- Storskogen
- Real Safety
- MP Husky
- Omkar Composites Pvt ltd
- Sharda Cable Trays Pvt. Ltd.
- Ferrotech Structurals
- Fiber Tech Composite Private Limited
- Fibex
- EPP Composites
- ERCON Composites
- Hebei Longxin
- Jiansu Huapeng
- Hebei Chuangye
- Zhenjiang Shenlong
- King Sitong
- Legrand
Significant Glass Fiber Reinforced Cable Trays and Ladders Industry Milestones
- 2019: Increased adoption of GRP cable trays in offshore wind farm construction due to enhanced corrosion resistance.
- 2020: Development of advanced fire-retardant GRP formulations to meet stringent safety standards in tunnels and data centers.
- 2021: Significant investments in R&D for lightweight, high-strength GRP composites to reduce installation time and costs.
- 2022: Growing demand for GRP cable management solutions in 5G infrastructure rollouts, highlighting non-conductive properties.
- 2023: Emergence of smart GRP cable trays with integrated sensor capabilities for predictive maintenance in critical infrastructure.
- 2024: Strategic partnerships and acquisitions aimed at expanding product portfolios and geographical reach for key market players.
Future Outlook for Glass Fiber Reinforced Cable Trays and Ladders Market
The future outlook for the Glass Fiber Reinforced Cable Trays and Ladders market is exceptionally bright, driven by sustained global infrastructure development and an increasing emphasis on sustainable and durable construction materials. Strategic opportunities lie in expanding applications within the rapidly growing renewable energy sector, including advanced solutions for solar and wind power installations. The burgeoning demand for data centers and telecommunication networks will continue to fuel the adoption of GRP for its electrical insulation properties and resistance to electromagnetic interference. Market potential is also significant in emerging economies undergoing rapid industrialization and infrastructure upgrades. Innovations in smart GRP systems, integrating IoT capabilities for enhanced monitoring and control, are expected to open new revenue streams. The focus on lifecycle cost savings and reduced environmental impact will further solidify GRP's position as a preferred material, presenting a compelling growth trajectory for the industry.
Glass Fiber Reinforced Cable Trays and Ladders Segmentation
-
1. Application
- 1.1. IT and Telecom
- 1.2. Manufacturing
- 1.3. Energy & Utility
- 1.4. Oil and Gas
- 1.5. Mining
- 1.6. Other
-
2. Types
- 2.1. GRP Ladder Type
- 2.2. GRP Perforated Type
- 2.3. Other Types
Glass Fiber Reinforced Cable Trays and Ladders Segmentation By Geography
-
1. North America
- 1.1. United States
- 1.2. Canada
- 1.3. Mexico
-
2. South America
- 2.1. Brazil
- 2.2. Argentina
- 2.3. Rest of South America
-
3. Europe
- 3.1. United Kingdom
- 3.2. Germany
- 3.3. France
- 3.4. Italy
- 3.5. Spain
- 3.6. Russia
- 3.7. Benelux
- 3.8. Nordics
- 3.9. Rest of Europe
-
4. Middle East & Africa
- 4.1. Turkey
- 4.2. Israel
- 4.3. GCC
- 4.4. North Africa
- 4.5. South Africa
- 4.6. Rest of Middle East & Africa
-
5. Asia Pacific
- 5.1. China
- 5.2. India
- 5.3. Japan
- 5.4. South Korea
- 5.5. ASEAN
- 5.6. Oceania
- 5.7. Rest of Asia Pacific
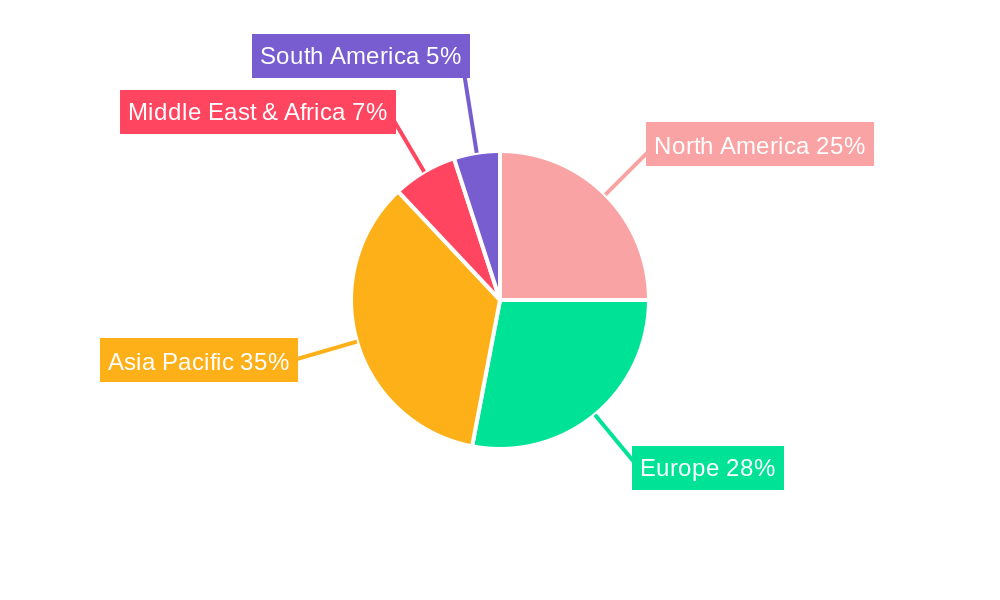
Glass Fiber Reinforced Cable Trays and Ladders Regional Market Share
Geographic Coverage of Glass Fiber Reinforced Cable Trays and Ladders
Glass Fiber Reinforced Cable Trays and Ladders REPORT HIGHLIGHTS
| Aspects | Details |
|---|---|
| Study Period | 2020-2034 |
| Base Year | 2025 |
| Estimated Year | 2026 |
| Forecast Period | 2026-2034 |
| Historical Period | 2020-2025 |
| Growth Rate | CAGR of 8% from 2020-2034 |
| Segmentation |
|
Table of Contents
- 1. Introduction
- 1.1. Research Scope
- 1.2. Market Segmentation
- 1.3. Research Methodology
- 1.4. Definitions and Assumptions
- 2. Executive Summary
- 2.1. Introduction
- 3. Market Dynamics
- 3.1. Introduction
- 3.2. Market Drivers
- 3.3. Market Restrains
- 3.4. Market Trends
- 4. Market Factor Analysis
- 4.1. Porters Five Forces
- 4.2. Supply/Value Chain
- 4.3. PESTEL analysis
- 4.4. Market Entropy
- 4.5. Patent/Trademark Analysis
- 5. Global Glass Fiber Reinforced Cable Trays and Ladders Analysis, Insights and Forecast, 2020-2032
- 5.1. Market Analysis, Insights and Forecast - by Application
- 5.1.1. IT and Telecom
- 5.1.2. Manufacturing
- 5.1.3. Energy & Utility
- 5.1.4. Oil and Gas
- 5.1.5. Mining
- 5.1.6. Other
- 5.2. Market Analysis, Insights and Forecast - by Types
- 5.2.1. GRP Ladder Type
- 5.2.2. GRP Perforated Type
- 5.2.3. Other Types
- 5.3. Market Analysis, Insights and Forecast - by Region
- 5.3.1. North America
- 5.3.2. South America
- 5.3.3. Europe
- 5.3.4. Middle East & Africa
- 5.3.5. Asia Pacific
- 5.1. Market Analysis, Insights and Forecast - by Application
- 6. North America Glass Fiber Reinforced Cable Trays and Ladders Analysis, Insights and Forecast, 2020-2032
- 6.1. Market Analysis, Insights and Forecast - by Application
- 6.1.1. IT and Telecom
- 6.1.2. Manufacturing
- 6.1.3. Energy & Utility
- 6.1.4. Oil and Gas
- 6.1.5. Mining
- 6.1.6. Other
- 6.2. Market Analysis, Insights and Forecast - by Types
- 6.2.1. GRP Ladder Type
- 6.2.2. GRP Perforated Type
- 6.2.3. Other Types
- 6.1. Market Analysis, Insights and Forecast - by Application
- 7. South America Glass Fiber Reinforced Cable Trays and Ladders Analysis, Insights and Forecast, 2020-2032
- 7.1. Market Analysis, Insights and Forecast - by Application
- 7.1.1. IT and Telecom
- 7.1.2. Manufacturing
- 7.1.3. Energy & Utility
- 7.1.4. Oil and Gas
- 7.1.5. Mining
- 7.1.6. Other
- 7.2. Market Analysis, Insights and Forecast - by Types
- 7.2.1. GRP Ladder Type
- 7.2.2. GRP Perforated Type
- 7.2.3. Other Types
- 7.1. Market Analysis, Insights and Forecast - by Application
- 8. Europe Glass Fiber Reinforced Cable Trays and Ladders Analysis, Insights and Forecast, 2020-2032
- 8.1. Market Analysis, Insights and Forecast - by Application
- 8.1.1. IT and Telecom
- 8.1.2. Manufacturing
- 8.1.3. Energy & Utility
- 8.1.4. Oil and Gas
- 8.1.5. Mining
- 8.1.6. Other
- 8.2. Market Analysis, Insights and Forecast - by Types
- 8.2.1. GRP Ladder Type
- 8.2.2. GRP Perforated Type
- 8.2.3. Other Types
- 8.1. Market Analysis, Insights and Forecast - by Application
- 9. Middle East & Africa Glass Fiber Reinforced Cable Trays and Ladders Analysis, Insights and Forecast, 2020-2032
- 9.1. Market Analysis, Insights and Forecast - by Application
- 9.1.1. IT and Telecom
- 9.1.2. Manufacturing
- 9.1.3. Energy & Utility
- 9.1.4. Oil and Gas
- 9.1.5. Mining
- 9.1.6. Other
- 9.2. Market Analysis, Insights and Forecast - by Types
- 9.2.1. GRP Ladder Type
- 9.2.2. GRP Perforated Type
- 9.2.3. Other Types
- 9.1. Market Analysis, Insights and Forecast - by Application
- 10. Asia Pacific Glass Fiber Reinforced Cable Trays and Ladders Analysis, Insights and Forecast, 2020-2032
- 10.1. Market Analysis, Insights and Forecast - by Application
- 10.1.1. IT and Telecom
- 10.1.2. Manufacturing
- 10.1.3. Energy & Utility
- 10.1.4. Oil and Gas
- 10.1.5. Mining
- 10.1.6. Other
- 10.2. Market Analysis, Insights and Forecast - by Types
- 10.2.1. GRP Ladder Type
- 10.2.2. GRP Perforated Type
- 10.2.3. Other Types
- 10.1. Market Analysis, Insights and Forecast - by Application
- 11. Competitive Analysis
- 11.1. Global Market Share Analysis 2025
- 11.2. Company Profiles
- 11.2.1 Oglaend (Hilti)
- 11.2.1.1. Overview
- 11.2.1.2. Products
- 11.2.1.3. SWOT Analysis
- 11.2.1.4. Recent Developments
- 11.2.1.5. Financials (Based on Availability)
- 11.2.2 Eaton
- 11.2.2.1. Overview
- 11.2.2.2. Products
- 11.2.2.3. SWOT Analysis
- 11.2.2.4. Recent Developments
- 11.2.2.5. Financials (Based on Availability)
- 11.2.3 Indiana
- 11.2.3.1. Overview
- 11.2.3.2. Products
- 11.2.3.3. SWOT Analysis
- 11.2.3.4. Recent Developments
- 11.2.3.5. Financials (Based on Availability)
- 11.2.4 Atkore
- 11.2.4.1. Overview
- 11.2.4.2. Products
- 11.2.4.3. SWOT Analysis
- 11.2.4.4. Recent Developments
- 11.2.4.5. Financials (Based on Availability)
- 11.2.5 Korvest
- 11.2.5.1. Overview
- 11.2.5.2. Products
- 11.2.5.3. SWOT Analysis
- 11.2.5.4. Recent Developments
- 11.2.5.5. Financials (Based on Availability)
- 11.2.6 Treadwell
- 11.2.6.1. Overview
- 11.2.6.2. Products
- 11.2.6.3. SWOT Analysis
- 11.2.6.4. Recent Developments
- 11.2.6.5. Financials (Based on Availability)
- 11.2.7 Niedax
- 11.2.7.1. Overview
- 11.2.7.2. Products
- 11.2.7.3. SWOT Analysis
- 11.2.7.4. Recent Developments
- 11.2.7.5. Financials (Based on Availability)
- 11.2.8 Thomas & Betts (ABB)
- 11.2.8.1. Overview
- 11.2.8.2. Products
- 11.2.8.3. SWOT Analysis
- 11.2.8.4. Recent Developments
- 11.2.8.5. Financials (Based on Availability)
- 11.2.9 Unitech
- 11.2.9.1. Overview
- 11.2.9.2. Products
- 11.2.9.3. SWOT Analysis
- 11.2.9.4. Recent Developments
- 11.2.9.5. Financials (Based on Availability)
- 11.2.10 Storskogen
- 11.2.10.1. Overview
- 11.2.10.2. Products
- 11.2.10.3. SWOT Analysis
- 11.2.10.4. Recent Developments
- 11.2.10.5. Financials (Based on Availability)
- 11.2.11 Real Safety
- 11.2.11.1. Overview
- 11.2.11.2. Products
- 11.2.11.3. SWOT Analysis
- 11.2.11.4. Recent Developments
- 11.2.11.5. Financials (Based on Availability)
- 11.2.12 MP Husky
- 11.2.12.1. Overview
- 11.2.12.2. Products
- 11.2.12.3. SWOT Analysis
- 11.2.12.4. Recent Developments
- 11.2.12.5. Financials (Based on Availability)
- 11.2.13 Omkar Composites Pvt ltd
- 11.2.13.1. Overview
- 11.2.13.2. Products
- 11.2.13.3. SWOT Analysis
- 11.2.13.4. Recent Developments
- 11.2.13.5. Financials (Based on Availability)
- 11.2.14 Sharda Cable Trays Pvt. Ltd.
- 11.2.14.1. Overview
- 11.2.14.2. Products
- 11.2.14.3. SWOT Analysis
- 11.2.14.4. Recent Developments
- 11.2.14.5. Financials (Based on Availability)
- 11.2.15 Ferrotech Structurals
- 11.2.15.1. Overview
- 11.2.15.2. Products
- 11.2.15.3. SWOT Analysis
- 11.2.15.4. Recent Developments
- 11.2.15.5. Financials (Based on Availability)
- 11.2.16 Fiber Tech Composite Private Limited
- 11.2.16.1. Overview
- 11.2.16.2. Products
- 11.2.16.3. SWOT Analysis
- 11.2.16.4. Recent Developments
- 11.2.16.5. Financials (Based on Availability)
- 11.2.17 Fibex
- 11.2.17.1. Overview
- 11.2.17.2. Products
- 11.2.17.3. SWOT Analysis
- 11.2.17.4. Recent Developments
- 11.2.17.5. Financials (Based on Availability)
- 11.2.18 EPP Composites
- 11.2.18.1. Overview
- 11.2.18.2. Products
- 11.2.18.3. SWOT Analysis
- 11.2.18.4. Recent Developments
- 11.2.18.5. Financials (Based on Availability)
- 11.2.19 ERCON Composites
- 11.2.19.1. Overview
- 11.2.19.2. Products
- 11.2.19.3. SWOT Analysis
- 11.2.19.4. Recent Developments
- 11.2.19.5. Financials (Based on Availability)
- 11.2.20 Hebei Longxin
- 11.2.20.1. Overview
- 11.2.20.2. Products
- 11.2.20.3. SWOT Analysis
- 11.2.20.4. Recent Developments
- 11.2.20.5. Financials (Based on Availability)
- 11.2.21 Jiansu Huapeng
- 11.2.21.1. Overview
- 11.2.21.2. Products
- 11.2.21.3. SWOT Analysis
- 11.2.21.4. Recent Developments
- 11.2.21.5. Financials (Based on Availability)
- 11.2.22 Hebei Chuangye
- 11.2.22.1. Overview
- 11.2.22.2. Products
- 11.2.22.3. SWOT Analysis
- 11.2.22.4. Recent Developments
- 11.2.22.5. Financials (Based on Availability)
- 11.2.23 Zhenjiang Shenlong
- 11.2.23.1. Overview
- 11.2.23.2. Products
- 11.2.23.3. SWOT Analysis
- 11.2.23.4. Recent Developments
- 11.2.23.5. Financials (Based on Availability)
- 11.2.24 King Sitong
- 11.2.24.1. Overview
- 11.2.24.2. Products
- 11.2.24.3. SWOT Analysis
- 11.2.24.4. Recent Developments
- 11.2.24.5. Financials (Based on Availability)
- 11.2.25 Legrand
- 11.2.25.1. Overview
- 11.2.25.2. Products
- 11.2.25.3. SWOT Analysis
- 11.2.25.4. Recent Developments
- 11.2.25.5. Financials (Based on Availability)
- 11.2.1 Oglaend (Hilti)
List of Figures
- Figure 1: Global Glass Fiber Reinforced Cable Trays and Ladders Revenue Breakdown (million, %) by Region 2025 & 2033
- Figure 2: Global Glass Fiber Reinforced Cable Trays and Ladders Volume Breakdown (K, %) by Region 2025 & 2033
- Figure 3: North America Glass Fiber Reinforced Cable Trays and Ladders Revenue (million), by Application 2025 & 2033
- Figure 4: North America Glass Fiber Reinforced Cable Trays and Ladders Volume (K), by Application 2025 & 2033
- Figure 5: North America Glass Fiber Reinforced Cable Trays and Ladders Revenue Share (%), by Application 2025 & 2033
- Figure 6: North America Glass Fiber Reinforced Cable Trays and Ladders Volume Share (%), by Application 2025 & 2033
- Figure 7: North America Glass Fiber Reinforced Cable Trays and Ladders Revenue (million), by Types 2025 & 2033
- Figure 8: North America Glass Fiber Reinforced Cable Trays and Ladders Volume (K), by Types 2025 & 2033
- Figure 9: North America Glass Fiber Reinforced Cable Trays and Ladders Revenue Share (%), by Types 2025 & 2033
- Figure 10: North America Glass Fiber Reinforced Cable Trays and Ladders Volume Share (%), by Types 2025 & 2033
- Figure 11: North America Glass Fiber Reinforced Cable Trays and Ladders Revenue (million), by Country 2025 & 2033
- Figure 12: North America Glass Fiber Reinforced Cable Trays and Ladders Volume (K), by Country 2025 & 2033
- Figure 13: North America Glass Fiber Reinforced Cable Trays and Ladders Revenue Share (%), by Country 2025 & 2033
- Figure 14: North America Glass Fiber Reinforced Cable Trays and Ladders Volume Share (%), by Country 2025 & 2033
- Figure 15: South America Glass Fiber Reinforced Cable Trays and Ladders Revenue (million), by Application 2025 & 2033
- Figure 16: South America Glass Fiber Reinforced Cable Trays and Ladders Volume (K), by Application 2025 & 2033
- Figure 17: South America Glass Fiber Reinforced Cable Trays and Ladders Revenue Share (%), by Application 2025 & 2033
- Figure 18: South America Glass Fiber Reinforced Cable Trays and Ladders Volume Share (%), by Application 2025 & 2033
- Figure 19: South America Glass Fiber Reinforced Cable Trays and Ladders Revenue (million), by Types 2025 & 2033
- Figure 20: South America Glass Fiber Reinforced Cable Trays and Ladders Volume (K), by Types 2025 & 2033
- Figure 21: South America Glass Fiber Reinforced Cable Trays and Ladders Revenue Share (%), by Types 2025 & 2033
- Figure 22: South America Glass Fiber Reinforced Cable Trays and Ladders Volume Share (%), by Types 2025 & 2033
- Figure 23: South America Glass Fiber Reinforced Cable Trays and Ladders Revenue (million), by Country 2025 & 2033
- Figure 24: South America Glass Fiber Reinforced Cable Trays and Ladders Volume (K), by Country 2025 & 2033
- Figure 25: South America Glass Fiber Reinforced Cable Trays and Ladders Revenue Share (%), by Country 2025 & 2033
- Figure 26: South America Glass Fiber Reinforced Cable Trays and Ladders Volume Share (%), by Country 2025 & 2033
- Figure 27: Europe Glass Fiber Reinforced Cable Trays and Ladders Revenue (million), by Application 2025 & 2033
- Figure 28: Europe Glass Fiber Reinforced Cable Trays and Ladders Volume (K), by Application 2025 & 2033
- Figure 29: Europe Glass Fiber Reinforced Cable Trays and Ladders Revenue Share (%), by Application 2025 & 2033
- Figure 30: Europe Glass Fiber Reinforced Cable Trays and Ladders Volume Share (%), by Application 2025 & 2033
- Figure 31: Europe Glass Fiber Reinforced Cable Trays and Ladders Revenue (million), by Types 2025 & 2033
- Figure 32: Europe Glass Fiber Reinforced Cable Trays and Ladders Volume (K), by Types 2025 & 2033
- Figure 33: Europe Glass Fiber Reinforced Cable Trays and Ladders Revenue Share (%), by Types 2025 & 2033
- Figure 34: Europe Glass Fiber Reinforced Cable Trays and Ladders Volume Share (%), by Types 2025 & 2033
- Figure 35: Europe Glass Fiber Reinforced Cable Trays and Ladders Revenue (million), by Country 2025 & 2033
- Figure 36: Europe Glass Fiber Reinforced Cable Trays and Ladders Volume (K), by Country 2025 & 2033
- Figure 37: Europe Glass Fiber Reinforced Cable Trays and Ladders Revenue Share (%), by Country 2025 & 2033
- Figure 38: Europe Glass Fiber Reinforced Cable Trays and Ladders Volume Share (%), by Country 2025 & 2033
- Figure 39: Middle East & Africa Glass Fiber Reinforced Cable Trays and Ladders Revenue (million), by Application 2025 & 2033
- Figure 40: Middle East & Africa Glass Fiber Reinforced Cable Trays and Ladders Volume (K), by Application 2025 & 2033
- Figure 41: Middle East & Africa Glass Fiber Reinforced Cable Trays and Ladders Revenue Share (%), by Application 2025 & 2033
- Figure 42: Middle East & Africa Glass Fiber Reinforced Cable Trays and Ladders Volume Share (%), by Application 2025 & 2033
- Figure 43: Middle East & Africa Glass Fiber Reinforced Cable Trays and Ladders Revenue (million), by Types 2025 & 2033
- Figure 44: Middle East & Africa Glass Fiber Reinforced Cable Trays and Ladders Volume (K), by Types 2025 & 2033
- Figure 45: Middle East & Africa Glass Fiber Reinforced Cable Trays and Ladders Revenue Share (%), by Types 2025 & 2033
- Figure 46: Middle East & Africa Glass Fiber Reinforced Cable Trays and Ladders Volume Share (%), by Types 2025 & 2033
- Figure 47: Middle East & Africa Glass Fiber Reinforced Cable Trays and Ladders Revenue (million), by Country 2025 & 2033
- Figure 48: Middle East & Africa Glass Fiber Reinforced Cable Trays and Ladders Volume (K), by Country 2025 & 2033
- Figure 49: Middle East & Africa Glass Fiber Reinforced Cable Trays and Ladders Revenue Share (%), by Country 2025 & 2033
- Figure 50: Middle East & Africa Glass Fiber Reinforced Cable Trays and Ladders Volume Share (%), by Country 2025 & 2033
- Figure 51: Asia Pacific Glass Fiber Reinforced Cable Trays and Ladders Revenue (million), by Application 2025 & 2033
- Figure 52: Asia Pacific Glass Fiber Reinforced Cable Trays and Ladders Volume (K), by Application 2025 & 2033
- Figure 53: Asia Pacific Glass Fiber Reinforced Cable Trays and Ladders Revenue Share (%), by Application 2025 & 2033
- Figure 54: Asia Pacific Glass Fiber Reinforced Cable Trays and Ladders Volume Share (%), by Application 2025 & 2033
- Figure 55: Asia Pacific Glass Fiber Reinforced Cable Trays and Ladders Revenue (million), by Types 2025 & 2033
- Figure 56: Asia Pacific Glass Fiber Reinforced Cable Trays and Ladders Volume (K), by Types 2025 & 2033
- Figure 57: Asia Pacific Glass Fiber Reinforced Cable Trays and Ladders Revenue Share (%), by Types 2025 & 2033
- Figure 58: Asia Pacific Glass Fiber Reinforced Cable Trays and Ladders Volume Share (%), by Types 2025 & 2033
- Figure 59: Asia Pacific Glass Fiber Reinforced Cable Trays and Ladders Revenue (million), by Country 2025 & 2033
- Figure 60: Asia Pacific Glass Fiber Reinforced Cable Trays and Ladders Volume (K), by Country 2025 & 2033
- Figure 61: Asia Pacific Glass Fiber Reinforced Cable Trays and Ladders Revenue Share (%), by Country 2025 & 2033
- Figure 62: Asia Pacific Glass Fiber Reinforced Cable Trays and Ladders Volume Share (%), by Country 2025 & 2033
List of Tables
- Table 1: Global Glass Fiber Reinforced Cable Trays and Ladders Revenue million Forecast, by Application 2020 & 2033
- Table 2: Global Glass Fiber Reinforced Cable Trays and Ladders Volume K Forecast, by Application 2020 & 2033
- Table 3: Global Glass Fiber Reinforced Cable Trays and Ladders Revenue million Forecast, by Types 2020 & 2033
- Table 4: Global Glass Fiber Reinforced Cable Trays and Ladders Volume K Forecast, by Types 2020 & 2033
- Table 5: Global Glass Fiber Reinforced Cable Trays and Ladders Revenue million Forecast, by Region 2020 & 2033
- Table 6: Global Glass Fiber Reinforced Cable Trays and Ladders Volume K Forecast, by Region 2020 & 2033
- Table 7: Global Glass Fiber Reinforced Cable Trays and Ladders Revenue million Forecast, by Application 2020 & 2033
- Table 8: Global Glass Fiber Reinforced Cable Trays and Ladders Volume K Forecast, by Application 2020 & 2033
- Table 9: Global Glass Fiber Reinforced Cable Trays and Ladders Revenue million Forecast, by Types 2020 & 2033
- Table 10: Global Glass Fiber Reinforced Cable Trays and Ladders Volume K Forecast, by Types 2020 & 2033
- Table 11: Global Glass Fiber Reinforced Cable Trays and Ladders Revenue million Forecast, by Country 2020 & 2033
- Table 12: Global Glass Fiber Reinforced Cable Trays and Ladders Volume K Forecast, by Country 2020 & 2033
- Table 13: United States Glass Fiber Reinforced Cable Trays and Ladders Revenue (million) Forecast, by Application 2020 & 2033
- Table 14: United States Glass Fiber Reinforced Cable Trays and Ladders Volume (K) Forecast, by Application 2020 & 2033
- Table 15: Canada Glass Fiber Reinforced Cable Trays and Ladders Revenue (million) Forecast, by Application 2020 & 2033
- Table 16: Canada Glass Fiber Reinforced Cable Trays and Ladders Volume (K) Forecast, by Application 2020 & 2033
- Table 17: Mexico Glass Fiber Reinforced Cable Trays and Ladders Revenue (million) Forecast, by Application 2020 & 2033
- Table 18: Mexico Glass Fiber Reinforced Cable Trays and Ladders Volume (K) Forecast, by Application 2020 & 2033
- Table 19: Global Glass Fiber Reinforced Cable Trays and Ladders Revenue million Forecast, by Application 2020 & 2033
- Table 20: Global Glass Fiber Reinforced Cable Trays and Ladders Volume K Forecast, by Application 2020 & 2033
- Table 21: Global Glass Fiber Reinforced Cable Trays and Ladders Revenue million Forecast, by Types 2020 & 2033
- Table 22: Global Glass Fiber Reinforced Cable Trays and Ladders Volume K Forecast, by Types 2020 & 2033
- Table 23: Global Glass Fiber Reinforced Cable Trays and Ladders Revenue million Forecast, by Country 2020 & 2033
- Table 24: Global Glass Fiber Reinforced Cable Trays and Ladders Volume K Forecast, by Country 2020 & 2033
- Table 25: Brazil Glass Fiber Reinforced Cable Trays and Ladders Revenue (million) Forecast, by Application 2020 & 2033
- Table 26: Brazil Glass Fiber Reinforced Cable Trays and Ladders Volume (K) Forecast, by Application 2020 & 2033
- Table 27: Argentina Glass Fiber Reinforced Cable Trays and Ladders Revenue (million) Forecast, by Application 2020 & 2033
- Table 28: Argentina Glass Fiber Reinforced Cable Trays and Ladders Volume (K) Forecast, by Application 2020 & 2033
- Table 29: Rest of South America Glass Fiber Reinforced Cable Trays and Ladders Revenue (million) Forecast, by Application 2020 & 2033
- Table 30: Rest of South America Glass Fiber Reinforced Cable Trays and Ladders Volume (K) Forecast, by Application 2020 & 2033
- Table 31: Global Glass Fiber Reinforced Cable Trays and Ladders Revenue million Forecast, by Application 2020 & 2033
- Table 32: Global Glass Fiber Reinforced Cable Trays and Ladders Volume K Forecast, by Application 2020 & 2033
- Table 33: Global Glass Fiber Reinforced Cable Trays and Ladders Revenue million Forecast, by Types 2020 & 2033
- Table 34: Global Glass Fiber Reinforced Cable Trays and Ladders Volume K Forecast, by Types 2020 & 2033
- Table 35: Global Glass Fiber Reinforced Cable Trays and Ladders Revenue million Forecast, by Country 2020 & 2033
- Table 36: Global Glass Fiber Reinforced Cable Trays and Ladders Volume K Forecast, by Country 2020 & 2033
- Table 37: United Kingdom Glass Fiber Reinforced Cable Trays and Ladders Revenue (million) Forecast, by Application 2020 & 2033
- Table 38: United Kingdom Glass Fiber Reinforced Cable Trays and Ladders Volume (K) Forecast, by Application 2020 & 2033
- Table 39: Germany Glass Fiber Reinforced Cable Trays and Ladders Revenue (million) Forecast, by Application 2020 & 2033
- Table 40: Germany Glass Fiber Reinforced Cable Trays and Ladders Volume (K) Forecast, by Application 2020 & 2033
- Table 41: France Glass Fiber Reinforced Cable Trays and Ladders Revenue (million) Forecast, by Application 2020 & 2033
- Table 42: France Glass Fiber Reinforced Cable Trays and Ladders Volume (K) Forecast, by Application 2020 & 2033
- Table 43: Italy Glass Fiber Reinforced Cable Trays and Ladders Revenue (million) Forecast, by Application 2020 & 2033
- Table 44: Italy Glass Fiber Reinforced Cable Trays and Ladders Volume (K) Forecast, by Application 2020 & 2033
- Table 45: Spain Glass Fiber Reinforced Cable Trays and Ladders Revenue (million) Forecast, by Application 2020 & 2033
- Table 46: Spain Glass Fiber Reinforced Cable Trays and Ladders Volume (K) Forecast, by Application 2020 & 2033
- Table 47: Russia Glass Fiber Reinforced Cable Trays and Ladders Revenue (million) Forecast, by Application 2020 & 2033
- Table 48: Russia Glass Fiber Reinforced Cable Trays and Ladders Volume (K) Forecast, by Application 2020 & 2033
- Table 49: Benelux Glass Fiber Reinforced Cable Trays and Ladders Revenue (million) Forecast, by Application 2020 & 2033
- Table 50: Benelux Glass Fiber Reinforced Cable Trays and Ladders Volume (K) Forecast, by Application 2020 & 2033
- Table 51: Nordics Glass Fiber Reinforced Cable Trays and Ladders Revenue (million) Forecast, by Application 2020 & 2033
- Table 52: Nordics Glass Fiber Reinforced Cable Trays and Ladders Volume (K) Forecast, by Application 2020 & 2033
- Table 53: Rest of Europe Glass Fiber Reinforced Cable Trays and Ladders Revenue (million) Forecast, by Application 2020 & 2033
- Table 54: Rest of Europe Glass Fiber Reinforced Cable Trays and Ladders Volume (K) Forecast, by Application 2020 & 2033
- Table 55: Global Glass Fiber Reinforced Cable Trays and Ladders Revenue million Forecast, by Application 2020 & 2033
- Table 56: Global Glass Fiber Reinforced Cable Trays and Ladders Volume K Forecast, by Application 2020 & 2033
- Table 57: Global Glass Fiber Reinforced Cable Trays and Ladders Revenue million Forecast, by Types 2020 & 2033
- Table 58: Global Glass Fiber Reinforced Cable Trays and Ladders Volume K Forecast, by Types 2020 & 2033
- Table 59: Global Glass Fiber Reinforced Cable Trays and Ladders Revenue million Forecast, by Country 2020 & 2033
- Table 60: Global Glass Fiber Reinforced Cable Trays and Ladders Volume K Forecast, by Country 2020 & 2033
- Table 61: Turkey Glass Fiber Reinforced Cable Trays and Ladders Revenue (million) Forecast, by Application 2020 & 2033
- Table 62: Turkey Glass Fiber Reinforced Cable Trays and Ladders Volume (K) Forecast, by Application 2020 & 2033
- Table 63: Israel Glass Fiber Reinforced Cable Trays and Ladders Revenue (million) Forecast, by Application 2020 & 2033
- Table 64: Israel Glass Fiber Reinforced Cable Trays and Ladders Volume (K) Forecast, by Application 2020 & 2033
- Table 65: GCC Glass Fiber Reinforced Cable Trays and Ladders Revenue (million) Forecast, by Application 2020 & 2033
- Table 66: GCC Glass Fiber Reinforced Cable Trays and Ladders Volume (K) Forecast, by Application 2020 & 2033
- Table 67: North Africa Glass Fiber Reinforced Cable Trays and Ladders Revenue (million) Forecast, by Application 2020 & 2033
- Table 68: North Africa Glass Fiber Reinforced Cable Trays and Ladders Volume (K) Forecast, by Application 2020 & 2033
- Table 69: South Africa Glass Fiber Reinforced Cable Trays and Ladders Revenue (million) Forecast, by Application 2020 & 2033
- Table 70: South Africa Glass Fiber Reinforced Cable Trays and Ladders Volume (K) Forecast, by Application 2020 & 2033
- Table 71: Rest of Middle East & Africa Glass Fiber Reinforced Cable Trays and Ladders Revenue (million) Forecast, by Application 2020 & 2033
- Table 72: Rest of Middle East & Africa Glass Fiber Reinforced Cable Trays and Ladders Volume (K) Forecast, by Application 2020 & 2033
- Table 73: Global Glass Fiber Reinforced Cable Trays and Ladders Revenue million Forecast, by Application 2020 & 2033
- Table 74: Global Glass Fiber Reinforced Cable Trays and Ladders Volume K Forecast, by Application 2020 & 2033
- Table 75: Global Glass Fiber Reinforced Cable Trays and Ladders Revenue million Forecast, by Types 2020 & 2033
- Table 76: Global Glass Fiber Reinforced Cable Trays and Ladders Volume K Forecast, by Types 2020 & 2033
- Table 77: Global Glass Fiber Reinforced Cable Trays and Ladders Revenue million Forecast, by Country 2020 & 2033
- Table 78: Global Glass Fiber Reinforced Cable Trays and Ladders Volume K Forecast, by Country 2020 & 2033
- Table 79: China Glass Fiber Reinforced Cable Trays and Ladders Revenue (million) Forecast, by Application 2020 & 2033
- Table 80: China Glass Fiber Reinforced Cable Trays and Ladders Volume (K) Forecast, by Application 2020 & 2033
- Table 81: India Glass Fiber Reinforced Cable Trays and Ladders Revenue (million) Forecast, by Application 2020 & 2033
- Table 82: India Glass Fiber Reinforced Cable Trays and Ladders Volume (K) Forecast, by Application 2020 & 2033
- Table 83: Japan Glass Fiber Reinforced Cable Trays and Ladders Revenue (million) Forecast, by Application 2020 & 2033
- Table 84: Japan Glass Fiber Reinforced Cable Trays and Ladders Volume (K) Forecast, by Application 2020 & 2033
- Table 85: South Korea Glass Fiber Reinforced Cable Trays and Ladders Revenue (million) Forecast, by Application 2020 & 2033
- Table 86: South Korea Glass Fiber Reinforced Cable Trays and Ladders Volume (K) Forecast, by Application 2020 & 2033
- Table 87: ASEAN Glass Fiber Reinforced Cable Trays and Ladders Revenue (million) Forecast, by Application 2020 & 2033
- Table 88: ASEAN Glass Fiber Reinforced Cable Trays and Ladders Volume (K) Forecast, by Application 2020 & 2033
- Table 89: Oceania Glass Fiber Reinforced Cable Trays and Ladders Revenue (million) Forecast, by Application 2020 & 2033
- Table 90: Oceania Glass Fiber Reinforced Cable Trays and Ladders Volume (K) Forecast, by Application 2020 & 2033
- Table 91: Rest of Asia Pacific Glass Fiber Reinforced Cable Trays and Ladders Revenue (million) Forecast, by Application 2020 & 2033
- Table 92: Rest of Asia Pacific Glass Fiber Reinforced Cable Trays and Ladders Volume (K) Forecast, by Application 2020 & 2033
Frequently Asked Questions
1. What is the projected Compound Annual Growth Rate (CAGR) of the Glass Fiber Reinforced Cable Trays and Ladders?
The projected CAGR is approximately 8%.
2. Which companies are prominent players in the Glass Fiber Reinforced Cable Trays and Ladders?
Key companies in the market include Oglaend (Hilti), Eaton, Indiana, Atkore, Korvest, Treadwell, Niedax, Thomas & Betts (ABB), Unitech, Storskogen, Real Safety, MP Husky, Omkar Composites Pvt ltd, Sharda Cable Trays Pvt. Ltd., Ferrotech Structurals, Fiber Tech Composite Private Limited, Fibex, EPP Composites, ERCON Composites, Hebei Longxin, Jiansu Huapeng, Hebei Chuangye, Zhenjiang Shenlong, King Sitong, Legrand.
3. What are the main segments of the Glass Fiber Reinforced Cable Trays and Ladders?
The market segments include Application, Types.
4. Can you provide details about the market size?
The market size is estimated to be USD 762 million as of 2022.
5. What are some drivers contributing to market growth?
N/A
6. What are the notable trends driving market growth?
N/A
7. Are there any restraints impacting market growth?
N/A
8. Can you provide examples of recent developments in the market?
N/A
9. What pricing options are available for accessing the report?
Pricing options include single-user, multi-user, and enterprise licenses priced at USD 4350.00, USD 6525.00, and USD 8700.00 respectively.
10. Is the market size provided in terms of value or volume?
The market size is provided in terms of value, measured in million and volume, measured in K.
11. Are there any specific market keywords associated with the report?
Yes, the market keyword associated with the report is "Glass Fiber Reinforced Cable Trays and Ladders," which aids in identifying and referencing the specific market segment covered.
12. How do I determine which pricing option suits my needs best?
The pricing options vary based on user requirements and access needs. Individual users may opt for single-user licenses, while businesses requiring broader access may choose multi-user or enterprise licenses for cost-effective access to the report.
13. Are there any additional resources or data provided in the Glass Fiber Reinforced Cable Trays and Ladders report?
While the report offers comprehensive insights, it's advisable to review the specific contents or supplementary materials provided to ascertain if additional resources or data are available.
14. How can I stay updated on further developments or reports in the Glass Fiber Reinforced Cable Trays and Ladders?
To stay informed about further developments, trends, and reports in the Glass Fiber Reinforced Cable Trays and Ladders, consider subscribing to industry newsletters, following relevant companies and organizations, or regularly checking reputable industry news sources and publications.
Methodology
Step 1 - Identification of Relevant Samples Size from Population Database


Step 2 - Approaches for Defining Global Market Size (Value, Volume* & Price*)

Note*: In applicable scenarios
Step 3 - Data Sources
Primary Research
- Web Analytics
- Survey Reports
- Research Institute
- Latest Research Reports
- Opinion Leaders
Secondary Research
- Annual Reports
- White Paper
- Latest Press Release
- Industry Association
- Paid Database
- Investor Presentations

Step 4 - Data Triangulation
Involves using different sources of information in order to increase the validity of a study
These sources are likely to be stakeholders in a program - participants, other researchers, program staff, other community members, and so on.
Then we put all data in single framework & apply various statistical tools to find out the dynamic on the market.
During the analysis stage, feedback from the stakeholder groups would be compared to determine areas of agreement as well as areas of divergence