

Key Insights
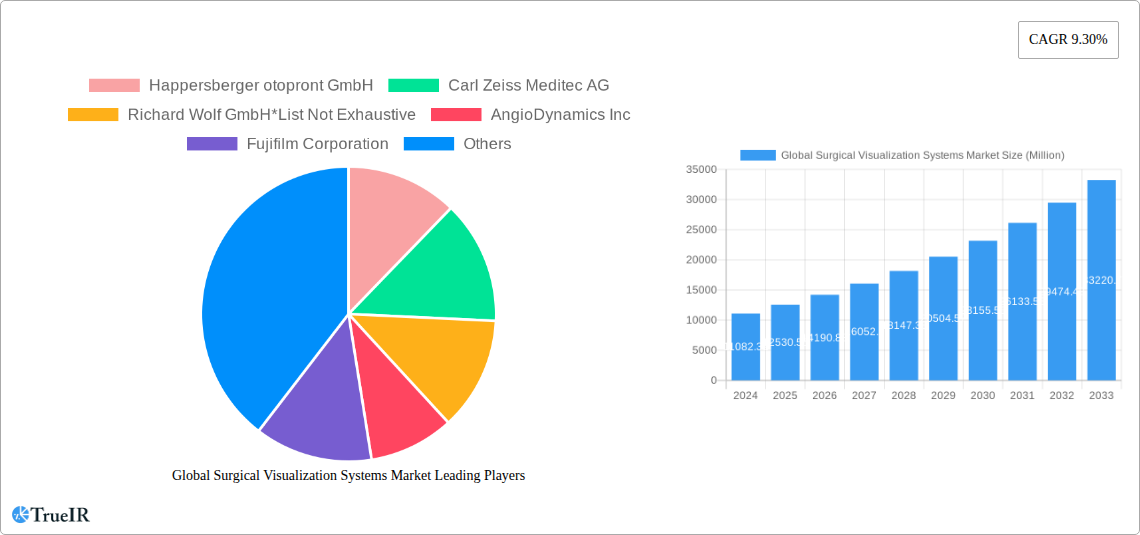
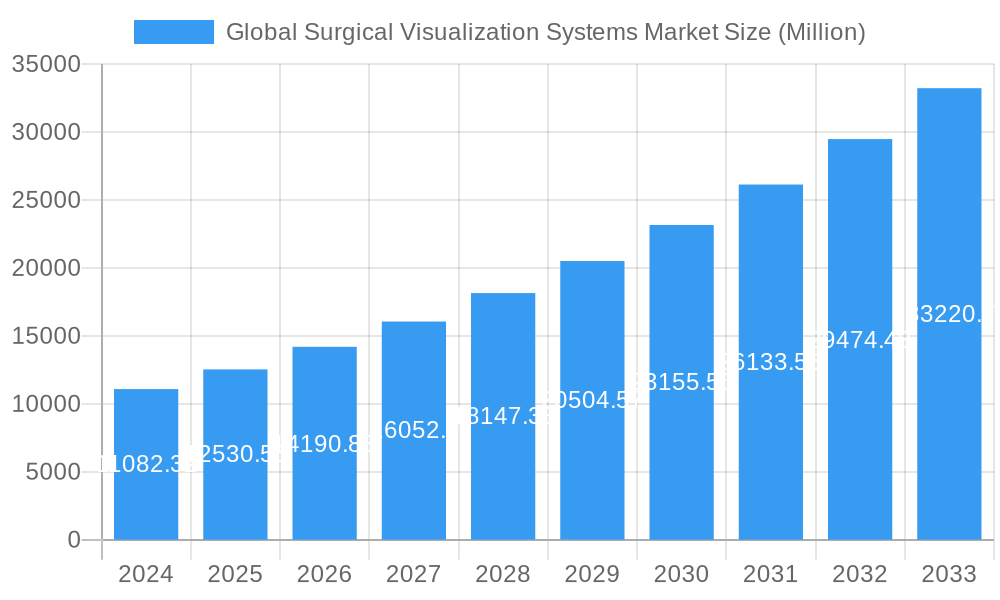
The global Surgical Visualization Systems market is experiencing robust expansion, projected to reach an estimated $11,082.32 million in 2024. This growth is propelled by a significant Compound Annual Growth Rate (CAGR) of 13.21% over the forecast period. A key driver for this surge is the increasing adoption of minimally invasive surgical techniques, which inherently rely on advanced visualization to enhance precision, reduce patient trauma, and accelerate recovery times. The rising prevalence of chronic diseases and the growing demand for sophisticated diagnostic and therapeutic procedures are further bolstering market demand. Innovations in imaging technology, such as the integration of artificial intelligence and high-definition optics, are continuously improving the capabilities of these systems, making them indispensable in modern surgical settings. Furthermore, the expanding healthcare infrastructure, particularly in emerging economies, is creating new avenues for market penetration.
Global Surgical Visualization Systems Market Market Size (In Billion)
The market's dynamism is further reflected in its diverse segmentation. The Product segment is led by Endoscopic Cameras and Displays & Monitors, critical components for delivering high-fidelity surgical views. In terms of Application, Gastroscopy and Colonoscopy represent substantial market shares due to the widespread need for gastrointestinal diagnostics and interventions. Hospitals are the dominant End-Users, owing to their comprehensive surgical facilities and high patient volumes. Geographically, North America and Europe currently hold significant market positions, driven by advanced healthcare systems and early adoption of new technologies. However, the Asia Pacific region is anticipated to witness the fastest growth, fueled by a large patient pool, increasing healthcare expenditure, and a growing number of skilled surgeons embracing advanced visualization tools. The competitive landscape features prominent players like Olympus Corporation, Karl Storz GmbH & Co Kg, and Carl Zeiss Meditec AG, continuously innovating to meet the evolving demands of the surgical visualization arena.
Global Surgical Visualization Systems Market Company Market Share
This report provides an in-depth analysis of the global surgical visualization systems market, offering critical insights into market dynamics, key trends, competitive landscapes, and future growth trajectories. Covering the study period from 2019 to 2033, with a base year of 2025, this comprehensive report is an indispensable resource for stakeholders seeking to understand and capitalize on the evolving surgical imaging solutions market. We delve into the endoscopic camera market, surgical display market, and video endoscopy systems, exploring their interconnected growth.
Global Surgical Visualization Systems Market Market Structure & Competitive Landscape
The surgical visualization systems market is characterized by a moderate to high degree of concentration, with a blend of established global players and emerging regional innovators. Innovation drivers are primarily fueled by the demand for enhanced diagnostic accuracy, minimally invasive procedures, and improved patient outcomes. Key technological advancements in medical imaging technology and digital endoscopy are reshaping the competitive landscape. Regulatory impacts, such as stringent FDA and CE marking approvals, play a significant role in market entry and product development. Product substitutes, while present in the form of older technologies or manual inspection methods, are increasingly being displaced by advanced visualization systems. End-user segmentation reveals a strong reliance on hospital surgical departments and an increasing adoption in diagnostic imaging centers. Mergers and acquisitions (M&A) are a consistent trend, with surgical visualization companies consolidating to expand product portfolios, gain market share, and achieve economies of scale. For instance, recent M&A activities in the surgical optics and medical video systems sector have bolstered the offerings of leading organizations. Over the historical period (2019-2024), the surgical visualization devices market has witnessed an estimated XX number of significant M&A transactions, underscoring the dynamic nature of this sector.
Global Surgical Visualization Systems Market Market Trends & Opportunities
The global surgical visualization systems market is poised for substantial growth, driven by a confluence of technological advancements, increasing demand for minimally invasive surgeries, and a rising prevalence of chronic diseases requiring diagnostic and therapeutic interventions. The market size is projected to expand from an estimated $XX million in 2025 to $XX million by 2033, exhibiting a robust Compound Annual Growth Rate (CAGR) of XX% during the forecast period. Technological shifts are central to this growth, with a notable trend towards high-definition (HD) and ultra-high-definition (UHD) imaging, 4K displays, augmented reality (AR) integration, and wireless endoscopic solutions. These innovations offer surgeons enhanced visualization, improved precision, and reduced procedure times, directly impacting patient recovery and overall healthcare costs.
Consumer preferences are increasingly leaning towards minimally invasive surgical techniques, which inherently necessitate advanced visualization systems for accurate navigation and real-time feedback. This preference is further amplified by growing patient awareness and a desire for faster recovery and reduced scarring. The competitive dynamics within the market are characterized by intense product development, strategic partnerships, and aggressive market penetration strategies by key players. The introduction of AI-powered surgical visualization tools is an emerging trend, promising to revolutionize diagnostic capabilities and treatment planning. Opportunities abound in the development of integrated surgical suites, cloud-based data management solutions for surgical imaging, and the expansion of these technologies into emerging economies with improving healthcare infrastructure. The increasing adoption of robotic surgery also presents a synergistic opportunity, as these platforms heavily rely on sophisticated visualization systems for optimal performance. Furthermore, the growing emphasis on preventative care and early disease detection fuels the demand for advanced endoscopic visualization equipment in routine screening procedures. The market penetration rate for advanced surgical visualization systems is expected to rise from approximately XX% in 2025 to XX% by 2033, indicating a significant untapped potential.
Dominant Markets & Segments in Global Surgical Visualization Systems Market
The global surgical visualization systems market is segmented across various product types, applications, and end-users, each contributing to the overall market dominance.
Product Segment Dominance:
- Displays and Monitors: This segment currently holds the largest market share, driven by the increasing demand for high-resolution, large-format displays essential for detailed surgical visualization. The market is experiencing a rapid shift towards 4K and OLED technologies, offering superior contrast and color accuracy.
- Endoscopic Cameras: As the core component of endoscopic procedures, these cameras are witnessing significant innovation, particularly in miniaturization, wireless capabilities, and enhanced imaging sensors. The rising volume of endoscopic procedures globally directly fuels the growth of this segment.
- Light Sources: While often considered a supporting product, advanced LED and Xenon light sources are crucial for optimal illumination in surgical fields, contributing to diagnostic clarity and procedural safety.
Application Segment Dominance:
- Endoscopy: This broad application encompasses various diagnostic and therapeutic procedures, making it the leading segment. The increasing prevalence of gastrointestinal disorders, respiratory conditions, and urological issues drives the demand for endoscopic visualization systems.
- Colonoscopy: As a critical tool for colorectal cancer screening and diagnosis, colonoscopy represents a substantial and growing application within the endoscopy segment. Favorable government initiatives and public health campaigns for cancer screening are key growth drivers.
- Gastroscopy: Similar to colonoscopy, gastroscopy is vital for diagnosing and treating upper gastrointestinal conditions, contributing significantly to the application segment's dominance.
End-User Segment Dominance:
- Hospitals: As the primary healthcare providers, hospitals constitute the largest end-user segment. Their comprehensive surgical departments, equipped with advanced medical technology, are major consumers of surgical visualization systems. The increasing investment in state-of-the-art infrastructure by hospitals globally is a key growth catalyst.
- Diagnostic Imaging Centers: These centers are increasingly adopting advanced visualization technologies for specialized diagnostic procedures, contributing to market expansion. The growing trend of outsourcing diagnostic services from hospitals also benefits this segment.
Geographically, North America currently dominates the market, attributed to its advanced healthcare infrastructure, high adoption rate of new technologies, and significant R&D investments. Europe follows closely, with strong regulatory support and a well-established medical device industry. Emerging markets in Asia Pacific are witnessing the fastest growth due to increasing healthcare expenditure, a rising burden of chronic diseases, and government initiatives to improve healthcare access and quality. Factors such as increased government funding for healthcare, favorable reimbursement policies for minimally invasive procedures, and the development of advanced medical tourism hubs are fueling market dominance in these regions.
Global Surgical Visualization Systems Market Product Analysis
The surgical visualization systems market is defined by continuous product innovation. Endoscopic cameras are evolving towards smaller footprints, higher resolution (4K, 8K), and integrated artificial intelligence for image enhancement and diagnostic assistance. Light sources are becoming more efficient with LED technology, offering better color rendition and reduced heat output. Displays and monitors are prioritizing larger screen sizes, superior contrast ratios, and touch-screen functionalities for enhanced user interaction. Video recorders are adapting to higher data storage needs and seamless integration with PACS (Picture Archiving and Communication Systems). The competitive advantage lies in developing integrated systems that offer a holistic visualization experience, from image capture to data management, while ensuring user-friendliness and procedural efficiency.
Key Drivers, Barriers & Challenges in Global Surgical Visualization Systems Market
The global surgical visualization systems market is propelled by several key drivers. Technologically, the ongoing advancements in imaging resolution (HD, 4K, 8K), miniaturization of components, and the integration of AI and AR are significantly enhancing surgical precision and diagnostic capabilities. Economically, rising healthcare expenditure globally, coupled with an increasing demand for minimally invasive procedures that lead to shorter hospital stays and reduced patient costs, fuels market growth. Policy-driven factors, such as government initiatives promoting early disease detection and the adoption of advanced medical technologies, also play a crucial role. For example, widespread screening programs for gastrointestinal cancers directly boost the demand for endoscopic visualization systems.
However, the market also faces significant challenges and restraints. Supply chain issues, exacerbated by global events, can lead to production delays and increased component costs. Regulatory hurdles, including lengthy and complex approval processes for new medical devices in different regions, can hinder market entry and product launches. Competitive pressures from both established players and new entrants drive down profit margins, necessitating continuous innovation and cost optimization. The high initial investment cost for advanced surgical visualization systems can also be a barrier, particularly for smaller healthcare facilities or in developing economies.
Growth Drivers in the Global Surgical Visualization Systems Market Market
The global surgical visualization systems market is experiencing robust growth driven by several critical factors. Technologically, the relentless pursuit of higher imaging resolution, miniaturization of endoscopic devices, and the integration of artificial intelligence (AI) and augmented reality (AR) are enhancing surgical precision and enabling more complex minimally invasive procedures. Economically, rising global healthcare expenditure, coupled with a growing preference for minimally invasive surgeries that offer faster recovery times and reduced patient costs, is a significant impetus. Policy-driven initiatives, such as government support for technological adoption in healthcare and the expansion of screening programs for various diseases, further stimulate demand. For instance, the increasing focus on early cancer detection globally translates directly into a higher demand for advanced endoscopic visualization systems.
Challenges Impacting Global Surgical Visualization Systems Market Growth
The global surgical visualization systems market faces several key challenges that can impact its growth trajectory. Regulatory complexities, including the varied and often stringent approval processes across different countries for medical devices, can lead to delays and increased costs for market entry. Supply chain disruptions, as witnessed in recent years, pose a significant risk, potentially impacting production schedules and the availability of critical components. Competitive pressures are intense, with numerous established players and emerging companies vying for market share, which can lead to price erosion and necessitate significant investment in R&D. Furthermore, the high initial capital investment required for advanced visualization systems can be a barrier for some healthcare institutions, particularly in price-sensitive markets.
Key Players Shaping the Global Surgical Visualization Systems Market Market
- Happersberger otopront GmbH
- Carl Zeiss Meditec AG
- Richard Wolf GmbH
- AngioDynamics Inc
- Fujifilm Corporation
- Cardinal Health
- Laborie Inc
- Conmed Corporation
- Stryker Corporation
- Acutronic Medical Systems AG
- Karl Storz GmbH & Co Kg
- Olympus Corporation
Significant Global Surgical Visualization Systems Market Industry Milestones
- March 2022: Endoluxe launches the high-definition, wireless endoscopic camera, TowerTech. TowerTech provides the complete functionality of legacy endoscopy video platforms, all built into the camera head, enhancing portability and ease of use.
- February 2022: Ambu launched the 510(k) regulatory clearance of the Ambu aScope Gastro and Ambu aBox 2 in the United States. aScope Gastro is Ambu's sterile, single-use gastroscope that includes new advanced imaging and design features in a combined solution with next-generation display and processor technology, promoting infection control and improved diagnostic capabilities.
Future Outlook for Global Surgical Visualization Systems Market Market
The future outlook for the global surgical visualization systems market remains exceptionally bright, driven by sustained innovation and increasing adoption across diverse medical specialties. Strategic opportunities lie in the development of interoperable systems that facilitate seamless data integration and workflow efficiency. The market is expected to witness significant growth catalysts from the continued expansion of minimally invasive surgery, the increasing demand for remote surgical training and telementoring capabilities, and the growing integration of AI for predictive analytics and enhanced surgical guidance. The potential for further advancements in robotic surgery integration and the development of novel visualization techniques for niche surgical applications presents substantial market potential.
Global Surgical Visualization Systems Market Segmentation
-
1. Product
- 1.1. Endoscopic Cameras
- 1.2. Light Sources
- 1.3. Displays and Monitors
- 1.4. Video Recorders
- 1.5. Accessories
-
2. Application
- 2.1. Gastroscopy
- 2.2. Colonoscopy
- 2.3. Endoscopy
- 2.4. Other Applications
-
3. End-Users
- 3.1. Hospitals
- 3.2. Diagnostic Imaging Centers
- 3.3. Other End-Users
Global Surgical Visualization Systems Market Segmentation By Geography
-
1. North America
- 1.1. United States
- 1.2. Canada
- 1.3. Mexico
-
2. Europe
- 2.1. Germany
- 2.2. United Kingdom
- 2.3. France
- 2.4. Italy
- 2.5. Spain
- 2.6. Rest of Europe
-
3. Asia Pacific
- 3.1. China
- 3.2. Japan
- 3.3. India
- 3.4. Australia
- 3.5. South Korea
- 3.6. Rest of Asia Pacific
-
4. Middle East and Africa
- 4.1. GCC
- 4.2. South Africa
- 4.3. Rest of Middle East and Africa
-
5. South America
- 5.1. Brazil
- 5.2. Argentina
- 5.3. Rest of South America
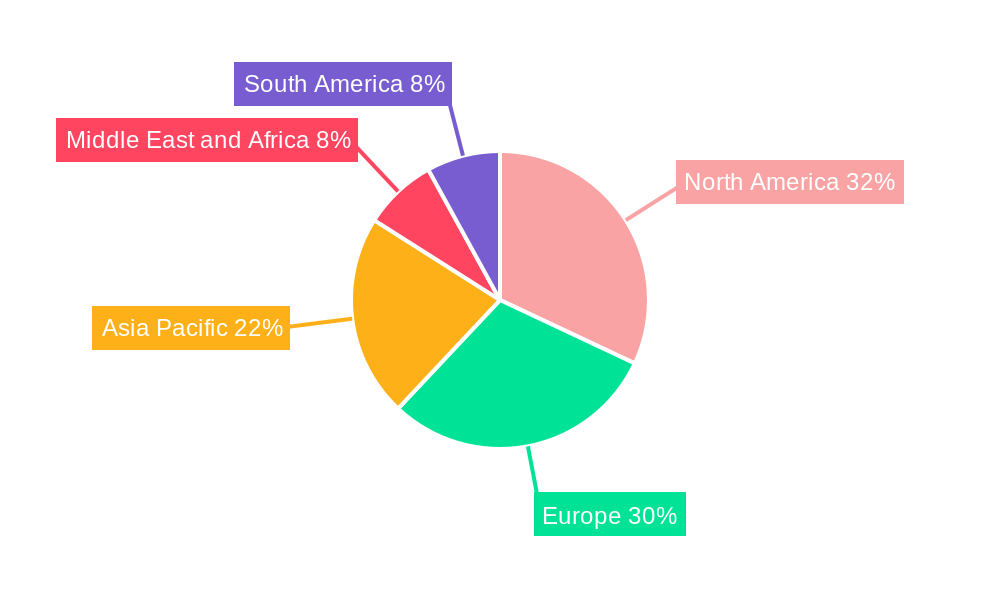
Global Surgical Visualization Systems Market Regional Market Share
Geographic Coverage of Global Surgical Visualization Systems Market
Global Surgical Visualization Systems Market REPORT HIGHLIGHTS
| Aspects | Details |
|---|---|
| Study Period | 2020-2034 |
| Base Year | 2025 |
| Estimated Year | 2026 |
| Forecast Period | 2026-2034 |
| Historical Period | 2020-2025 |
| Growth Rate | CAGR of 13.21% from 2020-2034 |
| Segmentation |
|
Table of Contents
- 1. Introduction
- 1.1. Research Scope
- 1.2. Market Segmentation
- 1.3. Research Methodology
- 1.4. Definitions and Assumptions
- 2. Executive Summary
- 2.1. Introduction
- 3. Market Dynamics
- 3.1. Introduction
- 3.2. Market Drivers
- 3.2.1. Increasing Prevalence of Chronic Diseases; Technological Advancements in the Devices
- 3.3. Market Restrains
- 3.3.1. High Cost of Endoscopy Procedures
- 3.4. Market Trends
- 3.4.1. Colonoscopy Segment is Expected to Witness a Significant Growth Over the Forecast Period.
- 4. Market Factor Analysis
- 4.1. Porters Five Forces
- 4.2. Supply/Value Chain
- 4.3. PESTEL analysis
- 4.4. Market Entropy
- 4.5. Patent/Trademark Analysis
- 5. Global Surgical Visualization Systems Market Analysis, Insights and Forecast, 2020-2032
- 5.1. Market Analysis, Insights and Forecast - by Product
- 5.1.1. Endoscopic Cameras
- 5.1.2. Light Sources
- 5.1.3. Displays and Monitors
- 5.1.4. Video Recorders
- 5.1.5. Accessories
- 5.2. Market Analysis, Insights and Forecast - by Application
- 5.2.1. Gastroscopy
- 5.2.2. Colonoscopy
- 5.2.3. Endoscopy
- 5.2.4. Other Applications
- 5.3. Market Analysis, Insights and Forecast - by End-Users
- 5.3.1. Hospitals
- 5.3.2. Diagnostic Imaging Centers
- 5.3.3. Other End-Users
- 5.4. Market Analysis, Insights and Forecast - by Region
- 5.4.1. North America
- 5.4.2. Europe
- 5.4.3. Asia Pacific
- 5.4.4. Middle East and Africa
- 5.4.5. South America
- 5.1. Market Analysis, Insights and Forecast - by Product
- 6. North America Global Surgical Visualization Systems Market Analysis, Insights and Forecast, 2020-2032
- 6.1. Market Analysis, Insights and Forecast - by Product
- 6.1.1. Endoscopic Cameras
- 6.1.2. Light Sources
- 6.1.3. Displays and Monitors
- 6.1.4. Video Recorders
- 6.1.5. Accessories
- 6.2. Market Analysis, Insights and Forecast - by Application
- 6.2.1. Gastroscopy
- 6.2.2. Colonoscopy
- 6.2.3. Endoscopy
- 6.2.4. Other Applications
- 6.3. Market Analysis, Insights and Forecast - by End-Users
- 6.3.1. Hospitals
- 6.3.2. Diagnostic Imaging Centers
- 6.3.3. Other End-Users
- 6.1. Market Analysis, Insights and Forecast - by Product
- 7. Europe Global Surgical Visualization Systems Market Analysis, Insights and Forecast, 2020-2032
- 7.1. Market Analysis, Insights and Forecast - by Product
- 7.1.1. Endoscopic Cameras
- 7.1.2. Light Sources
- 7.1.3. Displays and Monitors
- 7.1.4. Video Recorders
- 7.1.5. Accessories
- 7.2. Market Analysis, Insights and Forecast - by Application
- 7.2.1. Gastroscopy
- 7.2.2. Colonoscopy
- 7.2.3. Endoscopy
- 7.2.4. Other Applications
- 7.3. Market Analysis, Insights and Forecast - by End-Users
- 7.3.1. Hospitals
- 7.3.2. Diagnostic Imaging Centers
- 7.3.3. Other End-Users
- 7.1. Market Analysis, Insights and Forecast - by Product
- 8. Asia Pacific Global Surgical Visualization Systems Market Analysis, Insights and Forecast, 2020-2032
- 8.1. Market Analysis, Insights and Forecast - by Product
- 8.1.1. Endoscopic Cameras
- 8.1.2. Light Sources
- 8.1.3. Displays and Monitors
- 8.1.4. Video Recorders
- 8.1.5. Accessories
- 8.2. Market Analysis, Insights and Forecast - by Application
- 8.2.1. Gastroscopy
- 8.2.2. Colonoscopy
- 8.2.3. Endoscopy
- 8.2.4. Other Applications
- 8.3. Market Analysis, Insights and Forecast - by End-Users
- 8.3.1. Hospitals
- 8.3.2. Diagnostic Imaging Centers
- 8.3.3. Other End-Users
- 8.1. Market Analysis, Insights and Forecast - by Product
- 9. Middle East and Africa Global Surgical Visualization Systems Market Analysis, Insights and Forecast, 2020-2032
- 9.1. Market Analysis, Insights and Forecast - by Product
- 9.1.1. Endoscopic Cameras
- 9.1.2. Light Sources
- 9.1.3. Displays and Monitors
- 9.1.4. Video Recorders
- 9.1.5. Accessories
- 9.2. Market Analysis, Insights and Forecast - by Application
- 9.2.1. Gastroscopy
- 9.2.2. Colonoscopy
- 9.2.3. Endoscopy
- 9.2.4. Other Applications
- 9.3. Market Analysis, Insights and Forecast - by End-Users
- 9.3.1. Hospitals
- 9.3.2. Diagnostic Imaging Centers
- 9.3.3. Other End-Users
- 9.1. Market Analysis, Insights and Forecast - by Product
- 10. South America Global Surgical Visualization Systems Market Analysis, Insights and Forecast, 2020-2032
- 10.1. Market Analysis, Insights and Forecast - by Product
- 10.1.1. Endoscopic Cameras
- 10.1.2. Light Sources
- 10.1.3. Displays and Monitors
- 10.1.4. Video Recorders
- 10.1.5. Accessories
- 10.2. Market Analysis, Insights and Forecast - by Application
- 10.2.1. Gastroscopy
- 10.2.2. Colonoscopy
- 10.2.3. Endoscopy
- 10.2.4. Other Applications
- 10.3. Market Analysis, Insights and Forecast - by End-Users
- 10.3.1. Hospitals
- 10.3.2. Diagnostic Imaging Centers
- 10.3.3. Other End-Users
- 10.1. Market Analysis, Insights and Forecast - by Product
- 11. Competitive Analysis
- 11.1. Market Share Analysis 2025
- 11.2. Company Profiles
- 11.2.1 Happersberger otopront GmbH
- 11.2.1.1. Overview
- 11.2.1.2. Products
- 11.2.1.3. SWOT Analysis
- 11.2.1.4. Recent Developments
- 11.2.1.5. Financials (Based on Availability)
- 11.2.2 Carl Zeiss Meditec AG
- 11.2.2.1. Overview
- 11.2.2.2. Products
- 11.2.2.3. SWOT Analysis
- 11.2.2.4. Recent Developments
- 11.2.2.5. Financials (Based on Availability)
- 11.2.3 Richard Wolf GmbH*List Not Exhaustive
- 11.2.3.1. Overview
- 11.2.3.2. Products
- 11.2.3.3. SWOT Analysis
- 11.2.3.4. Recent Developments
- 11.2.3.5. Financials (Based on Availability)
- 11.2.4 AngioDynamics Inc
- 11.2.4.1. Overview
- 11.2.4.2. Products
- 11.2.4.3. SWOT Analysis
- 11.2.4.4. Recent Developments
- 11.2.4.5. Financials (Based on Availability)
- 11.2.5 Fujifilm Corporation
- 11.2.5.1. Overview
- 11.2.5.2. Products
- 11.2.5.3. SWOT Analysis
- 11.2.5.4. Recent Developments
- 11.2.5.5. Financials (Based on Availability)
- 11.2.6 Cardinal Health
- 11.2.6.1. Overview
- 11.2.6.2. Products
- 11.2.6.3. SWOT Analysis
- 11.2.6.4. Recent Developments
- 11.2.6.5. Financials (Based on Availability)
- 11.2.7 Laborie Inc
- 11.2.7.1. Overview
- 11.2.7.2. Products
- 11.2.7.3. SWOT Analysis
- 11.2.7.4. Recent Developments
- 11.2.7.5. Financials (Based on Availability)
- 11.2.8 Conmed Corporation
- 11.2.8.1. Overview
- 11.2.8.2. Products
- 11.2.8.3. SWOT Analysis
- 11.2.8.4. Recent Developments
- 11.2.8.5. Financials (Based on Availability)
- 11.2.9 Stryker Corporation
- 11.2.9.1. Overview
- 11.2.9.2. Products
- 11.2.9.3. SWOT Analysis
- 11.2.9.4. Recent Developments
- 11.2.9.5. Financials (Based on Availability)
- 11.2.10 Acutronic Medical Systems AG
- 11.2.10.1. Overview
- 11.2.10.2. Products
- 11.2.10.3. SWOT Analysis
- 11.2.10.4. Recent Developments
- 11.2.10.5. Financials (Based on Availability)
- 11.2.11 Karl Storz GmbH & Co Kg
- 11.2.11.1. Overview
- 11.2.11.2. Products
- 11.2.11.3. SWOT Analysis
- 11.2.11.4. Recent Developments
- 11.2.11.5. Financials (Based on Availability)
- 11.2.12 Olympus Corporation
- 11.2.12.1. Overview
- 11.2.12.2. Products
- 11.2.12.3. SWOT Analysis
- 11.2.12.4. Recent Developments
- 11.2.12.5. Financials (Based on Availability)
- 11.2.1 Happersberger otopront GmbH
List of Figures
- Figure 1: Global Global Surgical Visualization Systems Market Revenue Breakdown (undefined, %) by Region 2025 & 2033
- Figure 2: North America Global Surgical Visualization Systems Market Revenue (undefined), by Product 2025 & 2033
- Figure 3: North America Global Surgical Visualization Systems Market Revenue Share (%), by Product 2025 & 2033
- Figure 4: North America Global Surgical Visualization Systems Market Revenue (undefined), by Application 2025 & 2033
- Figure 5: North America Global Surgical Visualization Systems Market Revenue Share (%), by Application 2025 & 2033
- Figure 6: North America Global Surgical Visualization Systems Market Revenue (undefined), by End-Users 2025 & 2033
- Figure 7: North America Global Surgical Visualization Systems Market Revenue Share (%), by End-Users 2025 & 2033
- Figure 8: North America Global Surgical Visualization Systems Market Revenue (undefined), by Country 2025 & 2033
- Figure 9: North America Global Surgical Visualization Systems Market Revenue Share (%), by Country 2025 & 2033
- Figure 10: Europe Global Surgical Visualization Systems Market Revenue (undefined), by Product 2025 & 2033
- Figure 11: Europe Global Surgical Visualization Systems Market Revenue Share (%), by Product 2025 & 2033
- Figure 12: Europe Global Surgical Visualization Systems Market Revenue (undefined), by Application 2025 & 2033
- Figure 13: Europe Global Surgical Visualization Systems Market Revenue Share (%), by Application 2025 & 2033
- Figure 14: Europe Global Surgical Visualization Systems Market Revenue (undefined), by End-Users 2025 & 2033
- Figure 15: Europe Global Surgical Visualization Systems Market Revenue Share (%), by End-Users 2025 & 2033
- Figure 16: Europe Global Surgical Visualization Systems Market Revenue (undefined), by Country 2025 & 2033
- Figure 17: Europe Global Surgical Visualization Systems Market Revenue Share (%), by Country 2025 & 2033
- Figure 18: Asia Pacific Global Surgical Visualization Systems Market Revenue (undefined), by Product 2025 & 2033
- Figure 19: Asia Pacific Global Surgical Visualization Systems Market Revenue Share (%), by Product 2025 & 2033
- Figure 20: Asia Pacific Global Surgical Visualization Systems Market Revenue (undefined), by Application 2025 & 2033
- Figure 21: Asia Pacific Global Surgical Visualization Systems Market Revenue Share (%), by Application 2025 & 2033
- Figure 22: Asia Pacific Global Surgical Visualization Systems Market Revenue (undefined), by End-Users 2025 & 2033
- Figure 23: Asia Pacific Global Surgical Visualization Systems Market Revenue Share (%), by End-Users 2025 & 2033
- Figure 24: Asia Pacific Global Surgical Visualization Systems Market Revenue (undefined), by Country 2025 & 2033
- Figure 25: Asia Pacific Global Surgical Visualization Systems Market Revenue Share (%), by Country 2025 & 2033
- Figure 26: Middle East and Africa Global Surgical Visualization Systems Market Revenue (undefined), by Product 2025 & 2033
- Figure 27: Middle East and Africa Global Surgical Visualization Systems Market Revenue Share (%), by Product 2025 & 2033
- Figure 28: Middle East and Africa Global Surgical Visualization Systems Market Revenue (undefined), by Application 2025 & 2033
- Figure 29: Middle East and Africa Global Surgical Visualization Systems Market Revenue Share (%), by Application 2025 & 2033
- Figure 30: Middle East and Africa Global Surgical Visualization Systems Market Revenue (undefined), by End-Users 2025 & 2033
- Figure 31: Middle East and Africa Global Surgical Visualization Systems Market Revenue Share (%), by End-Users 2025 & 2033
- Figure 32: Middle East and Africa Global Surgical Visualization Systems Market Revenue (undefined), by Country 2025 & 2033
- Figure 33: Middle East and Africa Global Surgical Visualization Systems Market Revenue Share (%), by Country 2025 & 2033
- Figure 34: South America Global Surgical Visualization Systems Market Revenue (undefined), by Product 2025 & 2033
- Figure 35: South America Global Surgical Visualization Systems Market Revenue Share (%), by Product 2025 & 2033
- Figure 36: South America Global Surgical Visualization Systems Market Revenue (undefined), by Application 2025 & 2033
- Figure 37: South America Global Surgical Visualization Systems Market Revenue Share (%), by Application 2025 & 2033
- Figure 38: South America Global Surgical Visualization Systems Market Revenue (undefined), by End-Users 2025 & 2033
- Figure 39: South America Global Surgical Visualization Systems Market Revenue Share (%), by End-Users 2025 & 2033
- Figure 40: South America Global Surgical Visualization Systems Market Revenue (undefined), by Country 2025 & 2033
- Figure 41: South America Global Surgical Visualization Systems Market Revenue Share (%), by Country 2025 & 2033
List of Tables
- Table 1: Global Surgical Visualization Systems Market Revenue undefined Forecast, by Product 2020 & 2033
- Table 2: Global Surgical Visualization Systems Market Revenue undefined Forecast, by Application 2020 & 2033
- Table 3: Global Surgical Visualization Systems Market Revenue undefined Forecast, by End-Users 2020 & 2033
- Table 4: Global Surgical Visualization Systems Market Revenue undefined Forecast, by Region 2020 & 2033
- Table 5: Global Surgical Visualization Systems Market Revenue undefined Forecast, by Product 2020 & 2033
- Table 6: Global Surgical Visualization Systems Market Revenue undefined Forecast, by Application 2020 & 2033
- Table 7: Global Surgical Visualization Systems Market Revenue undefined Forecast, by End-Users 2020 & 2033
- Table 8: Global Surgical Visualization Systems Market Revenue undefined Forecast, by Country 2020 & 2033
- Table 9: United States Global Surgical Visualization Systems Market Revenue (undefined) Forecast, by Application 2020 & 2033
- Table 10: Canada Global Surgical Visualization Systems Market Revenue (undefined) Forecast, by Application 2020 & 2033
- Table 11: Mexico Global Surgical Visualization Systems Market Revenue (undefined) Forecast, by Application 2020 & 2033
- Table 12: Global Surgical Visualization Systems Market Revenue undefined Forecast, by Product 2020 & 2033
- Table 13: Global Surgical Visualization Systems Market Revenue undefined Forecast, by Application 2020 & 2033
- Table 14: Global Surgical Visualization Systems Market Revenue undefined Forecast, by End-Users 2020 & 2033
- Table 15: Global Surgical Visualization Systems Market Revenue undefined Forecast, by Country 2020 & 2033
- Table 16: Germany Global Surgical Visualization Systems Market Revenue (undefined) Forecast, by Application 2020 & 2033
- Table 17: United Kingdom Global Surgical Visualization Systems Market Revenue (undefined) Forecast, by Application 2020 & 2033
- Table 18: France Global Surgical Visualization Systems Market Revenue (undefined) Forecast, by Application 2020 & 2033
- Table 19: Italy Global Surgical Visualization Systems Market Revenue (undefined) Forecast, by Application 2020 & 2033
- Table 20: Spain Global Surgical Visualization Systems Market Revenue (undefined) Forecast, by Application 2020 & 2033
- Table 21: Rest of Europe Global Surgical Visualization Systems Market Revenue (undefined) Forecast, by Application 2020 & 2033
- Table 22: Global Surgical Visualization Systems Market Revenue undefined Forecast, by Product 2020 & 2033
- Table 23: Global Surgical Visualization Systems Market Revenue undefined Forecast, by Application 2020 & 2033
- Table 24: Global Surgical Visualization Systems Market Revenue undefined Forecast, by End-Users 2020 & 2033
- Table 25: Global Surgical Visualization Systems Market Revenue undefined Forecast, by Country 2020 & 2033
- Table 26: China Global Surgical Visualization Systems Market Revenue (undefined) Forecast, by Application 2020 & 2033
- Table 27: Japan Global Surgical Visualization Systems Market Revenue (undefined) Forecast, by Application 2020 & 2033
- Table 28: India Global Surgical Visualization Systems Market Revenue (undefined) Forecast, by Application 2020 & 2033
- Table 29: Australia Global Surgical Visualization Systems Market Revenue (undefined) Forecast, by Application 2020 & 2033
- Table 30: South Korea Global Surgical Visualization Systems Market Revenue (undefined) Forecast, by Application 2020 & 2033
- Table 31: Rest of Asia Pacific Global Surgical Visualization Systems Market Revenue (undefined) Forecast, by Application 2020 & 2033
- Table 32: Global Surgical Visualization Systems Market Revenue undefined Forecast, by Product 2020 & 2033
- Table 33: Global Surgical Visualization Systems Market Revenue undefined Forecast, by Application 2020 & 2033
- Table 34: Global Surgical Visualization Systems Market Revenue undefined Forecast, by End-Users 2020 & 2033
- Table 35: Global Surgical Visualization Systems Market Revenue undefined Forecast, by Country 2020 & 2033
- Table 36: GCC Global Surgical Visualization Systems Market Revenue (undefined) Forecast, by Application 2020 & 2033
- Table 37: South Africa Global Surgical Visualization Systems Market Revenue (undefined) Forecast, by Application 2020 & 2033
- Table 38: Rest of Middle East and Africa Global Surgical Visualization Systems Market Revenue (undefined) Forecast, by Application 2020 & 2033
- Table 39: Global Surgical Visualization Systems Market Revenue undefined Forecast, by Product 2020 & 2033
- Table 40: Global Surgical Visualization Systems Market Revenue undefined Forecast, by Application 2020 & 2033
- Table 41: Global Surgical Visualization Systems Market Revenue undefined Forecast, by End-Users 2020 & 2033
- Table 42: Global Surgical Visualization Systems Market Revenue undefined Forecast, by Country 2020 & 2033
- Table 43: Brazil Global Surgical Visualization Systems Market Revenue (undefined) Forecast, by Application 2020 & 2033
- Table 44: Argentina Global Surgical Visualization Systems Market Revenue (undefined) Forecast, by Application 2020 & 2033
- Table 45: Rest of South America Global Surgical Visualization Systems Market Revenue (undefined) Forecast, by Application 2020 & 2033
Frequently Asked Questions
1. What is the projected Compound Annual Growth Rate (CAGR) of the Global Surgical Visualization Systems Market?
The projected CAGR is approximately 13.21%.
2. Which companies are prominent players in the Global Surgical Visualization Systems Market?
Key companies in the market include Happersberger otopront GmbH, Carl Zeiss Meditec AG, Richard Wolf GmbH*List Not Exhaustive, AngioDynamics Inc, Fujifilm Corporation, Cardinal Health, Laborie Inc, Conmed Corporation, Stryker Corporation, Acutronic Medical Systems AG, Karl Storz GmbH & Co Kg, Olympus Corporation.
3. What are the main segments of the Global Surgical Visualization Systems Market?
The market segments include Product, Application, End-Users.
4. Can you provide details about the market size?
The market size is estimated to be USD XXX N/A as of 2022.
5. What are some drivers contributing to market growth?
Increasing Prevalence of Chronic Diseases; Technological Advancements in the Devices.
6. What are the notable trends driving market growth?
Colonoscopy Segment is Expected to Witness a Significant Growth Over the Forecast Period..
7. Are there any restraints impacting market growth?
High Cost of Endoscopy Procedures.
8. Can you provide examples of recent developments in the market?
March 2022: Endoluxe launches the high-definition, wireless endoscopic camera, TowerTech. TowerTech provides the complete functionality of legacy endoscopy video platforms, all built into the camera head.
9. What pricing options are available for accessing the report?
Pricing options include single-user, multi-user, and enterprise licenses priced at USD 4750, USD 5250, and USD 8750 respectively.
10. Is the market size provided in terms of value or volume?
The market size is provided in terms of value, measured in N/A.
11. Are there any specific market keywords associated with the report?
Yes, the market keyword associated with the report is "Global Surgical Visualization Systems Market," which aids in identifying and referencing the specific market segment covered.
12. How do I determine which pricing option suits my needs best?
The pricing options vary based on user requirements and access needs. Individual users may opt for single-user licenses, while businesses requiring broader access may choose multi-user or enterprise licenses for cost-effective access to the report.
13. Are there any additional resources or data provided in the Global Surgical Visualization Systems Market report?
While the report offers comprehensive insights, it's advisable to review the specific contents or supplementary materials provided to ascertain if additional resources or data are available.
14. How can I stay updated on further developments or reports in the Global Surgical Visualization Systems Market?
To stay informed about further developments, trends, and reports in the Global Surgical Visualization Systems Market, consider subscribing to industry newsletters, following relevant companies and organizations, or regularly checking reputable industry news sources and publications.
Methodology
Step 1 - Identification of Relevant Samples Size from Population Database


Step 2 - Approaches for Defining Global Market Size (Value, Volume* & Price*)

Note*: In applicable scenarios
Step 3 - Data Sources
Primary Research
- Web Analytics
- Survey Reports
- Research Institute
- Latest Research Reports
- Opinion Leaders
Secondary Research
- Annual Reports
- White Paper
- Latest Press Release
- Industry Association
- Paid Database
- Investor Presentations

Step 4 - Data Triangulation
Involves using different sources of information in order to increase the validity of a study
These sources are likely to be stakeholders in a program - participants, other researchers, program staff, other community members, and so on.
Then we put all data in single framework & apply various statistical tools to find out the dynamic on the market.
During the analysis stage, feedback from the stakeholder groups would be compared to determine areas of agreement as well as areas of divergence