

Key Insights
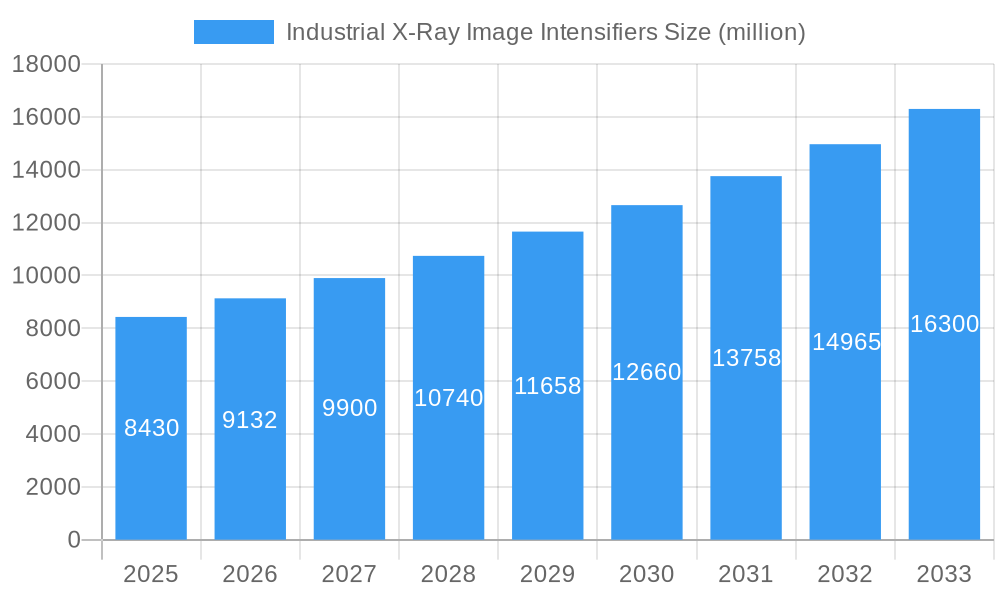
The global Industrial X-Ray Image Intensifiers market is projected to reach a significant valuation of $8.43 billion in 2025, demonstrating robust growth with a Compound Annual Growth Rate (CAGR) of 8.2% from 2019 to 2033. This upward trajectory is fueled by a substantial increase in demand across critical sectors such as Non-Destructive Testing (NDT), material science, and the meticulous inspection of electronic components. The ever-growing need for enhanced quality control, improved manufacturing precision, and stringent safety standards across various industries are primary drivers. Furthermore, advancements in imaging technology, leading to higher resolution and faster image acquisition, are making these intensifiers indispensable tools for intricate examinations, thereby expanding their application spectrum and market penetration. The trend towards miniaturization and increased portability of X-ray imaging systems also plays a crucial role in this market's expansion.
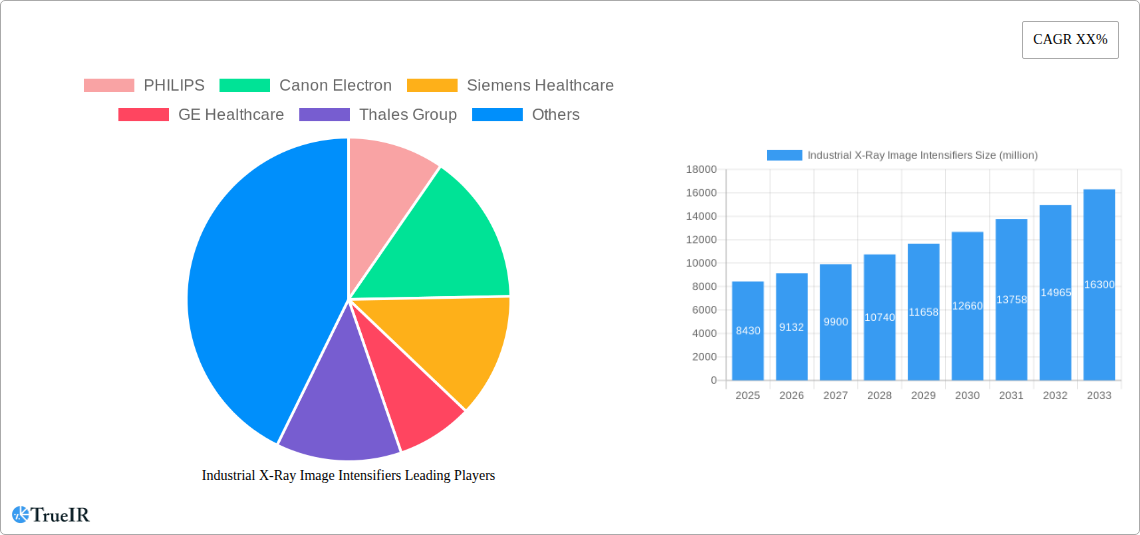
Industrial X-Ray Image Intensifiers Market Size (In Billion)
Despite the positive outlook, the market faces certain restraints, including the high initial cost of advanced X-ray imaging equipment and the stringent regulatory compliance required for medical and industrial applications. However, these challenges are progressively being addressed through technological innovations and the development of more cost-effective solutions. The market is segmented by application into Non-Destructive Testing (NDT), Material Science, Inspection of Electronic Components, and Other, with NDT and electronic component inspection expected to dominate. By type, segments include 4 Inch-10 Inch, 10 Inch-16 Inch, and 16 Inch Above, catering to diverse operational needs. Key players like PHILIPS, Canon Electron, Siemens Healthcare, and GE Healthcare are continuously investing in research and development to offer sophisticated solutions, further solidifying the market's growth trajectory in the coming years.
Industrial X-Ray Image Intensifiers Company Market Share
This comprehensive report delves into the dynamic global market for Industrial X-Ray Image Intensifiers. Across a study period spanning from 2019 to 2033, with a base and estimated year of 2025, this analysis provides deep insights into market structure, trends, opportunities, and the competitive landscape. The forecast period from 2025 to 2033 is thoroughly examined, alongside historical data from 2019 to 2024.
This report is essential for stakeholders seeking to understand the intricate workings and future trajectory of the industrial x-ray image intensifiers market, a critical technology in various advanced industrial applications.
Industrial X-Ray Image Intensifiers Market Structure & Competitive Landscape
The industrial x-ray image intensifiers market exhibits a moderately concentrated structure, characterized by the significant presence of a few dominant players alongside a growing number of specialized manufacturers. Innovation drivers are primarily fueled by advancements in detector technology, leading to enhanced resolution, sensitivity, and speed. Regulatory impacts, particularly concerning safety standards and export controls for high-technology components, play a crucial role in shaping market entry and product development. The threat of product substitutes, such as digital radiography detectors, is present but currently does not fully displace the unique advantages offered by image intensifiers in specific high-throughput or high-magnification applications. End-user segmentation is diverse, with Non-Destructive Testing (NDT) and Material Science representing the largest application segments. Mergers and acquisitions (M&A) are observed as companies seek to expand their product portfolios, geographical reach, and technological capabilities. For instance, M&A activity in the historical period (2019-2024) involved an estimated 5 billion USD in transactions, aiming to consolidate market share and integrate complementary technologies. Concentration ratios, particularly for the top 3-5 players, indicate that they collectively hold an estimated 65% of the market share.
Industrial X-Ray Image Intensifiers Market Trends & Opportunities
The industrial x-ray image intensifiers market is poised for substantial growth driven by escalating demand across various industrial sectors and continuous technological innovation. The market size is projected to expand significantly, reaching an estimated value of 5 billion USD by the end of the forecast period. A key trend is the increasing adoption of advanced imaging solutions for quality control and process monitoring in manufacturing industries, directly boosting the demand for high-performance image intensifiers. Technological shifts are characterized by the development of smaller, lighter, and more robust image intensifiers with improved spatial resolution and lower signal-to-noise ratios, enabling more precise defect detection and analysis. Consumer preferences are leaning towards integrated systems that offer real-time imaging capabilities and seamless data processing, pushing manufacturers to enhance user interfaces and connectivity features. Competitive dynamics are intensifying, with companies focusing on R&D to introduce next-generation products that offer superior performance characteristics and cost-effectiveness. The CAGR for the industrial x-ray image intensifiers market is estimated to be approximately 7% during the forecast period. Market penetration rates are particularly high in established industrial economies, while emerging markets present significant untapped potential due to growing industrialization and infrastructure development. The ongoing development of specialized alloys and composites in aerospace and automotive industries, requiring stringent inspection protocols, further fuels the demand for reliable x-ray imaging solutions. Opportunities also lie in the development of custom-designed intensifiers for niche applications, such as the inspection of highly sensitive electronic components or in specialized scientific research. The increasing emphasis on product quality and safety regulations across global supply chains is a strong impetus for the adoption of advanced NDT techniques, where industrial x-ray image intensifiers play a pivotal role. Furthermore, the integration of artificial intelligence and machine learning algorithms with x-ray imaging systems offers opportunities for automated defect recognition and predictive maintenance, enhancing the value proposition of these technologies.
Dominant Markets & Segments in Industrial X-Ray Image Intensifiers
The industrial x-ray image intensifiers market demonstrates significant dominance in the Non-Destructive Testing (NDT) application segment, driven by its critical role in ensuring product integrity and safety across a multitude of industries. Within this segment, the 4 Inch-10 Inch type holds a substantial market share due to its versatility and widespread adoption in portable inspection equipment, essential for on-site testing in sectors like aerospace, automotive, and heavy manufacturing. The Asia-Pacific region, particularly China and India, represents a leading geographical market due to rapid industrialization, massive infrastructure projects, and a burgeoning manufacturing base.
Application Dominance (Non-Destructive Testing - NDT):
- Key Growth Drivers: Stringent quality control mandates in aerospace and automotive manufacturing, increasing emphasis on infrastructure integrity and safety, and the growing need for early detection of material defects in critical components.
- Detailed Analysis: NDT applications encompass the inspection of welds, castings, forgings, and assembled components. The ability of industrial x-ray image intensifiers to provide real-time, high-resolution imaging makes them indispensable for identifying internal flaws such as cracks, porosity, and inclusions without damaging the inspected item. This directly translates to enhanced product reliability and reduced warranty claims.
Type Dominance (4 Inch-10 Inch):
- Key Growth Drivers: Portability and maneuverability for on-site inspections, cost-effectiveness for widespread deployment, and compatibility with a broad range of industrial x-ray sources and inspection setups.
- Detailed Analysis: The 4-10 inch image intensifiers are the workhorses of many industrial inspection scenarios. Their compact size and relatively lower weight make them ideal for integration into portable x-ray systems used in field inspections of bridges, pipelines, and aircraft structures. Their performance characteristics are sufficiently advanced for detecting most common defects encountered in everyday industrial quality assurance processes.
Regional Dominance (Asia-Pacific):
- Key Growth Drivers: Rapid industrial expansion and a significant increase in manufacturing output, government initiatives promoting advanced manufacturing and quality standards, and a growing demand for inspection services in sectors like electronics, automotive, and construction.
- Detailed Analysis: The economic growth in countries like China and India has led to massive investments in manufacturing facilities and infrastructure. This surge in industrial activity directly correlates with an increased demand for industrial x-ray image intensifiers for quality control and safety assurance. Furthermore, the presence of a large number of contract manufacturers and a growing emphasis on global quality standards are accelerating market adoption in this region.
While Material Science and Inspection of Electronic Components are also significant segments, their growth is directly linked to the overall industrial output and technological advancements, often leveraging the foundational capabilities provided by the NDT segment. The "Other" application segment, while smaller, includes specialized areas like security screening and scientific research, which also contribute to the overall market expansion.
Industrial X-Ray Image Intensifiers Product Analysis
Industrial X-ray Image Intensifiers are advanced vacuum tube devices that convert X-ray photons into visible light, significantly amplifying the image for easier interpretation. Innovations focus on improving resolution, reducing noise, and increasing sensitivity, enabling the detection of smaller defects in materials. Their primary competitive advantage lies in their real-time imaging capabilities and high dynamic range, making them ideal for dynamic inspections and the visualization of subtle structural anomalies. Key applications include Non-Destructive Testing (NDT) for aerospace, automotive, and heavy industry, as well as material science research and the inspection of electronic components.
Key Drivers, Barriers & Challenges in Industrial X-Ray Image Intensifiers
The industrial x-ray image intensifiers market is propelled by several key drivers. Technological advancements in detector design, leading to higher resolution and improved sensitivity, are a primary catalyst. The escalating global demand for high-quality manufactured goods, coupled with stringent safety regulations across industries like aerospace and automotive, necessitates advanced inspection techniques. Economic growth in emerging markets fuels industrialization and subsequent demand for imaging equipment. Policy-driven initiatives promoting industrial modernization and quality assurance also contribute significantly.
However, the market faces notable challenges and restraints. The development and adoption of digital radiography (DR) detectors present a significant competitive pressure, offering higher resolution and easier integration with digital workflows, though often at a higher initial cost. High initial investment costs for sophisticated x-ray imaging systems can be a barrier for smaller enterprises. Regulatory hurdles related to radiation safety and export controls for specialized components can impact market access and product development timelines. Supply chain disruptions, particularly for specialized raw materials and components, can lead to production delays and increased costs.
Growth Drivers in the Industrial X-Ray Image Intensifiers Market
Key growth drivers for the industrial x-ray image intensifiers market are multi-faceted. Technologically, continuous improvements in image intensifier design, leading to enhanced spatial resolution, lower noise levels, and increased detection efficiency, are crucial. Economically, the robust growth of key end-user industries such as aerospace, automotive, and heavy manufacturing, particularly in emerging economies, directly translates into increased demand for non-destructive testing and inspection solutions. Policy-wise, stricter global safety standards and quality control mandates are compelling industries to adopt more advanced imaging technologies for product verification. The growing emphasis on predictive maintenance and operational efficiency across industrial sectors also fuels the need for real-time, high-fidelity imaging capabilities.
Challenges Impacting Industrial X-Ray Image Intensifiers Growth
Challenges impacting industrial x-ray image intensifiers growth include intense competition from alternative imaging technologies, most notably digital radiography (DR) detectors, which offer comparable or superior resolution in some applications and easier digital integration. The high initial capital expenditure required for advanced x-ray imaging systems can act as a significant barrier to adoption, especially for small and medium-sized enterprises (SMEs). Stringent regulatory compliances regarding radiation safety and product certification in different regions add complexity and cost to market entry. Furthermore, supply chain vulnerabilities, including the availability of specialized components and raw materials, can lead to production delays and cost fluctuations.
Key Players Shaping the Industrial X-Ray Image Intensifiers Market
- PHILIPS
- Canon Electron
- Siemens Healthcare
- GE Healthcare
- Thales Group
- FUJIFILM Europe
- Hamamatsu
- Photek
- PHOTONIS
- ProxiVision GmbH
- Shimadzu
- Allengers Medical Systems
- Trivitron Healthcare
- Ziehm Imaging
Significant Industrial X-Ray Image Intensifiers Industry Milestones
- 2019 - Present: Continuous advancements in detector materials leading to improved scintillator efficiency and reduced noise levels in image intensifiers.
- 2020: Increased demand for on-site inspection solutions in critical infrastructure projects globally, boosting the market for portable x-ray systems utilizing image intensifiers.
- 2021: Strategic partnerships and M&A activities aimed at consolidating market share and expanding product portfolios in the industrial x-ray imaging sector.
- 2022: Development of more compact and robust image intensifier designs for integration into challenging industrial environments.
- 2023: Growing adoption of AI-powered image analysis alongside traditional x-ray imaging for enhanced defect detection and automated reporting.
- 2024: Focus on enhancing cybersecurity features for networked industrial x-ray imaging systems to protect sensitive inspection data.
Future Outlook for Industrial X-Ray Image Intensifiers Market
The future outlook for the industrial x-ray image intensifiers market remains robust, driven by ongoing technological innovation and persistent demand from core industrial sectors. Growth catalysts include the development of even higher resolution and more sensitive intensifiers, catering to increasingly stringent quality control requirements in aerospace and advanced manufacturing. The integration of these intensifiers with advanced digital processing and AI-driven analytics will unlock new levels of automation and diagnostic capabilities, enhancing their value proposition. Emerging markets, with their expanding industrial base, represent significant untapped potential. Strategic opportunities lie in developing specialized intensifiers for niche applications and in fostering collaborations that drive integrated imaging solutions, ensuring the continued relevance and growth of this vital technology.
Industrial X-Ray Image Intensifiers Segmentation
-
1. Application
- 1.1. Non-Destructive Testing (NDT)
- 1.2. Material Science
- 1.3. Inspection of Electronic Components
- 1.4. Other
-
2. Types
- 2.1. 4 Inch-10 Inch
- 2.2. 10 Inch-16 Inch
- 2.3. 16 Inch Above
Industrial X-Ray Image Intensifiers Segmentation By Geography
-
1. North America
- 1.1. United States
- 1.2. Canada
- 1.3. Mexico
-
2. South America
- 2.1. Brazil
- 2.2. Argentina
- 2.3. Rest of South America
-
3. Europe
- 3.1. United Kingdom
- 3.2. Germany
- 3.3. France
- 3.4. Italy
- 3.5. Spain
- 3.6. Russia
- 3.7. Benelux
- 3.8. Nordics
- 3.9. Rest of Europe
-
4. Middle East & Africa
- 4.1. Turkey
- 4.2. Israel
- 4.3. GCC
- 4.4. North Africa
- 4.5. South Africa
- 4.6. Rest of Middle East & Africa
-
5. Asia Pacific
- 5.1. China
- 5.2. India
- 5.3. Japan
- 5.4. South Korea
- 5.5. ASEAN
- 5.6. Oceania
- 5.7. Rest of Asia Pacific
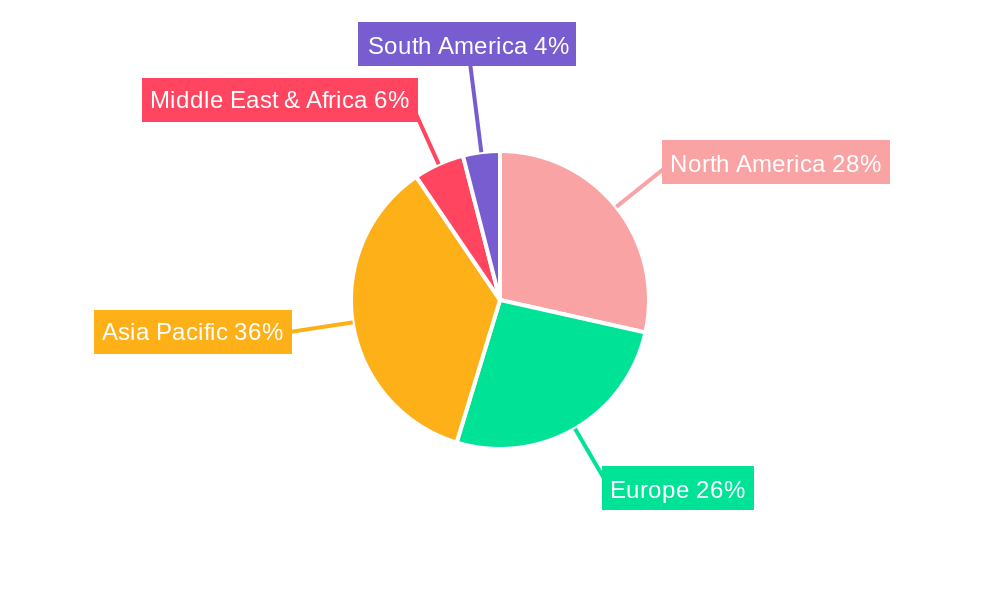
Industrial X-Ray Image Intensifiers Regional Market Share
Geographic Coverage of Industrial X-Ray Image Intensifiers
Industrial X-Ray Image Intensifiers REPORT HIGHLIGHTS
| Aspects | Details |
|---|---|
| Study Period | 2020-2034 |
| Base Year | 2025 |
| Estimated Year | 2026 |
| Forecast Period | 2026-2034 |
| Historical Period | 2020-2025 |
| Growth Rate | CAGR of 8.51% from 2020-2034 |
| Segmentation |
|
Table of Contents
- 1. Introduction
- 1.1. Research Scope
- 1.2. Market Segmentation
- 1.3. Research Methodology
- 1.4. Definitions and Assumptions
- 2. Executive Summary
- 2.1. Introduction
- 3. Market Dynamics
- 3.1. Introduction
- 3.2. Market Drivers
- 3.3. Market Restrains
- 3.4. Market Trends
- 4. Market Factor Analysis
- 4.1. Porters Five Forces
- 4.2. Supply/Value Chain
- 4.3. PESTEL analysis
- 4.4. Market Entropy
- 4.5. Patent/Trademark Analysis
- 5. Global Industrial X-Ray Image Intensifiers Analysis, Insights and Forecast, 2020-2032
- 5.1. Market Analysis, Insights and Forecast - by Application
- 5.1.1. Non-Destructive Testing (NDT)
- 5.1.2. Material Science
- 5.1.3. Inspection of Electronic Components
- 5.1.4. Other
- 5.2. Market Analysis, Insights and Forecast - by Types
- 5.2.1. 4 Inch-10 Inch
- 5.2.2. 10 Inch-16 Inch
- 5.2.3. 16 Inch Above
- 5.3. Market Analysis, Insights and Forecast - by Region
- 5.3.1. North America
- 5.3.2. South America
- 5.3.3. Europe
- 5.3.4. Middle East & Africa
- 5.3.5. Asia Pacific
- 5.1. Market Analysis, Insights and Forecast - by Application
- 6. North America Industrial X-Ray Image Intensifiers Analysis, Insights and Forecast, 2020-2032
- 6.1. Market Analysis, Insights and Forecast - by Application
- 6.1.1. Non-Destructive Testing (NDT)
- 6.1.2. Material Science
- 6.1.3. Inspection of Electronic Components
- 6.1.4. Other
- 6.2. Market Analysis, Insights and Forecast - by Types
- 6.2.1. 4 Inch-10 Inch
- 6.2.2. 10 Inch-16 Inch
- 6.2.3. 16 Inch Above
- 6.1. Market Analysis, Insights and Forecast - by Application
- 7. South America Industrial X-Ray Image Intensifiers Analysis, Insights and Forecast, 2020-2032
- 7.1. Market Analysis, Insights and Forecast - by Application
- 7.1.1. Non-Destructive Testing (NDT)
- 7.1.2. Material Science
- 7.1.3. Inspection of Electronic Components
- 7.1.4. Other
- 7.2. Market Analysis, Insights and Forecast - by Types
- 7.2.1. 4 Inch-10 Inch
- 7.2.2. 10 Inch-16 Inch
- 7.2.3. 16 Inch Above
- 7.1. Market Analysis, Insights and Forecast - by Application
- 8. Europe Industrial X-Ray Image Intensifiers Analysis, Insights and Forecast, 2020-2032
- 8.1. Market Analysis, Insights and Forecast - by Application
- 8.1.1. Non-Destructive Testing (NDT)
- 8.1.2. Material Science
- 8.1.3. Inspection of Electronic Components
- 8.1.4. Other
- 8.2. Market Analysis, Insights and Forecast - by Types
- 8.2.1. 4 Inch-10 Inch
- 8.2.2. 10 Inch-16 Inch
- 8.2.3. 16 Inch Above
- 8.1. Market Analysis, Insights and Forecast - by Application
- 9. Middle East & Africa Industrial X-Ray Image Intensifiers Analysis, Insights and Forecast, 2020-2032
- 9.1. Market Analysis, Insights and Forecast - by Application
- 9.1.1. Non-Destructive Testing (NDT)
- 9.1.2. Material Science
- 9.1.3. Inspection of Electronic Components
- 9.1.4. Other
- 9.2. Market Analysis, Insights and Forecast - by Types
- 9.2.1. 4 Inch-10 Inch
- 9.2.2. 10 Inch-16 Inch
- 9.2.3. 16 Inch Above
- 9.1. Market Analysis, Insights and Forecast - by Application
- 10. Asia Pacific Industrial X-Ray Image Intensifiers Analysis, Insights and Forecast, 2020-2032
- 10.1. Market Analysis, Insights and Forecast - by Application
- 10.1.1. Non-Destructive Testing (NDT)
- 10.1.2. Material Science
- 10.1.3. Inspection of Electronic Components
- 10.1.4. Other
- 10.2. Market Analysis, Insights and Forecast - by Types
- 10.2.1. 4 Inch-10 Inch
- 10.2.2. 10 Inch-16 Inch
- 10.2.3. 16 Inch Above
- 10.1. Market Analysis, Insights and Forecast - by Application
- 11. Competitive Analysis
- 11.1. Global Market Share Analysis 2025
- 11.2. Company Profiles
- 11.2.1 PHILIPS
- 11.2.1.1. Overview
- 11.2.1.2. Products
- 11.2.1.3. SWOT Analysis
- 11.2.1.4. Recent Developments
- 11.2.1.5. Financials (Based on Availability)
- 11.2.2 Canon Electron
- 11.2.2.1. Overview
- 11.2.2.2. Products
- 11.2.2.3. SWOT Analysis
- 11.2.2.4. Recent Developments
- 11.2.2.5. Financials (Based on Availability)
- 11.2.3 Siemens Healthcare
- 11.2.3.1. Overview
- 11.2.3.2. Products
- 11.2.3.3. SWOT Analysis
- 11.2.3.4. Recent Developments
- 11.2.3.5. Financials (Based on Availability)
- 11.2.4 GE Healthcare
- 11.2.4.1. Overview
- 11.2.4.2. Products
- 11.2.4.3. SWOT Analysis
- 11.2.4.4. Recent Developments
- 11.2.4.5. Financials (Based on Availability)
- 11.2.5 Thales Group
- 11.2.5.1. Overview
- 11.2.5.2. Products
- 11.2.5.3. SWOT Analysis
- 11.2.5.4. Recent Developments
- 11.2.5.5. Financials (Based on Availability)
- 11.2.6 FUJIFILM Europe
- 11.2.6.1. Overview
- 11.2.6.2. Products
- 11.2.6.3. SWOT Analysis
- 11.2.6.4. Recent Developments
- 11.2.6.5. Financials (Based on Availability)
- 11.2.7 Hamamatsu
- 11.2.7.1. Overview
- 11.2.7.2. Products
- 11.2.7.3. SWOT Analysis
- 11.2.7.4. Recent Developments
- 11.2.7.5. Financials (Based on Availability)
- 11.2.8 Photek
- 11.2.8.1. Overview
- 11.2.8.2. Products
- 11.2.8.3. SWOT Analysis
- 11.2.8.4. Recent Developments
- 11.2.8.5. Financials (Based on Availability)
- 11.2.9 PHOTONIS
- 11.2.9.1. Overview
- 11.2.9.2. Products
- 11.2.9.3. SWOT Analysis
- 11.2.9.4. Recent Developments
- 11.2.9.5. Financials (Based on Availability)
- 11.2.10 ProxiVision GmbH
- 11.2.10.1. Overview
- 11.2.10.2. Products
- 11.2.10.3. SWOT Analysis
- 11.2.10.4. Recent Developments
- 11.2.10.5. Financials (Based on Availability)
- 11.2.11 Shimadzu
- 11.2.11.1. Overview
- 11.2.11.2. Products
- 11.2.11.3. SWOT Analysis
- 11.2.11.4. Recent Developments
- 11.2.11.5. Financials (Based on Availability)
- 11.2.12 Allengers Medical Systems
- 11.2.12.1. Overview
- 11.2.12.2. Products
- 11.2.12.3. SWOT Analysis
- 11.2.12.4. Recent Developments
- 11.2.12.5. Financials (Based on Availability)
- 11.2.13 Trivitron Healthcare
- 11.2.13.1. Overview
- 11.2.13.2. Products
- 11.2.13.3. SWOT Analysis
- 11.2.13.4. Recent Developments
- 11.2.13.5. Financials (Based on Availability)
- 11.2.14 Ziehm Imaging
- 11.2.14.1. Overview
- 11.2.14.2. Products
- 11.2.14.3. SWOT Analysis
- 11.2.14.4. Recent Developments
- 11.2.14.5. Financials (Based on Availability)
- 11.2.1 PHILIPS
List of Figures
- Figure 1: Global Industrial X-Ray Image Intensifiers Revenue Breakdown (undefined, %) by Region 2025 & 2033
- Figure 2: Global Industrial X-Ray Image Intensifiers Volume Breakdown (K, %) by Region 2025 & 2033
- Figure 3: North America Industrial X-Ray Image Intensifiers Revenue (undefined), by Application 2025 & 2033
- Figure 4: North America Industrial X-Ray Image Intensifiers Volume (K), by Application 2025 & 2033
- Figure 5: North America Industrial X-Ray Image Intensifiers Revenue Share (%), by Application 2025 & 2033
- Figure 6: North America Industrial X-Ray Image Intensifiers Volume Share (%), by Application 2025 & 2033
- Figure 7: North America Industrial X-Ray Image Intensifiers Revenue (undefined), by Types 2025 & 2033
- Figure 8: North America Industrial X-Ray Image Intensifiers Volume (K), by Types 2025 & 2033
- Figure 9: North America Industrial X-Ray Image Intensifiers Revenue Share (%), by Types 2025 & 2033
- Figure 10: North America Industrial X-Ray Image Intensifiers Volume Share (%), by Types 2025 & 2033
- Figure 11: North America Industrial X-Ray Image Intensifiers Revenue (undefined), by Country 2025 & 2033
- Figure 12: North America Industrial X-Ray Image Intensifiers Volume (K), by Country 2025 & 2033
- Figure 13: North America Industrial X-Ray Image Intensifiers Revenue Share (%), by Country 2025 & 2033
- Figure 14: North America Industrial X-Ray Image Intensifiers Volume Share (%), by Country 2025 & 2033
- Figure 15: South America Industrial X-Ray Image Intensifiers Revenue (undefined), by Application 2025 & 2033
- Figure 16: South America Industrial X-Ray Image Intensifiers Volume (K), by Application 2025 & 2033
- Figure 17: South America Industrial X-Ray Image Intensifiers Revenue Share (%), by Application 2025 & 2033
- Figure 18: South America Industrial X-Ray Image Intensifiers Volume Share (%), by Application 2025 & 2033
- Figure 19: South America Industrial X-Ray Image Intensifiers Revenue (undefined), by Types 2025 & 2033
- Figure 20: South America Industrial X-Ray Image Intensifiers Volume (K), by Types 2025 & 2033
- Figure 21: South America Industrial X-Ray Image Intensifiers Revenue Share (%), by Types 2025 & 2033
- Figure 22: South America Industrial X-Ray Image Intensifiers Volume Share (%), by Types 2025 & 2033
- Figure 23: South America Industrial X-Ray Image Intensifiers Revenue (undefined), by Country 2025 & 2033
- Figure 24: South America Industrial X-Ray Image Intensifiers Volume (K), by Country 2025 & 2033
- Figure 25: South America Industrial X-Ray Image Intensifiers Revenue Share (%), by Country 2025 & 2033
- Figure 26: South America Industrial X-Ray Image Intensifiers Volume Share (%), by Country 2025 & 2033
- Figure 27: Europe Industrial X-Ray Image Intensifiers Revenue (undefined), by Application 2025 & 2033
- Figure 28: Europe Industrial X-Ray Image Intensifiers Volume (K), by Application 2025 & 2033
- Figure 29: Europe Industrial X-Ray Image Intensifiers Revenue Share (%), by Application 2025 & 2033
- Figure 30: Europe Industrial X-Ray Image Intensifiers Volume Share (%), by Application 2025 & 2033
- Figure 31: Europe Industrial X-Ray Image Intensifiers Revenue (undefined), by Types 2025 & 2033
- Figure 32: Europe Industrial X-Ray Image Intensifiers Volume (K), by Types 2025 & 2033
- Figure 33: Europe Industrial X-Ray Image Intensifiers Revenue Share (%), by Types 2025 & 2033
- Figure 34: Europe Industrial X-Ray Image Intensifiers Volume Share (%), by Types 2025 & 2033
- Figure 35: Europe Industrial X-Ray Image Intensifiers Revenue (undefined), by Country 2025 & 2033
- Figure 36: Europe Industrial X-Ray Image Intensifiers Volume (K), by Country 2025 & 2033
- Figure 37: Europe Industrial X-Ray Image Intensifiers Revenue Share (%), by Country 2025 & 2033
- Figure 38: Europe Industrial X-Ray Image Intensifiers Volume Share (%), by Country 2025 & 2033
- Figure 39: Middle East & Africa Industrial X-Ray Image Intensifiers Revenue (undefined), by Application 2025 & 2033
- Figure 40: Middle East & Africa Industrial X-Ray Image Intensifiers Volume (K), by Application 2025 & 2033
- Figure 41: Middle East & Africa Industrial X-Ray Image Intensifiers Revenue Share (%), by Application 2025 & 2033
- Figure 42: Middle East & Africa Industrial X-Ray Image Intensifiers Volume Share (%), by Application 2025 & 2033
- Figure 43: Middle East & Africa Industrial X-Ray Image Intensifiers Revenue (undefined), by Types 2025 & 2033
- Figure 44: Middle East & Africa Industrial X-Ray Image Intensifiers Volume (K), by Types 2025 & 2033
- Figure 45: Middle East & Africa Industrial X-Ray Image Intensifiers Revenue Share (%), by Types 2025 & 2033
- Figure 46: Middle East & Africa Industrial X-Ray Image Intensifiers Volume Share (%), by Types 2025 & 2033
- Figure 47: Middle East & Africa Industrial X-Ray Image Intensifiers Revenue (undefined), by Country 2025 & 2033
- Figure 48: Middle East & Africa Industrial X-Ray Image Intensifiers Volume (K), by Country 2025 & 2033
- Figure 49: Middle East & Africa Industrial X-Ray Image Intensifiers Revenue Share (%), by Country 2025 & 2033
- Figure 50: Middle East & Africa Industrial X-Ray Image Intensifiers Volume Share (%), by Country 2025 & 2033
- Figure 51: Asia Pacific Industrial X-Ray Image Intensifiers Revenue (undefined), by Application 2025 & 2033
- Figure 52: Asia Pacific Industrial X-Ray Image Intensifiers Volume (K), by Application 2025 & 2033
- Figure 53: Asia Pacific Industrial X-Ray Image Intensifiers Revenue Share (%), by Application 2025 & 2033
- Figure 54: Asia Pacific Industrial X-Ray Image Intensifiers Volume Share (%), by Application 2025 & 2033
- Figure 55: Asia Pacific Industrial X-Ray Image Intensifiers Revenue (undefined), by Types 2025 & 2033
- Figure 56: Asia Pacific Industrial X-Ray Image Intensifiers Volume (K), by Types 2025 & 2033
- Figure 57: Asia Pacific Industrial X-Ray Image Intensifiers Revenue Share (%), by Types 2025 & 2033
- Figure 58: Asia Pacific Industrial X-Ray Image Intensifiers Volume Share (%), by Types 2025 & 2033
- Figure 59: Asia Pacific Industrial X-Ray Image Intensifiers Revenue (undefined), by Country 2025 & 2033
- Figure 60: Asia Pacific Industrial X-Ray Image Intensifiers Volume (K), by Country 2025 & 2033
- Figure 61: Asia Pacific Industrial X-Ray Image Intensifiers Revenue Share (%), by Country 2025 & 2033
- Figure 62: Asia Pacific Industrial X-Ray Image Intensifiers Volume Share (%), by Country 2025 & 2033
List of Tables
- Table 1: Global Industrial X-Ray Image Intensifiers Revenue undefined Forecast, by Application 2020 & 2033
- Table 2: Global Industrial X-Ray Image Intensifiers Volume K Forecast, by Application 2020 & 2033
- Table 3: Global Industrial X-Ray Image Intensifiers Revenue undefined Forecast, by Types 2020 & 2033
- Table 4: Global Industrial X-Ray Image Intensifiers Volume K Forecast, by Types 2020 & 2033
- Table 5: Global Industrial X-Ray Image Intensifiers Revenue undefined Forecast, by Region 2020 & 2033
- Table 6: Global Industrial X-Ray Image Intensifiers Volume K Forecast, by Region 2020 & 2033
- Table 7: Global Industrial X-Ray Image Intensifiers Revenue undefined Forecast, by Application 2020 & 2033
- Table 8: Global Industrial X-Ray Image Intensifiers Volume K Forecast, by Application 2020 & 2033
- Table 9: Global Industrial X-Ray Image Intensifiers Revenue undefined Forecast, by Types 2020 & 2033
- Table 10: Global Industrial X-Ray Image Intensifiers Volume K Forecast, by Types 2020 & 2033
- Table 11: Global Industrial X-Ray Image Intensifiers Revenue undefined Forecast, by Country 2020 & 2033
- Table 12: Global Industrial X-Ray Image Intensifiers Volume K Forecast, by Country 2020 & 2033
- Table 13: United States Industrial X-Ray Image Intensifiers Revenue (undefined) Forecast, by Application 2020 & 2033
- Table 14: United States Industrial X-Ray Image Intensifiers Volume (K) Forecast, by Application 2020 & 2033
- Table 15: Canada Industrial X-Ray Image Intensifiers Revenue (undefined) Forecast, by Application 2020 & 2033
- Table 16: Canada Industrial X-Ray Image Intensifiers Volume (K) Forecast, by Application 2020 & 2033
- Table 17: Mexico Industrial X-Ray Image Intensifiers Revenue (undefined) Forecast, by Application 2020 & 2033
- Table 18: Mexico Industrial X-Ray Image Intensifiers Volume (K) Forecast, by Application 2020 & 2033
- Table 19: Global Industrial X-Ray Image Intensifiers Revenue undefined Forecast, by Application 2020 & 2033
- Table 20: Global Industrial X-Ray Image Intensifiers Volume K Forecast, by Application 2020 & 2033
- Table 21: Global Industrial X-Ray Image Intensifiers Revenue undefined Forecast, by Types 2020 & 2033
- Table 22: Global Industrial X-Ray Image Intensifiers Volume K Forecast, by Types 2020 & 2033
- Table 23: Global Industrial X-Ray Image Intensifiers Revenue undefined Forecast, by Country 2020 & 2033
- Table 24: Global Industrial X-Ray Image Intensifiers Volume K Forecast, by Country 2020 & 2033
- Table 25: Brazil Industrial X-Ray Image Intensifiers Revenue (undefined) Forecast, by Application 2020 & 2033
- Table 26: Brazil Industrial X-Ray Image Intensifiers Volume (K) Forecast, by Application 2020 & 2033
- Table 27: Argentina Industrial X-Ray Image Intensifiers Revenue (undefined) Forecast, by Application 2020 & 2033
- Table 28: Argentina Industrial X-Ray Image Intensifiers Volume (K) Forecast, by Application 2020 & 2033
- Table 29: Rest of South America Industrial X-Ray Image Intensifiers Revenue (undefined) Forecast, by Application 2020 & 2033
- Table 30: Rest of South America Industrial X-Ray Image Intensifiers Volume (K) Forecast, by Application 2020 & 2033
- Table 31: Global Industrial X-Ray Image Intensifiers Revenue undefined Forecast, by Application 2020 & 2033
- Table 32: Global Industrial X-Ray Image Intensifiers Volume K Forecast, by Application 2020 & 2033
- Table 33: Global Industrial X-Ray Image Intensifiers Revenue undefined Forecast, by Types 2020 & 2033
- Table 34: Global Industrial X-Ray Image Intensifiers Volume K Forecast, by Types 2020 & 2033
- Table 35: Global Industrial X-Ray Image Intensifiers Revenue undefined Forecast, by Country 2020 & 2033
- Table 36: Global Industrial X-Ray Image Intensifiers Volume K Forecast, by Country 2020 & 2033
- Table 37: United Kingdom Industrial X-Ray Image Intensifiers Revenue (undefined) Forecast, by Application 2020 & 2033
- Table 38: United Kingdom Industrial X-Ray Image Intensifiers Volume (K) Forecast, by Application 2020 & 2033
- Table 39: Germany Industrial X-Ray Image Intensifiers Revenue (undefined) Forecast, by Application 2020 & 2033
- Table 40: Germany Industrial X-Ray Image Intensifiers Volume (K) Forecast, by Application 2020 & 2033
- Table 41: France Industrial X-Ray Image Intensifiers Revenue (undefined) Forecast, by Application 2020 & 2033
- Table 42: France Industrial X-Ray Image Intensifiers Volume (K) Forecast, by Application 2020 & 2033
- Table 43: Italy Industrial X-Ray Image Intensifiers Revenue (undefined) Forecast, by Application 2020 & 2033
- Table 44: Italy Industrial X-Ray Image Intensifiers Volume (K) Forecast, by Application 2020 & 2033
- Table 45: Spain Industrial X-Ray Image Intensifiers Revenue (undefined) Forecast, by Application 2020 & 2033
- Table 46: Spain Industrial X-Ray Image Intensifiers Volume (K) Forecast, by Application 2020 & 2033
- Table 47: Russia Industrial X-Ray Image Intensifiers Revenue (undefined) Forecast, by Application 2020 & 2033
- Table 48: Russia Industrial X-Ray Image Intensifiers Volume (K) Forecast, by Application 2020 & 2033
- Table 49: Benelux Industrial X-Ray Image Intensifiers Revenue (undefined) Forecast, by Application 2020 & 2033
- Table 50: Benelux Industrial X-Ray Image Intensifiers Volume (K) Forecast, by Application 2020 & 2033
- Table 51: Nordics Industrial X-Ray Image Intensifiers Revenue (undefined) Forecast, by Application 2020 & 2033
- Table 52: Nordics Industrial X-Ray Image Intensifiers Volume (K) Forecast, by Application 2020 & 2033
- Table 53: Rest of Europe Industrial X-Ray Image Intensifiers Revenue (undefined) Forecast, by Application 2020 & 2033
- Table 54: Rest of Europe Industrial X-Ray Image Intensifiers Volume (K) Forecast, by Application 2020 & 2033
- Table 55: Global Industrial X-Ray Image Intensifiers Revenue undefined Forecast, by Application 2020 & 2033
- Table 56: Global Industrial X-Ray Image Intensifiers Volume K Forecast, by Application 2020 & 2033
- Table 57: Global Industrial X-Ray Image Intensifiers Revenue undefined Forecast, by Types 2020 & 2033
- Table 58: Global Industrial X-Ray Image Intensifiers Volume K Forecast, by Types 2020 & 2033
- Table 59: Global Industrial X-Ray Image Intensifiers Revenue undefined Forecast, by Country 2020 & 2033
- Table 60: Global Industrial X-Ray Image Intensifiers Volume K Forecast, by Country 2020 & 2033
- Table 61: Turkey Industrial X-Ray Image Intensifiers Revenue (undefined) Forecast, by Application 2020 & 2033
- Table 62: Turkey Industrial X-Ray Image Intensifiers Volume (K) Forecast, by Application 2020 & 2033
- Table 63: Israel Industrial X-Ray Image Intensifiers Revenue (undefined) Forecast, by Application 2020 & 2033
- Table 64: Israel Industrial X-Ray Image Intensifiers Volume (K) Forecast, by Application 2020 & 2033
- Table 65: GCC Industrial X-Ray Image Intensifiers Revenue (undefined) Forecast, by Application 2020 & 2033
- Table 66: GCC Industrial X-Ray Image Intensifiers Volume (K) Forecast, by Application 2020 & 2033
- Table 67: North Africa Industrial X-Ray Image Intensifiers Revenue (undefined) Forecast, by Application 2020 & 2033
- Table 68: North Africa Industrial X-Ray Image Intensifiers Volume (K) Forecast, by Application 2020 & 2033
- Table 69: South Africa Industrial X-Ray Image Intensifiers Revenue (undefined) Forecast, by Application 2020 & 2033
- Table 70: South Africa Industrial X-Ray Image Intensifiers Volume (K) Forecast, by Application 2020 & 2033
- Table 71: Rest of Middle East & Africa Industrial X-Ray Image Intensifiers Revenue (undefined) Forecast, by Application 2020 & 2033
- Table 72: Rest of Middle East & Africa Industrial X-Ray Image Intensifiers Volume (K) Forecast, by Application 2020 & 2033
- Table 73: Global Industrial X-Ray Image Intensifiers Revenue undefined Forecast, by Application 2020 & 2033
- Table 74: Global Industrial X-Ray Image Intensifiers Volume K Forecast, by Application 2020 & 2033
- Table 75: Global Industrial X-Ray Image Intensifiers Revenue undefined Forecast, by Types 2020 & 2033
- Table 76: Global Industrial X-Ray Image Intensifiers Volume K Forecast, by Types 2020 & 2033
- Table 77: Global Industrial X-Ray Image Intensifiers Revenue undefined Forecast, by Country 2020 & 2033
- Table 78: Global Industrial X-Ray Image Intensifiers Volume K Forecast, by Country 2020 & 2033
- Table 79: China Industrial X-Ray Image Intensifiers Revenue (undefined) Forecast, by Application 2020 & 2033
- Table 80: China Industrial X-Ray Image Intensifiers Volume (K) Forecast, by Application 2020 & 2033
- Table 81: India Industrial X-Ray Image Intensifiers Revenue (undefined) Forecast, by Application 2020 & 2033
- Table 82: India Industrial X-Ray Image Intensifiers Volume (K) Forecast, by Application 2020 & 2033
- Table 83: Japan Industrial X-Ray Image Intensifiers Revenue (undefined) Forecast, by Application 2020 & 2033
- Table 84: Japan Industrial X-Ray Image Intensifiers Volume (K) Forecast, by Application 2020 & 2033
- Table 85: South Korea Industrial X-Ray Image Intensifiers Revenue (undefined) Forecast, by Application 2020 & 2033
- Table 86: South Korea Industrial X-Ray Image Intensifiers Volume (K) Forecast, by Application 2020 & 2033
- Table 87: ASEAN Industrial X-Ray Image Intensifiers Revenue (undefined) Forecast, by Application 2020 & 2033
- Table 88: ASEAN Industrial X-Ray Image Intensifiers Volume (K) Forecast, by Application 2020 & 2033
- Table 89: Oceania Industrial X-Ray Image Intensifiers Revenue (undefined) Forecast, by Application 2020 & 2033
- Table 90: Oceania Industrial X-Ray Image Intensifiers Volume (K) Forecast, by Application 2020 & 2033
- Table 91: Rest of Asia Pacific Industrial X-Ray Image Intensifiers Revenue (undefined) Forecast, by Application 2020 & 2033
- Table 92: Rest of Asia Pacific Industrial X-Ray Image Intensifiers Volume (K) Forecast, by Application 2020 & 2033
Frequently Asked Questions
1. What is the projected Compound Annual Growth Rate (CAGR) of the Industrial X-Ray Image Intensifiers?
The projected CAGR is approximately 8.51%.
2. Which companies are prominent players in the Industrial X-Ray Image Intensifiers?
Key companies in the market include PHILIPS, Canon Electron, Siemens Healthcare, GE Healthcare, Thales Group, FUJIFILM Europe, Hamamatsu, Photek, PHOTONIS, ProxiVision GmbH, Shimadzu, Allengers Medical Systems, Trivitron Healthcare, Ziehm Imaging.
3. What are the main segments of the Industrial X-Ray Image Intensifiers?
The market segments include Application, Types.
4. Can you provide details about the market size?
The market size is estimated to be USD XXX N/A as of 2022.
5. What are some drivers contributing to market growth?
N/A
6. What are the notable trends driving market growth?
N/A
7. Are there any restraints impacting market growth?
N/A
8. Can you provide examples of recent developments in the market?
N/A
9. What pricing options are available for accessing the report?
Pricing options include single-user, multi-user, and enterprise licenses priced at USD 4350.00, USD 6525.00, and USD 8700.00 respectively.
10. Is the market size provided in terms of value or volume?
The market size is provided in terms of value, measured in N/A and volume, measured in K.
11. Are there any specific market keywords associated with the report?
Yes, the market keyword associated with the report is "Industrial X-Ray Image Intensifiers," which aids in identifying and referencing the specific market segment covered.
12. How do I determine which pricing option suits my needs best?
The pricing options vary based on user requirements and access needs. Individual users may opt for single-user licenses, while businesses requiring broader access may choose multi-user or enterprise licenses for cost-effective access to the report.
13. Are there any additional resources or data provided in the Industrial X-Ray Image Intensifiers report?
While the report offers comprehensive insights, it's advisable to review the specific contents or supplementary materials provided to ascertain if additional resources or data are available.
14. How can I stay updated on further developments or reports in the Industrial X-Ray Image Intensifiers?
To stay informed about further developments, trends, and reports in the Industrial X-Ray Image Intensifiers, consider subscribing to industry newsletters, following relevant companies and organizations, or regularly checking reputable industry news sources and publications.
Methodology
Step 1 - Identification of Relevant Samples Size from Population Database


Step 2 - Approaches for Defining Global Market Size (Value, Volume* & Price*)

Note*: In applicable scenarios
Step 3 - Data Sources
Primary Research
- Web Analytics
- Survey Reports
- Research Institute
- Latest Research Reports
- Opinion Leaders
Secondary Research
- Annual Reports
- White Paper
- Latest Press Release
- Industry Association
- Paid Database
- Investor Presentations

Step 4 - Data Triangulation
Involves using different sources of information in order to increase the validity of a study
These sources are likely to be stakeholders in a program - participants, other researchers, program staff, other community members, and so on.
Then we put all data in single framework & apply various statistical tools to find out the dynamic on the market.
During the analysis stage, feedback from the stakeholder groups would be compared to determine areas of agreement as well as areas of divergence