

Key Insights
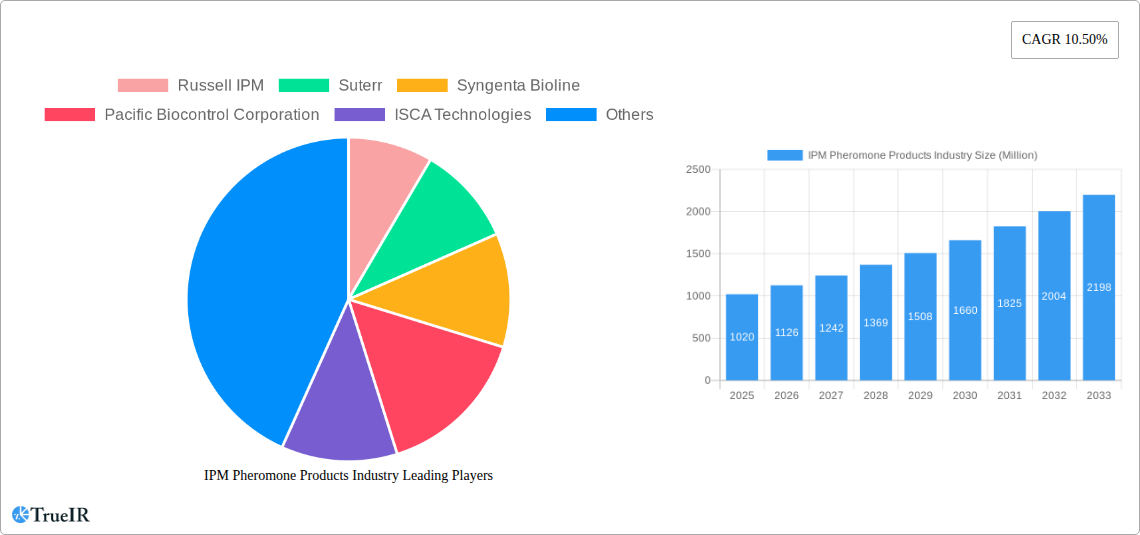
The IPM (Integrated Pest Management) pheromone products market, valued at $1.02 billion in 2025, is projected to experience robust growth, driven by the increasing demand for eco-friendly pest control solutions and stringent regulations on chemical pesticides. The market's Compound Annual Growth Rate (CAGR) of 10.50% from 2025 to 2033 reflects a significant expansion opportunity. Key drivers include the rising awareness of the harmful effects of synthetic pesticides on human health and the environment, coupled with the growing adoption of sustainable agricultural practices. The increasing prevalence of pest resistance to conventional insecticides further fuels market growth, making pheromone-based pest management a vital alternative. Market segmentation reveals strong growth across various application modes, including traps, dispensers, and mating disruption techniques. Field crops constitute a significant portion of the market, reflecting the substantial need for effective pest control in large-scale agricultural operations. Leading players like Russell IPM, Syngenta Bioline, and BASF SE are driving innovation through the development of advanced pheromone formulations and delivery systems, further contributing to market expansion. The Asia-Pacific region, particularly India and China, is anticipated to witness significant growth due to the expanding agricultural sector and increasing adoption of IPM strategies.
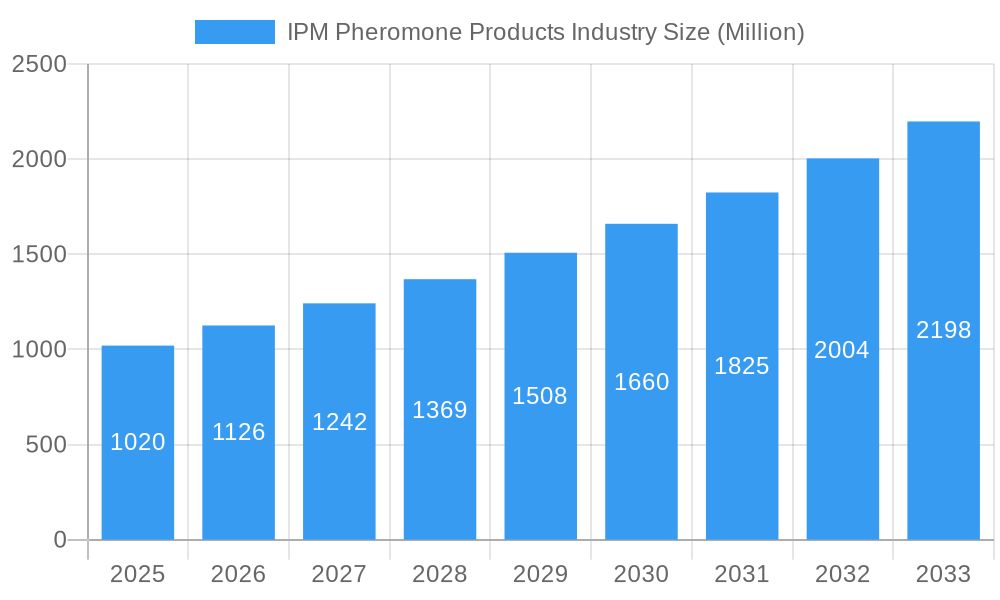
IPM Pheromone Products Industry Market Size (In Billion)
The market's growth is not without challenges. High initial investment costs for pheromone-based technologies and the relatively complex application processes can act as restraints. Furthermore, the efficacy of pheromone products can be affected by environmental factors like temperature and humidity, requiring further research and development for optimized performance across diverse climatic conditions. Despite these challenges, the long-term outlook for the IPM pheromone products market remains positive, fueled by increasing governmental support for sustainable agriculture, heightened consumer demand for pesticide-free produce, and continuous advancements in pheromone technology. The market's future trajectory will likely be shaped by innovations in pheromone formulation, improved delivery systems, and targeted research focusing on specific pest species and cropping systems. This will lead to increased market penetration and wider adoption across various agricultural sectors globally.
IPM Pheromone Products Industry Company Market Share
This dynamic report provides a comprehensive analysis of the IPM Pheromone Products industry, offering invaluable insights for businesses, investors, and researchers. Covering the period from 2019 to 2033, with a focus on 2025, this study unveils market trends, competitive landscapes, and future growth projections, all while leveraging high-impact keywords to enhance discoverability. The global market is projected to reach xx Million by 2033.
IPM Pheromone Products Industry Market Structure & Competitive Landscape
The IPM pheromone products market exhibits a moderately concentrated structure. Key players such as Russell IPM, Suterr, Syngenta Bioline, Pacific Biocontrol Corporation, ISCA Technologies, Shin-Etsu, Hercon Environmental, Sumi Agro France, Isagro, and BASF SE, collectively hold a significant market share, estimated at xx%. However, the presence of numerous smaller players, particularly in regional markets, indicates a degree of fragmentation.
Market Concentration:
- High concentration in certain segments (e.g., mating disruption for specific crops).
- Moderate overall concentration, with room for smaller players to thrive in niche markets.
- Herfindahl-Hirschman Index (HHI) estimated at xx (indicating moderate concentration).
Innovation Drivers:
- Development of novel pheromone blends for improved efficacy.
- Advances in dispenser technology for enhanced release and longevity.
- Integration of pheromone-based monitoring with digital technologies (e.g., IoT sensors).
Regulatory Impacts:
- Stringent regulations regarding pesticide use and environmental impact are driving adoption of pheromone-based solutions.
- Variations in regulations across different geographies influence market growth potential.
Product Substitutes:
- Chemical insecticides represent the primary substitute, though the growing awareness of environmental and health concerns is favoring pheromones.
- Biopesticides are also competing alternatives, offering environmentally friendly solutions.
End-User Segmentation:
- Significant demand from agricultural sector across various crops.
- Growing adoption among research institutions and government agencies for monitoring pest populations.
M&A Trends:
- Consolidation among major players expected to increase in the next few years.
- Estimated M&A transaction value in the past five years: xx Million. These activities will likely focus on expanding product portfolios and geographic reach.
IPM Pheromone Products Industry Market Trends & Opportunities
The global IPM pheromone products market is experiencing robust growth, driven by the increasing adoption of sustainable pest management practices. The market size is projected to grow at a Compound Annual Growth Rate (CAGR) of xx% from 2025 to 2033, reaching a projected xx Million by 2033. Technological advancements, evolving consumer preferences favoring eco-friendly solutions, and supportive government regulations are significantly contributing to this growth. This trend is particularly noticeable in regions with stringent pesticide regulations and a high emphasis on organic farming. Market penetration is expected to increase significantly as awareness of the benefits of pheromones grows, particularly among smaller farmers. This surge is being fuelled by increased investment in R&D and the emergence of innovative product formulations. The competitive landscape remains dynamic, with existing players expanding their product lines and new entrants emerging.
Dominant Markets & Segments in IPM Pheromone Products Industry
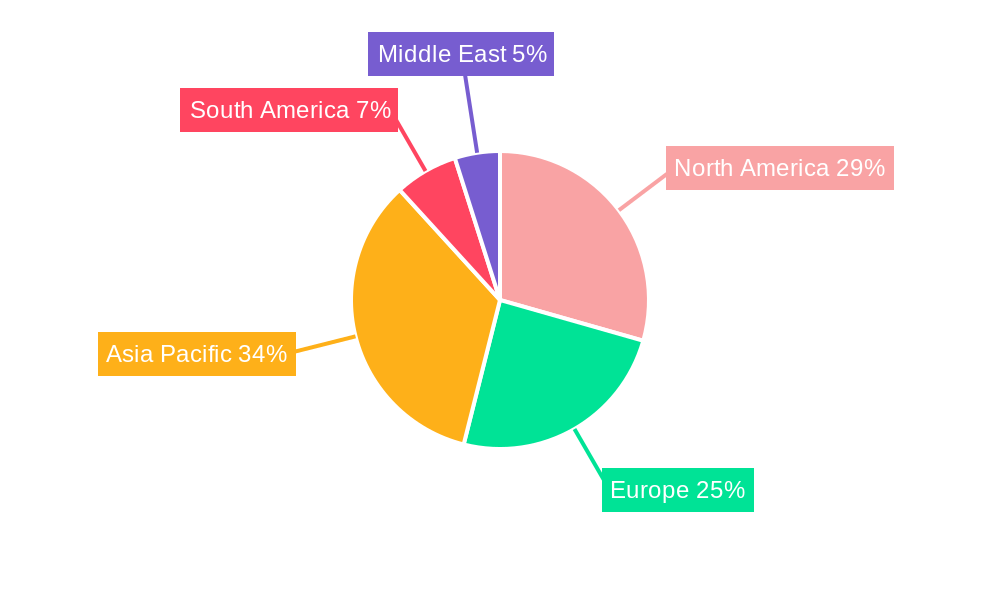
The market for IPM pheromone products shows significant regional variations, with North America and Europe currently dominating. However, Asia-Pacific is projected to experience substantial growth driven by expanding agricultural activities and increasing awareness of sustainable pest management. Within the segment breakdown, the mating disruption function enjoys the largest market share due to its effectiveness and wide applicability across various crops.
By Type:
- Pheromones: This segment holds the largest market share due to its extensive application in various pest management strategies.
- Aggregation pheromones: This segment is growing steadily, driven by its effectiveness in monitoring and controlling specific pest populations.
- Others: This category comprises specialized pheromone products targeting niche pest populations.
By Function:
- Mating Disruption: This is the dominant function, capturing the largest share due to its environmental friendliness and efficacy.
- Detection and monitoring: This function is crucial for early pest detection and proactive management strategies.
- Mass Trapping: This method is gaining traction, though its application is currently limited to specific pests and situations.
By Mode of Application:
- Traps: This remains a common application method for pheromones.
- Dispensers: This method is growing in popularity for its extended release capability and ease of use.
- Prayers: Though less common, specific scenarios require this application method.
By Crops:
- Field Crops: This segment represents a significant portion of the market, with substantial demand for pheromone-based solutions.
- Vegetable Crops: This segment exhibits strong growth due to high value and sensitivity to pest infestation.
- Other Crops: This comprises fruits, nuts, and other crops with specific pest management requirements.
Key Growth Drivers:
- Stringent regulations restricting the use of chemical pesticides are pushing the adoption of eco-friendly alternatives like pheromones.
- Growing consumer demand for organically grown produce and a greater awareness of environmental issues fuel the adoption of IPM strategies.
- Technological advances that result in improved pheromone synthesis, dispensing, and application methods.
IPM Pheromone Products Industry Product Analysis
Technological advancements are leading to more effective and targeted pheromone products. Innovations focus on improving pheromone formulations for enhanced attraction and increased longevity in the field. Advances in dispenser technology, such as controlled-release dispensers, offer extended application periods and improved efficacy. The market fit is strong due to the increasing demand for sustainable pest management solutions and the growing recognition of pheromones' effectiveness and environmental safety.
Key Drivers, Barriers & Challenges in IPM Pheromone Products Industry
Key Drivers:
- The increasing adoption of sustainable agricultural practices is a major driver for the market.
- Government regulations aiming to reduce the use of chemical pesticides are creating a favorable environment for the adoption of pheromones.
- Technological improvements leading to better pheromone synthesis and dispenser technology.
Challenges and Restraints:
- The high cost of pheromone production compared to conventional pesticides remains a barrier to widespread adoption, particularly in developing countries.
- The specific nature of pheromones—their effectiveness depending on target pest species and environmental conditions—limits their broad-spectrum application.
- Supply chain challenges, including sourcing and logistics, particularly for specialized pheromones, can impact product availability and market access.
Growth Drivers in the IPM Pheromone Products Industry Market
The market's expansion is propelled by the rising awareness of environmental hazards associated with conventional pesticides. Government initiatives supporting sustainable agriculture further stimulate demand. Technological progress in pheromone formulation and delivery systems improves efficacy and expands application possibilities, adding to market growth.
Challenges Impacting IPM Pheromone Products Industry Growth
Regulatory complexities and stringent approvals slow the introduction of new products. Fluctuations in raw material prices and logistical hurdles affect production costs and market accessibility. The competition from existing and emerging biopesticide technologies adds pressure to the market.
Key Players Shaping the IPM Pheromone Products Industry Market
- Russell IPM
- Suterr
- Syngenta Bioline
- Pacific Biocontrol Corporation
- ISCA Technologies
- Shin-Etsu
- Hercon Environmental
- Sumi Agro France
- Isagro
- BASF SE
Significant IPM Pheromone Products Industry Industry Milestones
- 2020: Syngenta Bioline launched a new pheromone dispenser with improved longevity.
- 2021: Russell IPM acquired a smaller pheromone producer, expanding its product portfolio.
- 2022: ISCA Technologies introduced a new pheromone blend for a major agricultural pest.
- 2023: Significant investments in R&D by several major players focused on enhancing pheromone efficacy and expanding application methods.
- 2024: Several new regulations were passed promoting the adoption of pheromones as a sustainable pest management tool.
Future Outlook for IPM Pheromone Products Industry Market
The IPM pheromone products market is poised for continued growth, driven by the increasing demand for sustainable pest management solutions and ongoing technological advancements. Strategic partnerships and collaborations among industry players are anticipated to further drive innovation and market expansion. The focus on developing environmentally friendly and effective pest control strategies will fuel the market's positive trajectory in the coming years.
IPM Pheromone Products Industry Segmentation
- 1. Production Analysis
- 2. Consumption Analysis
- 3. Import Market Analysis (Value & Volume)
- 4. Export Market Analysis (Value & Volume)
- 5. Price Trend Analysis
IPM Pheromone Products Industry Segmentation By Geography
-
1. North America
- 1.1. United States
- 1.2. Canada
- 1.3. Mexico
-
2. South America
- 2.1. Brazil
- 2.2. Argentina
- 2.3. Rest of South America
-
3. Europe
- 3.1. United Kingdom
- 3.2. Germany
- 3.3. France
- 3.4. Italy
- 3.5. Spain
- 3.6. Russia
- 3.7. Benelux
- 3.8. Nordics
- 3.9. Rest of Europe
-
4. Middle East & Africa
- 4.1. Turkey
- 4.2. Israel
- 4.3. GCC
- 4.4. North Africa
- 4.5. South Africa
- 4.6. Rest of Middle East & Africa
-
5. Asia Pacific
- 5.1. China
- 5.2. India
- 5.3. Japan
- 5.4. South Korea
- 5.5. ASEAN
- 5.6. Oceania
- 5.7. Rest of Asia Pacific
IPM Pheromone Products Industry Regional Market Share
Geographic Coverage of IPM Pheromone Products Industry
IPM Pheromone Products Industry REPORT HIGHLIGHTS
| Aspects | Details |
|---|---|
| Study Period | 2020-2034 |
| Base Year | 2025 |
| Estimated Year | 2026 |
| Forecast Period | 2026-2034 |
| Historical Period | 2020-2025 |
| Growth Rate | CAGR of 10.50% from 2020-2034 |
| Segmentation |
|
Table of Contents
- 1. Introduction
- 1.1. Research Scope
- 1.2. Market Segmentation
- 1.3. Research Methodology
- 1.4. Definitions and Assumptions
- 2. Executive Summary
- 2.1. Introduction
- 3. Market Dynamics
- 3.1. Introduction
- 3.2. Market Drivers
- 3.2.1. Decreasing Per Capita Arable Land; Increased Demand for Food
- 3.3. Market Restrains
- 3.3.1. High Initial Investments; Requirement of Precision Agriculture
- 3.4. Market Trends
- 3.4.1. Strong Demand for High-Value Crops
- 4. Market Factor Analysis
- 4.1. Porters Five Forces
- 4.2. Supply/Value Chain
- 4.3. PESTEL analysis
- 4.4. Market Entropy
- 4.5. Patent/Trademark Analysis
- 5. Global IPM Pheromone Products Industry Analysis, Insights and Forecast, 2020-2032
- 5.1. Market Analysis, Insights and Forecast - by Production Analysis
- 5.2. Market Analysis, Insights and Forecast - by Consumption Analysis
- 5.3. Market Analysis, Insights and Forecast - by Import Market Analysis (Value & Volume)
- 5.4. Market Analysis, Insights and Forecast - by Export Market Analysis (Value & Volume)
- 5.5. Market Analysis, Insights and Forecast - by Price Trend Analysis
- 5.6. Market Analysis, Insights and Forecast - by Region
- 5.6.1. North America
- 5.6.2. South America
- 5.6.3. Europe
- 5.6.4. Middle East & Africa
- 5.6.5. Asia Pacific
- 5.1. Market Analysis, Insights and Forecast - by Production Analysis
- 6. North America IPM Pheromone Products Industry Analysis, Insights and Forecast, 2020-2032
- 6.1. Market Analysis, Insights and Forecast - by Production Analysis
- 6.2. Market Analysis, Insights and Forecast - by Consumption Analysis
- 6.3. Market Analysis, Insights and Forecast - by Import Market Analysis (Value & Volume)
- 6.4. Market Analysis, Insights and Forecast - by Export Market Analysis (Value & Volume)
- 6.5. Market Analysis, Insights and Forecast - by Price Trend Analysis
- 6.1. Market Analysis, Insights and Forecast - by Production Analysis
- 7. South America IPM Pheromone Products Industry Analysis, Insights and Forecast, 2020-2032
- 7.1. Market Analysis, Insights and Forecast - by Production Analysis
- 7.2. Market Analysis, Insights and Forecast - by Consumption Analysis
- 7.3. Market Analysis, Insights and Forecast - by Import Market Analysis (Value & Volume)
- 7.4. Market Analysis, Insights and Forecast - by Export Market Analysis (Value & Volume)
- 7.5. Market Analysis, Insights and Forecast - by Price Trend Analysis
- 7.1. Market Analysis, Insights and Forecast - by Production Analysis
- 8. Europe IPM Pheromone Products Industry Analysis, Insights and Forecast, 2020-2032
- 8.1. Market Analysis, Insights and Forecast - by Production Analysis
- 8.2. Market Analysis, Insights and Forecast - by Consumption Analysis
- 8.3. Market Analysis, Insights and Forecast - by Import Market Analysis (Value & Volume)
- 8.4. Market Analysis, Insights and Forecast - by Export Market Analysis (Value & Volume)
- 8.5. Market Analysis, Insights and Forecast - by Price Trend Analysis
- 8.1. Market Analysis, Insights and Forecast - by Production Analysis
- 9. Middle East & Africa IPM Pheromone Products Industry Analysis, Insights and Forecast, 2020-2032
- 9.1. Market Analysis, Insights and Forecast - by Production Analysis
- 9.2. Market Analysis, Insights and Forecast - by Consumption Analysis
- 9.3. Market Analysis, Insights and Forecast - by Import Market Analysis (Value & Volume)
- 9.4. Market Analysis, Insights and Forecast - by Export Market Analysis (Value & Volume)
- 9.5. Market Analysis, Insights and Forecast - by Price Trend Analysis
- 9.1. Market Analysis, Insights and Forecast - by Production Analysis
- 10. Asia Pacific IPM Pheromone Products Industry Analysis, Insights and Forecast, 2020-2032
- 10.1. Market Analysis, Insights and Forecast - by Production Analysis
- 10.2. Market Analysis, Insights and Forecast - by Consumption Analysis
- 10.3. Market Analysis, Insights and Forecast - by Import Market Analysis (Value & Volume)
- 10.4. Market Analysis, Insights and Forecast - by Export Market Analysis (Value & Volume)
- 10.5. Market Analysis, Insights and Forecast - by Price Trend Analysis
- 10.1. Market Analysis, Insights and Forecast - by Production Analysis
- 11. Competitive Analysis
- 11.1. Global Market Share Analysis 2025
- 11.2. Company Profiles
- 11.2.1 Russell IPM
- 11.2.1.1. Overview
- 11.2.1.2. Products
- 11.2.1.3. SWOT Analysis
- 11.2.1.4. Recent Developments
- 11.2.1.5. Financials (Based on Availability)
- 11.2.2 Suterr
- 11.2.2.1. Overview
- 11.2.2.2. Products
- 11.2.2.3. SWOT Analysis
- 11.2.2.4. Recent Developments
- 11.2.2.5. Financials (Based on Availability)
- 11.2.3 Syngenta Bioline
- 11.2.3.1. Overview
- 11.2.3.2. Products
- 11.2.3.3. SWOT Analysis
- 11.2.3.4. Recent Developments
- 11.2.3.5. Financials (Based on Availability)
- 11.2.4 Pacific Biocontrol Corporation
- 11.2.4.1. Overview
- 11.2.4.2. Products
- 11.2.4.3. SWOT Analysis
- 11.2.4.4. Recent Developments
- 11.2.4.5. Financials (Based on Availability)
- 11.2.5 ISCA Technologies
- 11.2.5.1. Overview
- 11.2.5.2. Products
- 11.2.5.3. SWOT Analysis
- 11.2.5.4. Recent Developments
- 11.2.5.5. Financials (Based on Availability)
- 11.2.6 Shin-Etsu
- 11.2.6.1. Overview
- 11.2.6.2. Products
- 11.2.6.3. SWOT Analysis
- 11.2.6.4. Recent Developments
- 11.2.6.5. Financials (Based on Availability)
- 11.2.7 Hercon Environmental
- 11.2.7.1. Overview
- 11.2.7.2. Products
- 11.2.7.3. SWOT Analysis
- 11.2.7.4. Recent Developments
- 11.2.7.5. Financials (Based on Availability)
- 11.2.8 Sumi Agro France
- 11.2.8.1. Overview
- 11.2.8.2. Products
- 11.2.8.3. SWOT Analysis
- 11.2.8.4. Recent Developments
- 11.2.8.5. Financials (Based on Availability)
- 11.2.9 Isagro
- 11.2.9.1. Overview
- 11.2.9.2. Products
- 11.2.9.3. SWOT Analysis
- 11.2.9.4. Recent Developments
- 11.2.9.5. Financials (Based on Availability)
- 11.2.10 BASF SE
- 11.2.10.1. Overview
- 11.2.10.2. Products
- 11.2.10.3. SWOT Analysis
- 11.2.10.4. Recent Developments
- 11.2.10.5. Financials (Based on Availability)
- 11.2.1 Russell IPM
List of Figures
- Figure 1: Global IPM Pheromone Products Industry Revenue Breakdown (Million, %) by Region 2025 & 2033
- Figure 2: North America IPM Pheromone Products Industry Revenue (Million), by Production Analysis 2025 & 2033
- Figure 3: North America IPM Pheromone Products Industry Revenue Share (%), by Production Analysis 2025 & 2033
- Figure 4: North America IPM Pheromone Products Industry Revenue (Million), by Consumption Analysis 2025 & 2033
- Figure 5: North America IPM Pheromone Products Industry Revenue Share (%), by Consumption Analysis 2025 & 2033
- Figure 6: North America IPM Pheromone Products Industry Revenue (Million), by Import Market Analysis (Value & Volume) 2025 & 2033
- Figure 7: North America IPM Pheromone Products Industry Revenue Share (%), by Import Market Analysis (Value & Volume) 2025 & 2033
- Figure 8: North America IPM Pheromone Products Industry Revenue (Million), by Export Market Analysis (Value & Volume) 2025 & 2033
- Figure 9: North America IPM Pheromone Products Industry Revenue Share (%), by Export Market Analysis (Value & Volume) 2025 & 2033
- Figure 10: North America IPM Pheromone Products Industry Revenue (Million), by Price Trend Analysis 2025 & 2033
- Figure 11: North America IPM Pheromone Products Industry Revenue Share (%), by Price Trend Analysis 2025 & 2033
- Figure 12: North America IPM Pheromone Products Industry Revenue (Million), by Country 2025 & 2033
- Figure 13: North America IPM Pheromone Products Industry Revenue Share (%), by Country 2025 & 2033
- Figure 14: South America IPM Pheromone Products Industry Revenue (Million), by Production Analysis 2025 & 2033
- Figure 15: South America IPM Pheromone Products Industry Revenue Share (%), by Production Analysis 2025 & 2033
- Figure 16: South America IPM Pheromone Products Industry Revenue (Million), by Consumption Analysis 2025 & 2033
- Figure 17: South America IPM Pheromone Products Industry Revenue Share (%), by Consumption Analysis 2025 & 2033
- Figure 18: South America IPM Pheromone Products Industry Revenue (Million), by Import Market Analysis (Value & Volume) 2025 & 2033
- Figure 19: South America IPM Pheromone Products Industry Revenue Share (%), by Import Market Analysis (Value & Volume) 2025 & 2033
- Figure 20: South America IPM Pheromone Products Industry Revenue (Million), by Export Market Analysis (Value & Volume) 2025 & 2033
- Figure 21: South America IPM Pheromone Products Industry Revenue Share (%), by Export Market Analysis (Value & Volume) 2025 & 2033
- Figure 22: South America IPM Pheromone Products Industry Revenue (Million), by Price Trend Analysis 2025 & 2033
- Figure 23: South America IPM Pheromone Products Industry Revenue Share (%), by Price Trend Analysis 2025 & 2033
- Figure 24: South America IPM Pheromone Products Industry Revenue (Million), by Country 2025 & 2033
- Figure 25: South America IPM Pheromone Products Industry Revenue Share (%), by Country 2025 & 2033
- Figure 26: Europe IPM Pheromone Products Industry Revenue (Million), by Production Analysis 2025 & 2033
- Figure 27: Europe IPM Pheromone Products Industry Revenue Share (%), by Production Analysis 2025 & 2033
- Figure 28: Europe IPM Pheromone Products Industry Revenue (Million), by Consumption Analysis 2025 & 2033
- Figure 29: Europe IPM Pheromone Products Industry Revenue Share (%), by Consumption Analysis 2025 & 2033
- Figure 30: Europe IPM Pheromone Products Industry Revenue (Million), by Import Market Analysis (Value & Volume) 2025 & 2033
- Figure 31: Europe IPM Pheromone Products Industry Revenue Share (%), by Import Market Analysis (Value & Volume) 2025 & 2033
- Figure 32: Europe IPM Pheromone Products Industry Revenue (Million), by Export Market Analysis (Value & Volume) 2025 & 2033
- Figure 33: Europe IPM Pheromone Products Industry Revenue Share (%), by Export Market Analysis (Value & Volume) 2025 & 2033
- Figure 34: Europe IPM Pheromone Products Industry Revenue (Million), by Price Trend Analysis 2025 & 2033
- Figure 35: Europe IPM Pheromone Products Industry Revenue Share (%), by Price Trend Analysis 2025 & 2033
- Figure 36: Europe IPM Pheromone Products Industry Revenue (Million), by Country 2025 & 2033
- Figure 37: Europe IPM Pheromone Products Industry Revenue Share (%), by Country 2025 & 2033
- Figure 38: Middle East & Africa IPM Pheromone Products Industry Revenue (Million), by Production Analysis 2025 & 2033
- Figure 39: Middle East & Africa IPM Pheromone Products Industry Revenue Share (%), by Production Analysis 2025 & 2033
- Figure 40: Middle East & Africa IPM Pheromone Products Industry Revenue (Million), by Consumption Analysis 2025 & 2033
- Figure 41: Middle East & Africa IPM Pheromone Products Industry Revenue Share (%), by Consumption Analysis 2025 & 2033
- Figure 42: Middle East & Africa IPM Pheromone Products Industry Revenue (Million), by Import Market Analysis (Value & Volume) 2025 & 2033
- Figure 43: Middle East & Africa IPM Pheromone Products Industry Revenue Share (%), by Import Market Analysis (Value & Volume) 2025 & 2033
- Figure 44: Middle East & Africa IPM Pheromone Products Industry Revenue (Million), by Export Market Analysis (Value & Volume) 2025 & 2033
- Figure 45: Middle East & Africa IPM Pheromone Products Industry Revenue Share (%), by Export Market Analysis (Value & Volume) 2025 & 2033
- Figure 46: Middle East & Africa IPM Pheromone Products Industry Revenue (Million), by Price Trend Analysis 2025 & 2033
- Figure 47: Middle East & Africa IPM Pheromone Products Industry Revenue Share (%), by Price Trend Analysis 2025 & 2033
- Figure 48: Middle East & Africa IPM Pheromone Products Industry Revenue (Million), by Country 2025 & 2033
- Figure 49: Middle East & Africa IPM Pheromone Products Industry Revenue Share (%), by Country 2025 & 2033
- Figure 50: Asia Pacific IPM Pheromone Products Industry Revenue (Million), by Production Analysis 2025 & 2033
- Figure 51: Asia Pacific IPM Pheromone Products Industry Revenue Share (%), by Production Analysis 2025 & 2033
- Figure 52: Asia Pacific IPM Pheromone Products Industry Revenue (Million), by Consumption Analysis 2025 & 2033
- Figure 53: Asia Pacific IPM Pheromone Products Industry Revenue Share (%), by Consumption Analysis 2025 & 2033
- Figure 54: Asia Pacific IPM Pheromone Products Industry Revenue (Million), by Import Market Analysis (Value & Volume) 2025 & 2033
- Figure 55: Asia Pacific IPM Pheromone Products Industry Revenue Share (%), by Import Market Analysis (Value & Volume) 2025 & 2033
- Figure 56: Asia Pacific IPM Pheromone Products Industry Revenue (Million), by Export Market Analysis (Value & Volume) 2025 & 2033
- Figure 57: Asia Pacific IPM Pheromone Products Industry Revenue Share (%), by Export Market Analysis (Value & Volume) 2025 & 2033
- Figure 58: Asia Pacific IPM Pheromone Products Industry Revenue (Million), by Price Trend Analysis 2025 & 2033
- Figure 59: Asia Pacific IPM Pheromone Products Industry Revenue Share (%), by Price Trend Analysis 2025 & 2033
- Figure 60: Asia Pacific IPM Pheromone Products Industry Revenue (Million), by Country 2025 & 2033
- Figure 61: Asia Pacific IPM Pheromone Products Industry Revenue Share (%), by Country 2025 & 2033
List of Tables
- Table 1: Global IPM Pheromone Products Industry Revenue Million Forecast, by Production Analysis 2020 & 2033
- Table 2: Global IPM Pheromone Products Industry Revenue Million Forecast, by Consumption Analysis 2020 & 2033
- Table 3: Global IPM Pheromone Products Industry Revenue Million Forecast, by Import Market Analysis (Value & Volume) 2020 & 2033
- Table 4: Global IPM Pheromone Products Industry Revenue Million Forecast, by Export Market Analysis (Value & Volume) 2020 & 2033
- Table 5: Global IPM Pheromone Products Industry Revenue Million Forecast, by Price Trend Analysis 2020 & 2033
- Table 6: Global IPM Pheromone Products Industry Revenue Million Forecast, by Region 2020 & 2033
- Table 7: Global IPM Pheromone Products Industry Revenue Million Forecast, by Production Analysis 2020 & 2033
- Table 8: Global IPM Pheromone Products Industry Revenue Million Forecast, by Consumption Analysis 2020 & 2033
- Table 9: Global IPM Pheromone Products Industry Revenue Million Forecast, by Import Market Analysis (Value & Volume) 2020 & 2033
- Table 10: Global IPM Pheromone Products Industry Revenue Million Forecast, by Export Market Analysis (Value & Volume) 2020 & 2033
- Table 11: Global IPM Pheromone Products Industry Revenue Million Forecast, by Price Trend Analysis 2020 & 2033
- Table 12: Global IPM Pheromone Products Industry Revenue Million Forecast, by Country 2020 & 2033
- Table 13: United States IPM Pheromone Products Industry Revenue (Million) Forecast, by Application 2020 & 2033
- Table 14: Canada IPM Pheromone Products Industry Revenue (Million) Forecast, by Application 2020 & 2033
- Table 15: Mexico IPM Pheromone Products Industry Revenue (Million) Forecast, by Application 2020 & 2033
- Table 16: Global IPM Pheromone Products Industry Revenue Million Forecast, by Production Analysis 2020 & 2033
- Table 17: Global IPM Pheromone Products Industry Revenue Million Forecast, by Consumption Analysis 2020 & 2033
- Table 18: Global IPM Pheromone Products Industry Revenue Million Forecast, by Import Market Analysis (Value & Volume) 2020 & 2033
- Table 19: Global IPM Pheromone Products Industry Revenue Million Forecast, by Export Market Analysis (Value & Volume) 2020 & 2033
- Table 20: Global IPM Pheromone Products Industry Revenue Million Forecast, by Price Trend Analysis 2020 & 2033
- Table 21: Global IPM Pheromone Products Industry Revenue Million Forecast, by Country 2020 & 2033
- Table 22: Brazil IPM Pheromone Products Industry Revenue (Million) Forecast, by Application 2020 & 2033
- Table 23: Argentina IPM Pheromone Products Industry Revenue (Million) Forecast, by Application 2020 & 2033
- Table 24: Rest of South America IPM Pheromone Products Industry Revenue (Million) Forecast, by Application 2020 & 2033
- Table 25: Global IPM Pheromone Products Industry Revenue Million Forecast, by Production Analysis 2020 & 2033
- Table 26: Global IPM Pheromone Products Industry Revenue Million Forecast, by Consumption Analysis 2020 & 2033
- Table 27: Global IPM Pheromone Products Industry Revenue Million Forecast, by Import Market Analysis (Value & Volume) 2020 & 2033
- Table 28: Global IPM Pheromone Products Industry Revenue Million Forecast, by Export Market Analysis (Value & Volume) 2020 & 2033
- Table 29: Global IPM Pheromone Products Industry Revenue Million Forecast, by Price Trend Analysis 2020 & 2033
- Table 30: Global IPM Pheromone Products Industry Revenue Million Forecast, by Country 2020 & 2033
- Table 31: United Kingdom IPM Pheromone Products Industry Revenue (Million) Forecast, by Application 2020 & 2033
- Table 32: Germany IPM Pheromone Products Industry Revenue (Million) Forecast, by Application 2020 & 2033
- Table 33: France IPM Pheromone Products Industry Revenue (Million) Forecast, by Application 2020 & 2033
- Table 34: Italy IPM Pheromone Products Industry Revenue (Million) Forecast, by Application 2020 & 2033
- Table 35: Spain IPM Pheromone Products Industry Revenue (Million) Forecast, by Application 2020 & 2033
- Table 36: Russia IPM Pheromone Products Industry Revenue (Million) Forecast, by Application 2020 & 2033
- Table 37: Benelux IPM Pheromone Products Industry Revenue (Million) Forecast, by Application 2020 & 2033
- Table 38: Nordics IPM Pheromone Products Industry Revenue (Million) Forecast, by Application 2020 & 2033
- Table 39: Rest of Europe IPM Pheromone Products Industry Revenue (Million) Forecast, by Application 2020 & 2033
- Table 40: Global IPM Pheromone Products Industry Revenue Million Forecast, by Production Analysis 2020 & 2033
- Table 41: Global IPM Pheromone Products Industry Revenue Million Forecast, by Consumption Analysis 2020 & 2033
- Table 42: Global IPM Pheromone Products Industry Revenue Million Forecast, by Import Market Analysis (Value & Volume) 2020 & 2033
- Table 43: Global IPM Pheromone Products Industry Revenue Million Forecast, by Export Market Analysis (Value & Volume) 2020 & 2033
- Table 44: Global IPM Pheromone Products Industry Revenue Million Forecast, by Price Trend Analysis 2020 & 2033
- Table 45: Global IPM Pheromone Products Industry Revenue Million Forecast, by Country 2020 & 2033
- Table 46: Turkey IPM Pheromone Products Industry Revenue (Million) Forecast, by Application 2020 & 2033
- Table 47: Israel IPM Pheromone Products Industry Revenue (Million) Forecast, by Application 2020 & 2033
- Table 48: GCC IPM Pheromone Products Industry Revenue (Million) Forecast, by Application 2020 & 2033
- Table 49: North Africa IPM Pheromone Products Industry Revenue (Million) Forecast, by Application 2020 & 2033
- Table 50: South Africa IPM Pheromone Products Industry Revenue (Million) Forecast, by Application 2020 & 2033
- Table 51: Rest of Middle East & Africa IPM Pheromone Products Industry Revenue (Million) Forecast, by Application 2020 & 2033
- Table 52: Global IPM Pheromone Products Industry Revenue Million Forecast, by Production Analysis 2020 & 2033
- Table 53: Global IPM Pheromone Products Industry Revenue Million Forecast, by Consumption Analysis 2020 & 2033
- Table 54: Global IPM Pheromone Products Industry Revenue Million Forecast, by Import Market Analysis (Value & Volume) 2020 & 2033
- Table 55: Global IPM Pheromone Products Industry Revenue Million Forecast, by Export Market Analysis (Value & Volume) 2020 & 2033
- Table 56: Global IPM Pheromone Products Industry Revenue Million Forecast, by Price Trend Analysis 2020 & 2033
- Table 57: Global IPM Pheromone Products Industry Revenue Million Forecast, by Country 2020 & 2033
- Table 58: China IPM Pheromone Products Industry Revenue (Million) Forecast, by Application 2020 & 2033
- Table 59: India IPM Pheromone Products Industry Revenue (Million) Forecast, by Application 2020 & 2033
- Table 60: Japan IPM Pheromone Products Industry Revenue (Million) Forecast, by Application 2020 & 2033
- Table 61: South Korea IPM Pheromone Products Industry Revenue (Million) Forecast, by Application 2020 & 2033
- Table 62: ASEAN IPM Pheromone Products Industry Revenue (Million) Forecast, by Application 2020 & 2033
- Table 63: Oceania IPM Pheromone Products Industry Revenue (Million) Forecast, by Application 2020 & 2033
- Table 64: Rest of Asia Pacific IPM Pheromone Products Industry Revenue (Million) Forecast, by Application 2020 & 2033
Frequently Asked Questions
1. What is the projected Compound Annual Growth Rate (CAGR) of the IPM Pheromone Products Industry?
The projected CAGR is approximately 10.50%.
2. Which companies are prominent players in the IPM Pheromone Products Industry?
Key companies in the market include Russell IPM, Suterr, Syngenta Bioline, Pacific Biocontrol Corporation, ISCA Technologies, Shin-Etsu, Hercon Environmental, Sumi Agro France, Isagro, BASF SE.
3. What are the main segments of the IPM Pheromone Products Industry?
The market segments include Production Analysis, Consumption Analysis, Import Market Analysis (Value & Volume), Export Market Analysis (Value & Volume), Price Trend Analysis.
4. Can you provide details about the market size?
The market size is estimated to be USD 1.02 Million as of 2022.
5. What are some drivers contributing to market growth?
Decreasing Per Capita Arable Land; Increased Demand for Food.
6. What are the notable trends driving market growth?
Strong Demand for High-Value Crops.
7. Are there any restraints impacting market growth?
High Initial Investments; Requirement of Precision Agriculture.
8. Can you provide examples of recent developments in the market?
N/A
9. What pricing options are available for accessing the report?
Pricing options include single-user, multi-user, and enterprise licenses priced at USD 3800, USD 4500, and USD 5800 respectively.
10. Is the market size provided in terms of value or volume?
The market size is provided in terms of value, measured in Million.
11. Are there any specific market keywords associated with the report?
Yes, the market keyword associated with the report is "IPM Pheromone Products Industry," which aids in identifying and referencing the specific market segment covered.
12. How do I determine which pricing option suits my needs best?
The pricing options vary based on user requirements and access needs. Individual users may opt for single-user licenses, while businesses requiring broader access may choose multi-user or enterprise licenses for cost-effective access to the report.
13. Are there any additional resources or data provided in the IPM Pheromone Products Industry report?
While the report offers comprehensive insights, it's advisable to review the specific contents or supplementary materials provided to ascertain if additional resources or data are available.
14. How can I stay updated on further developments or reports in the IPM Pheromone Products Industry?
To stay informed about further developments, trends, and reports in the IPM Pheromone Products Industry, consider subscribing to industry newsletters, following relevant companies and organizations, or regularly checking reputable industry news sources and publications.
Methodology
Step 1 - Identification of Relevant Samples Size from Population Database


Step 2 - Approaches for Defining Global Market Size (Value, Volume* & Price*)

Note*: In applicable scenarios
Step 3 - Data Sources
Primary Research
- Web Analytics
- Survey Reports
- Research Institute
- Latest Research Reports
- Opinion Leaders
Secondary Research
- Annual Reports
- White Paper
- Latest Press Release
- Industry Association
- Paid Database
- Investor Presentations

Step 4 - Data Triangulation
Involves using different sources of information in order to increase the validity of a study
These sources are likely to be stakeholders in a program - participants, other researchers, program staff, other community members, and so on.
Then we put all data in single framework & apply various statistical tools to find out the dynamic on the market.
During the analysis stage, feedback from the stakeholder groups would be compared to determine areas of agreement as well as areas of divergence