

Key Insights
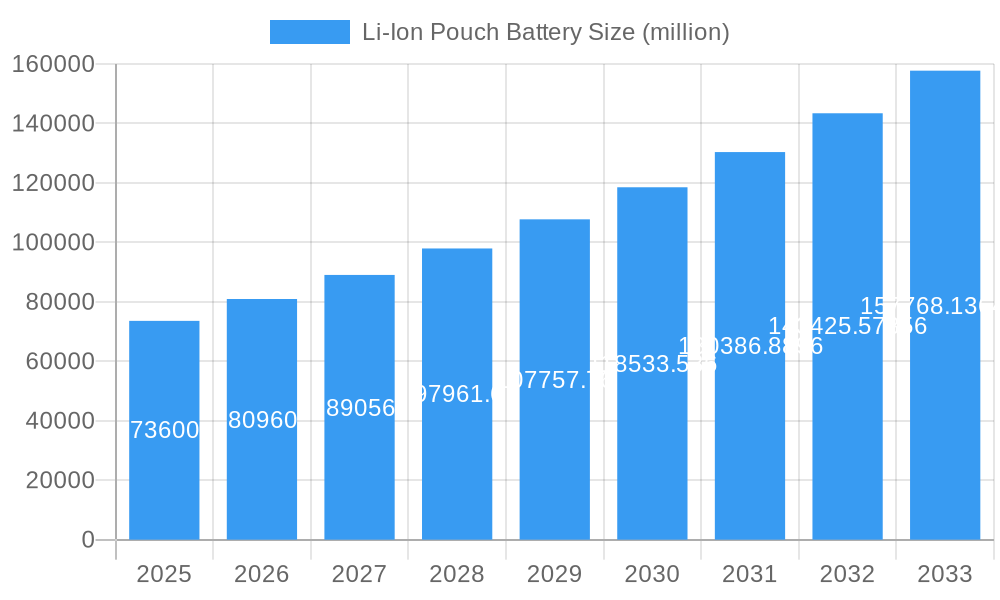
The global Li-Ion Pouch Battery market is poised for significant expansion, projected to reach an estimated USD 73.6 billion in 2025. This robust growth is fueled by a compelling compound annual growth rate (CAGR) of 10% over the forecast period of 2025-2033. A primary driver for this surge is the escalating demand from the electric vehicle (EV) sector, where the lightweight and flexible nature of pouch cells offers distinct advantages in terms of energy density and design freedom. Furthermore, the proliferation of consumer electronics, including smartphones, laptops, and wearables, continues to underpin market expansion, as manufacturers increasingly opt for pouch batteries to achieve sleeker and more compact device designs. The increasing adoption of robots in various industries, from manufacturing to logistics, also contributes to this upward trajectory, as these automated systems often rely on high-performance and custom-shaped battery solutions.
Li-Ion Pouch Battery Market Size (In Billion)
The market is characterized by several dynamic trends. The burgeoning demand for higher energy density and faster charging capabilities is driving innovation in battery chemistries, with Lithium Nickel Manganese Cobalt Oxide (NMC) and advanced Lithium Cobalt Oxide (LCO) formulations emerging as key players. Simultaneously, manufacturers are increasingly focusing on enhancing battery safety and longevity, addressing concerns related to thermal runaway and cycle life. While the market shows immense promise, certain restraints exist, primarily related to the cost of raw materials, such as lithium and cobalt, and the complexities associated with recycling and disposal of used batteries. However, ongoing research and development efforts aimed at reducing production costs and improving recycling infrastructure are expected to mitigate these challenges, paving the way for sustained and accelerated market growth in the coming years.
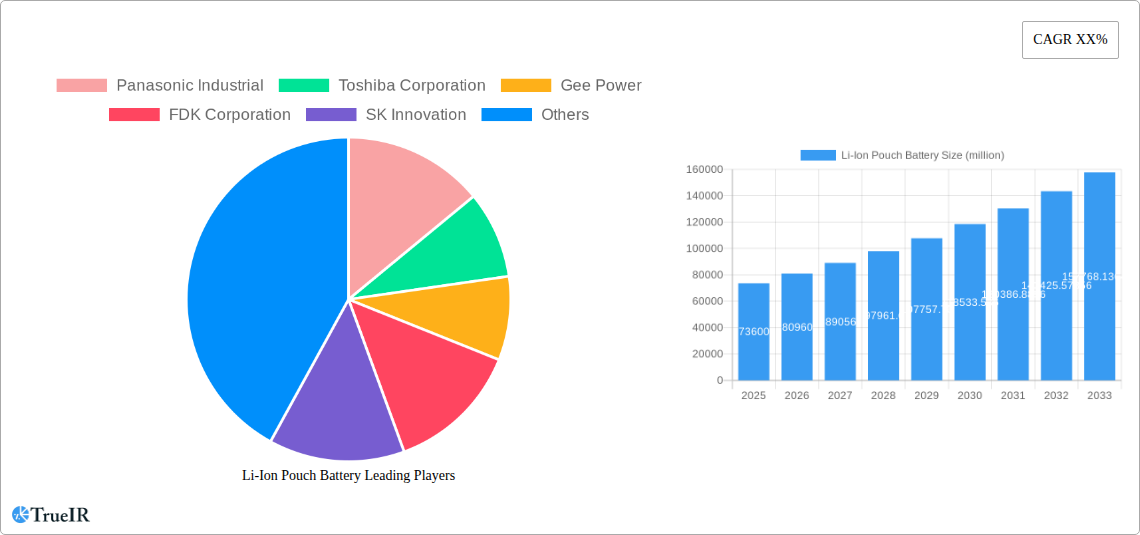
Li-Ion Pouch Battery Company Market Share
This in-depth report provides a critical analysis of the global Li-Ion Pouch Battery market, offering a comprehensive outlook for the period 2019–2033. Covering historical trends, current market dynamics, and future projections, this report is an indispensable resource for stakeholders seeking to understand the intricate landscape of advanced battery solutions. With a base year of 2025 and a forecast period extending to 2033, our analysis delves into market segmentation by application and battery type, identifies dominant regions, and scrutinizes product innovations. We dissect key drivers, persistent challenges, and pivotal industry developments, while a detailed competitive analysis profiles major players shaping the market. This report empowers strategic decision-making for manufacturers, investors, and technology providers in the rapidly evolving Li-Ion pouch battery sector.
Li-Ion Pouch Battery Market Structure & Competitive Landscape
The Li-Ion Pouch Battery market exhibits a moderately concentrated structure, characterized by the presence of a few dominant global players and a growing number of specialized manufacturers. Innovation is primarily driven by advancements in energy density, charging speed, safety features, and cost reduction, fueled by substantial R&D investments. Regulatory impacts, particularly concerning environmental standards and battery safety certifications, are significant, influencing product development and market entry. Product substitutes, such as cylindrical and prismatic Li-ion batteries, and emerging solid-state battery technologies, present a competitive challenge, necessitating continuous improvement and differentiation. End-user segmentation is broad, spanning critical sectors like electric vehicles, consumer electronics, and industrial robotics, each with distinct performance requirements. Merger and acquisition (M&A) trends are active, as companies seek to expand their technological capabilities, secure supply chains, and gain market share. For instance, historical M&A volumes in the battery sector have reached billions of dollars annually, signaling consolidation efforts and strategic partnerships aimed at capturing a larger portion of the projected hundreds of billions market size. Concentration ratios among the top five players are estimated to be in the range of 70-80%, highlighting the competitive intensity and the importance of strategic alliances and technological prowess.
Li-Ion Pouch Battery Market Trends & Opportunities
The Li-Ion Pouch Battery market is poised for unprecedented growth, with projected market size reaching hundreds of billions by 2033, driven by a compound annual growth rate (CAGR) of 15-20% throughout the forecast period. This expansion is underpinned by a confluence of transformative trends. The accelerating adoption of electric vehicles (EVs) remains a primary catalyst, as pouch batteries offer superior form factor flexibility and lighter weight, crucial for optimizing EV range and design. Concurrently, the insatiable demand for portable electronic devices, from smartphones and laptops to advanced wearables and drones, continues to fuel market penetration. Technological shifts are dominated by the pursuit of higher energy densities, faster charging capabilities, and enhanced safety through improved electrolyte formulations and advanced cathode/anode materials. Innovations in solid-state electrolyte technologies, while still in early stages for mass production, represent a significant long-term opportunity for enhanced safety and performance. Consumer preferences are increasingly leaning towards devices with longer battery life and quicker charging times, directly impacting product development strategies. The competitive landscape is dynamic, with established giants and agile startups vying for market dominance. Strategic opportunities lie in developing next-generation pouch batteries with superior performance-to-cost ratios, focusing on sustainable manufacturing practices, and forging strong partnerships across the EV and consumer electronics value chains. The market penetration rate for pouch batteries in the EV segment alone is projected to exceed 90% by 2033.
Dominant Markets & Segments in Li-Ion Pouch Battery
The Li-Ion Pouch Battery market's dominance is significantly influenced by the Electric Car application and the Lithium Nickel Manganese Cobalt Oxide (NMC) type. Geographically, Asia-Pacific stands as the leading region, with China spearheading production and consumption, driven by its expansive EV manufacturing base and supportive government policies. The estimated market share for NMC chemistry within the pouch battery segment is projected to be over 70% by 2033, owing to its balanced performance characteristics.
- Electric Car Application:
- Key Growth Drivers: Government incentives for EV adoption, stringent emission regulations, declining battery costs, and expanding charging infrastructure are propelling the demand for Li-ion pouch batteries in electric vehicles.
- Market Dominance: The electric car segment is expected to account for over 75% of the total Li-ion pouch battery market revenue by 2033. The lightweight and flexible nature of pouch cells allows for better integration into vehicle designs, maximizing space utilization and contributing to overall vehicle efficiency.
- Lithium Nickel Manganese Cobalt Oxide (NMC) Type:
- Key Growth Drivers: NMC batteries offer a compelling balance of high energy density, good power output, and reasonable lifespan, making them ideal for demanding applications like EVs. Continuous improvements in cathode material technology are further enhancing their performance.
- Market Dominance: NMC batteries are the preferred choice for most EV manufacturers, driving their substantial market share. Advancements in nickel content within NMC cathodes are continuously pushing the boundaries of energy density.
- Regional Dominance (Asia-Pacific):
- Key Growth Drivers: Robust domestic EV markets, extensive battery manufacturing capabilities, and government support for renewable energy and electric mobility initiatives have cemented Asia-Pacific's leadership. Countries like China, South Korea, and Japan are at the forefront of production and innovation.
- Market Dominance: This region is anticipated to contribute over 60% of the global Li-ion pouch battery market value in the forecast period.
Li-Ion Pouch Battery Product Analysis
Li-ion pouch battery product innovations are centered on enhancing energy density for longer device runtimes, improving charging speeds to meet user expectations, and bolstering safety features through advanced materials and thermal management. Competitive advantages stem from their flexible form factor, enabling custom designs for a wide array of applications from sleek smartphones to high-performance electric vehicles. Manufacturers are increasingly focusing on chemistries like NMC variants with higher nickel content to maximize energy storage, and exploring silicon-based anodes for even greater capacity. The ability to tailor dimensions precisely for intricate designs gives pouch batteries a significant edge in niche applications where space is at a premium.
Key Drivers, Barriers & Challenges in Li-Ion Pouch Battery
Key Drivers: The Li-Ion Pouch Battery market is propelled by the escalating global demand for electric vehicles, driven by environmental regulations and government incentives. The rapid growth of portable electronic devices, including smartphones, laptops, and wearables, also significantly contributes to market expansion. Technological advancements in battery chemistries, leading to higher energy density, faster charging, and improved safety, are crucial. Economic factors such as declining manufacturing costs and economies of scale further fuel adoption. Policy-driven initiatives promoting clean energy and electrification are creating a favorable market environment.
Barriers & Challenges: Significant challenges include the volatile pricing and limited availability of key raw materials like lithium, cobalt, and nickel, impacting supply chain stability and cost. Intense competition and price pressures from established and emerging players create margin constraints. Regulatory hurdles related to battery safety standards, recycling, and disposal are becoming increasingly stringent. Furthermore, the development and scaling of next-generation battery technologies, while an opportunity, also present a challenge to existing production methods and require substantial investment. Supply chain disruptions, exacerbated by geopolitical factors, pose a considerable risk, potentially impacting production volumes and lead times, with estimated annual disruptions costing the industry billions.
Growth Drivers in the Li-Ion Pouch Battery Market
Key growth drivers for the Li-Ion Pouch Battery market include the accelerating global transition to electric mobility, spurred by government mandates and increasing consumer preference for sustainable transportation. Technological advancements in Li-ion chemistry, particularly the development of higher energy density cathode and anode materials, are critical. Economic factors such as the declining cost of battery production due to economies of scale and manufacturing efficiencies play a significant role. Furthermore, supportive government policies and incentives for EV adoption and renewable energy storage are creating a robust market environment. The burgeoning demand for advanced portable electronics, from smartphones to drones, also contributes significantly to market growth.
Challenges Impacting Li-Ion Pouch Battery Growth
Challenges impacting Li-Ion Pouch Battery growth are multifaceted. The volatility in the prices of key raw materials, such as lithium, cobalt, and nickel, poses a significant threat to cost predictability and profitability, with price fluctuations sometimes impacting raw material costs by over 30% annually. Supply chain disruptions, often caused by geopolitical instability and logistical complexities, can lead to production delays and increased lead times. Stringent and evolving regulatory frameworks concerning battery safety, recycling, and environmental impact add complexity and require continuous adaptation. Intense competition among numerous global manufacturers also drives down profit margins and necessitates constant innovation to maintain market share.
Key Players Shaping the Li-Ion Pouch Battery Market
- Panasonic Industrial
- Toshiba Corporation
- Gee Power
- FDK Corporation
- SK Innovation
- Bestgo B Vertical Partners West
- EPEC, LLC
- Enertech International
- A123 Systems
- FluxPower Battery
- SOLAREDGE e-MOBILITY
- CUSTOM CELLS ITZEHOE GMBH
- Fruedenberg Group
- Leclanche SA
- Echion Technologies
- YOK Energy
- Servovision
- DNK Power Company
- Amperex Technology
- Shenzhen Ace Battery
- Energy Innovation Group
- EVE Energy
Significant Li-Ion Pouch Battery Industry Milestones
- 2019: Increased investment in solid-state battery research and development by major automotive and battery manufacturers.
- 2020: Significant advancements in NMC 811 cathode chemistry, offering higher energy density for electric vehicles.
- 2021: Expansion of gigafactories by leading battery producers to meet surging demand, particularly for EV applications.
- 2022: Growing emphasis on battery recycling and second-life applications, driven by environmental concerns and resource scarcity.
- 2023: Breakthroughs in silicon anode technology for Li-ion batteries, promising substantial increases in energy capacity.
- 2024: Introduction of advanced thermal management systems for pouch batteries to enhance safety and performance in high-demand applications.
Future Outlook for Li-Ion Pouch Battery Market
The future outlook for the Li-Ion Pouch Battery market is exceptionally bright, fueled by ongoing technological innovation and robust demand across critical sectors. Strategic opportunities lie in the continuous enhancement of energy density and charging speeds, addressing the ever-growing needs of electric vehicles and portable electronics. The development of more sustainable and ethically sourced battery materials, coupled with advancements in recycling technologies, will be crucial for long-term market viability and regulatory compliance. Furthermore, the exploration of novel battery chemistries and solid-state technologies presents significant potential for disruptive advancements and market leadership. Collaboration across the value chain, from material suppliers to end-product manufacturers, will be key to navigating challenges and capitalizing on the immense growth potential, with the market size projected to reach hundreds of billions in the coming decade.
Li-Ion Pouch Battery Segmentation
-
1. Application
- 1.1. Electric Car
- 1.2. Cell Phone
- 1.3. Robot
- 1.4. Portable Electronic Device
- 1.5. Other
-
2. Types
- 2.1. Lithium Cobalt Oxide
- 2.2. Lithium Manganese Oxide
- 2.3. Lithium Nickel Manganese Cobalt Oxide
Li-Ion Pouch Battery Segmentation By Geography
-
1. North America
- 1.1. United States
- 1.2. Canada
- 1.3. Mexico
-
2. South America
- 2.1. Brazil
- 2.2. Argentina
- 2.3. Rest of South America
-
3. Europe
- 3.1. United Kingdom
- 3.2. Germany
- 3.3. France
- 3.4. Italy
- 3.5. Spain
- 3.6. Russia
- 3.7. Benelux
- 3.8. Nordics
- 3.9. Rest of Europe
-
4. Middle East & Africa
- 4.1. Turkey
- 4.2. Israel
- 4.3. GCC
- 4.4. North Africa
- 4.5. South Africa
- 4.6. Rest of Middle East & Africa
-
5. Asia Pacific
- 5.1. China
- 5.2. India
- 5.3. Japan
- 5.4. South Korea
- 5.5. ASEAN
- 5.6. Oceania
- 5.7. Rest of Asia Pacific
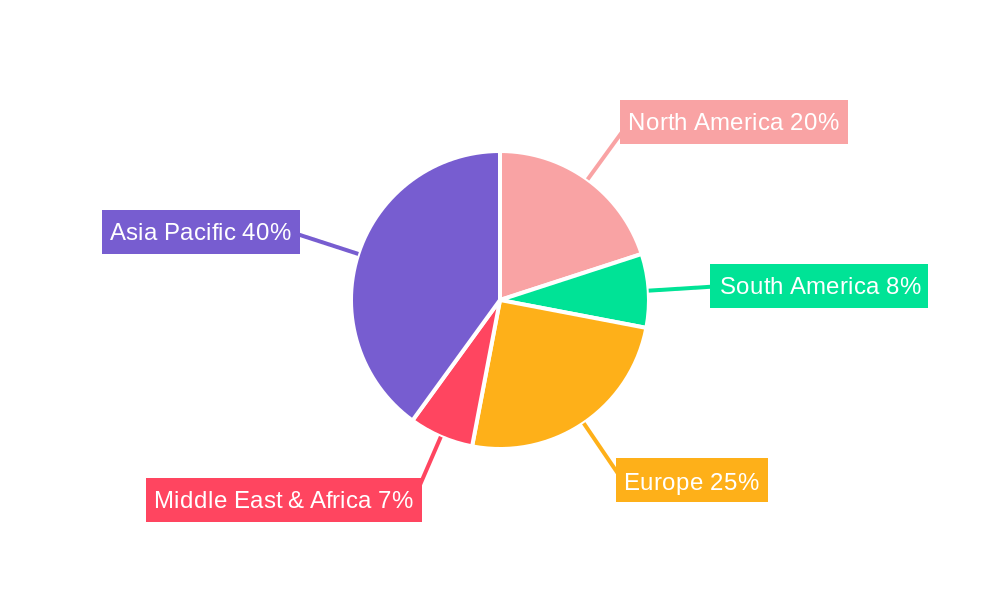
Li-Ion Pouch Battery Regional Market Share
Geographic Coverage of Li-Ion Pouch Battery
Li-Ion Pouch Battery REPORT HIGHLIGHTS
| Aspects | Details |
|---|---|
| Study Period | 2020-2034 |
| Base Year | 2025 |
| Estimated Year | 2026 |
| Forecast Period | 2026-2034 |
| Historical Period | 2020-2025 |
| Growth Rate | CAGR of 10% from 2020-2034 |
| Segmentation |
|
Table of Contents
- 1. Introduction
- 1.1. Research Scope
- 1.2. Market Segmentation
- 1.3. Research Methodology
- 1.4. Definitions and Assumptions
- 2. Executive Summary
- 2.1. Introduction
- 3. Market Dynamics
- 3.1. Introduction
- 3.2. Market Drivers
- 3.3. Market Restrains
- 3.4. Market Trends
- 4. Market Factor Analysis
- 4.1. Porters Five Forces
- 4.2. Supply/Value Chain
- 4.3. PESTEL analysis
- 4.4. Market Entropy
- 4.5. Patent/Trademark Analysis
- 5. Global Li-Ion Pouch Battery Analysis, Insights and Forecast, 2020-2032
- 5.1. Market Analysis, Insights and Forecast - by Application
- 5.1.1. Electric Car
- 5.1.2. Cell Phone
- 5.1.3. Robot
- 5.1.4. Portable Electronic Device
- 5.1.5. Other
- 5.2. Market Analysis, Insights and Forecast - by Types
- 5.2.1. Lithium Cobalt Oxide
- 5.2.2. Lithium Manganese Oxide
- 5.2.3. Lithium Nickel Manganese Cobalt Oxide
- 5.3. Market Analysis, Insights and Forecast - by Region
- 5.3.1. North America
- 5.3.2. South America
- 5.3.3. Europe
- 5.3.4. Middle East & Africa
- 5.3.5. Asia Pacific
- 5.1. Market Analysis, Insights and Forecast - by Application
- 6. North America Li-Ion Pouch Battery Analysis, Insights and Forecast, 2020-2032
- 6.1. Market Analysis, Insights and Forecast - by Application
- 6.1.1. Electric Car
- 6.1.2. Cell Phone
- 6.1.3. Robot
- 6.1.4. Portable Electronic Device
- 6.1.5. Other
- 6.2. Market Analysis, Insights and Forecast - by Types
- 6.2.1. Lithium Cobalt Oxide
- 6.2.2. Lithium Manganese Oxide
- 6.2.3. Lithium Nickel Manganese Cobalt Oxide
- 6.1. Market Analysis, Insights and Forecast - by Application
- 7. South America Li-Ion Pouch Battery Analysis, Insights and Forecast, 2020-2032
- 7.1. Market Analysis, Insights and Forecast - by Application
- 7.1.1. Electric Car
- 7.1.2. Cell Phone
- 7.1.3. Robot
- 7.1.4. Portable Electronic Device
- 7.1.5. Other
- 7.2. Market Analysis, Insights and Forecast - by Types
- 7.2.1. Lithium Cobalt Oxide
- 7.2.2. Lithium Manganese Oxide
- 7.2.3. Lithium Nickel Manganese Cobalt Oxide
- 7.1. Market Analysis, Insights and Forecast - by Application
- 8. Europe Li-Ion Pouch Battery Analysis, Insights and Forecast, 2020-2032
- 8.1. Market Analysis, Insights and Forecast - by Application
- 8.1.1. Electric Car
- 8.1.2. Cell Phone
- 8.1.3. Robot
- 8.1.4. Portable Electronic Device
- 8.1.5. Other
- 8.2. Market Analysis, Insights and Forecast - by Types
- 8.2.1. Lithium Cobalt Oxide
- 8.2.2. Lithium Manganese Oxide
- 8.2.3. Lithium Nickel Manganese Cobalt Oxide
- 8.1. Market Analysis, Insights and Forecast - by Application
- 9. Middle East & Africa Li-Ion Pouch Battery Analysis, Insights and Forecast, 2020-2032
- 9.1. Market Analysis, Insights and Forecast - by Application
- 9.1.1. Electric Car
- 9.1.2. Cell Phone
- 9.1.3. Robot
- 9.1.4. Portable Electronic Device
- 9.1.5. Other
- 9.2. Market Analysis, Insights and Forecast - by Types
- 9.2.1. Lithium Cobalt Oxide
- 9.2.2. Lithium Manganese Oxide
- 9.2.3. Lithium Nickel Manganese Cobalt Oxide
- 9.1. Market Analysis, Insights and Forecast - by Application
- 10. Asia Pacific Li-Ion Pouch Battery Analysis, Insights and Forecast, 2020-2032
- 10.1. Market Analysis, Insights and Forecast - by Application
- 10.1.1. Electric Car
- 10.1.2. Cell Phone
- 10.1.3. Robot
- 10.1.4. Portable Electronic Device
- 10.1.5. Other
- 10.2. Market Analysis, Insights and Forecast - by Types
- 10.2.1. Lithium Cobalt Oxide
- 10.2.2. Lithium Manganese Oxide
- 10.2.3. Lithium Nickel Manganese Cobalt Oxide
- 10.1. Market Analysis, Insights and Forecast - by Application
- 11. Competitive Analysis
- 11.1. Global Market Share Analysis 2025
- 11.2. Company Profiles
- 11.2.1 Panasonic Industrial
- 11.2.1.1. Overview
- 11.2.1.2. Products
- 11.2.1.3. SWOT Analysis
- 11.2.1.4. Recent Developments
- 11.2.1.5. Financials (Based on Availability)
- 11.2.2 Toshiba Corporation
- 11.2.2.1. Overview
- 11.2.2.2. Products
- 11.2.2.3. SWOT Analysis
- 11.2.2.4. Recent Developments
- 11.2.2.5. Financials (Based on Availability)
- 11.2.3 Gee Power
- 11.2.3.1. Overview
- 11.2.3.2. Products
- 11.2.3.3. SWOT Analysis
- 11.2.3.4. Recent Developments
- 11.2.3.5. Financials (Based on Availability)
- 11.2.4 FDK Corporation
- 11.2.4.1. Overview
- 11.2.4.2. Products
- 11.2.4.3. SWOT Analysis
- 11.2.4.4. Recent Developments
- 11.2.4.5. Financials (Based on Availability)
- 11.2.5 SK Innovation
- 11.2.5.1. Overview
- 11.2.5.2. Products
- 11.2.5.3. SWOT Analysis
- 11.2.5.4. Recent Developments
- 11.2.5.5. Financials (Based on Availability)
- 11.2.6 Bestgo B Vertical Partners West
- 11.2.6.1. Overview
- 11.2.6.2. Products
- 11.2.6.3. SWOT Analysis
- 11.2.6.4. Recent Developments
- 11.2.6.5. Financials (Based on Availability)
- 11.2.7 EPEC
- 11.2.7.1. Overview
- 11.2.7.2. Products
- 11.2.7.3. SWOT Analysis
- 11.2.7.4. Recent Developments
- 11.2.7.5. Financials (Based on Availability)
- 11.2.8 LLC
- 11.2.8.1. Overview
- 11.2.8.2. Products
- 11.2.8.3. SWOT Analysis
- 11.2.8.4. Recent Developments
- 11.2.8.5. Financials (Based on Availability)
- 11.2.9 Enertech International
- 11.2.9.1. Overview
- 11.2.9.2. Products
- 11.2.9.3. SWOT Analysis
- 11.2.9.4. Recent Developments
- 11.2.9.5. Financials (Based on Availability)
- 11.2.10 A123 Systems
- 11.2.10.1. Overview
- 11.2.10.2. Products
- 11.2.10.3. SWOT Analysis
- 11.2.10.4. Recent Developments
- 11.2.10.5. Financials (Based on Availability)
- 11.2.11 FluxPower Battery
- 11.2.11.1. Overview
- 11.2.11.2. Products
- 11.2.11.3. SWOT Analysis
- 11.2.11.4. Recent Developments
- 11.2.11.5. Financials (Based on Availability)
- 11.2.12 SOLAREDGE e-MOBILITY
- 11.2.12.1. Overview
- 11.2.12.2. Products
- 11.2.12.3. SWOT Analysis
- 11.2.12.4. Recent Developments
- 11.2.12.5. Financials (Based on Availability)
- 11.2.13 CUSTOM CELLS ITZEHOE GMBH
- 11.2.13.1. Overview
- 11.2.13.2. Products
- 11.2.13.3. SWOT Analysis
- 11.2.13.4. Recent Developments
- 11.2.13.5. Financials (Based on Availability)
- 11.2.14 Fruedenberg Group
- 11.2.14.1. Overview
- 11.2.14.2. Products
- 11.2.14.3. SWOT Analysis
- 11.2.14.4. Recent Developments
- 11.2.14.5. Financials (Based on Availability)
- 11.2.15 Leclanche SA
- 11.2.15.1. Overview
- 11.2.15.2. Products
- 11.2.15.3. SWOT Analysis
- 11.2.15.4. Recent Developments
- 11.2.15.5. Financials (Based on Availability)
- 11.2.16 Echion Technologies
- 11.2.16.1. Overview
- 11.2.16.2. Products
- 11.2.16.3. SWOT Analysis
- 11.2.16.4. Recent Developments
- 11.2.16.5. Financials (Based on Availability)
- 11.2.17 YOK Energy
- 11.2.17.1. Overview
- 11.2.17.2. Products
- 11.2.17.3. SWOT Analysis
- 11.2.17.4. Recent Developments
- 11.2.17.5. Financials (Based on Availability)
- 11.2.18 Servovision
- 11.2.18.1. Overview
- 11.2.18.2. Products
- 11.2.18.3. SWOT Analysis
- 11.2.18.4. Recent Developments
- 11.2.18.5. Financials (Based on Availability)
- 11.2.19 DNK Power Company
- 11.2.19.1. Overview
- 11.2.19.2. Products
- 11.2.19.3. SWOT Analysis
- 11.2.19.4. Recent Developments
- 11.2.19.5. Financials (Based on Availability)
- 11.2.20 Amperex Technology
- 11.2.20.1. Overview
- 11.2.20.2. Products
- 11.2.20.3. SWOT Analysis
- 11.2.20.4. Recent Developments
- 11.2.20.5. Financials (Based on Availability)
- 11.2.21 Shenzhen Ace Battery
- 11.2.21.1. Overview
- 11.2.21.2. Products
- 11.2.21.3. SWOT Analysis
- 11.2.21.4. Recent Developments
- 11.2.21.5. Financials (Based on Availability)
- 11.2.22 Energy Innovation Group
- 11.2.22.1. Overview
- 11.2.22.2. Products
- 11.2.22.3. SWOT Analysis
- 11.2.22.4. Recent Developments
- 11.2.22.5. Financials (Based on Availability)
- 11.2.23 EVE Energy
- 11.2.23.1. Overview
- 11.2.23.2. Products
- 11.2.23.3. SWOT Analysis
- 11.2.23.4. Recent Developments
- 11.2.23.5. Financials (Based on Availability)
- 11.2.1 Panasonic Industrial
List of Figures
- Figure 1: Global Li-Ion Pouch Battery Revenue Breakdown (undefined, %) by Region 2025 & 2033
- Figure 2: Global Li-Ion Pouch Battery Volume Breakdown (K, %) by Region 2025 & 2033
- Figure 3: North America Li-Ion Pouch Battery Revenue (undefined), by Application 2025 & 2033
- Figure 4: North America Li-Ion Pouch Battery Volume (K), by Application 2025 & 2033
- Figure 5: North America Li-Ion Pouch Battery Revenue Share (%), by Application 2025 & 2033
- Figure 6: North America Li-Ion Pouch Battery Volume Share (%), by Application 2025 & 2033
- Figure 7: North America Li-Ion Pouch Battery Revenue (undefined), by Types 2025 & 2033
- Figure 8: North America Li-Ion Pouch Battery Volume (K), by Types 2025 & 2033
- Figure 9: North America Li-Ion Pouch Battery Revenue Share (%), by Types 2025 & 2033
- Figure 10: North America Li-Ion Pouch Battery Volume Share (%), by Types 2025 & 2033
- Figure 11: North America Li-Ion Pouch Battery Revenue (undefined), by Country 2025 & 2033
- Figure 12: North America Li-Ion Pouch Battery Volume (K), by Country 2025 & 2033
- Figure 13: North America Li-Ion Pouch Battery Revenue Share (%), by Country 2025 & 2033
- Figure 14: North America Li-Ion Pouch Battery Volume Share (%), by Country 2025 & 2033
- Figure 15: South America Li-Ion Pouch Battery Revenue (undefined), by Application 2025 & 2033
- Figure 16: South America Li-Ion Pouch Battery Volume (K), by Application 2025 & 2033
- Figure 17: South America Li-Ion Pouch Battery Revenue Share (%), by Application 2025 & 2033
- Figure 18: South America Li-Ion Pouch Battery Volume Share (%), by Application 2025 & 2033
- Figure 19: South America Li-Ion Pouch Battery Revenue (undefined), by Types 2025 & 2033
- Figure 20: South America Li-Ion Pouch Battery Volume (K), by Types 2025 & 2033
- Figure 21: South America Li-Ion Pouch Battery Revenue Share (%), by Types 2025 & 2033
- Figure 22: South America Li-Ion Pouch Battery Volume Share (%), by Types 2025 & 2033
- Figure 23: South America Li-Ion Pouch Battery Revenue (undefined), by Country 2025 & 2033
- Figure 24: South America Li-Ion Pouch Battery Volume (K), by Country 2025 & 2033
- Figure 25: South America Li-Ion Pouch Battery Revenue Share (%), by Country 2025 & 2033
- Figure 26: South America Li-Ion Pouch Battery Volume Share (%), by Country 2025 & 2033
- Figure 27: Europe Li-Ion Pouch Battery Revenue (undefined), by Application 2025 & 2033
- Figure 28: Europe Li-Ion Pouch Battery Volume (K), by Application 2025 & 2033
- Figure 29: Europe Li-Ion Pouch Battery Revenue Share (%), by Application 2025 & 2033
- Figure 30: Europe Li-Ion Pouch Battery Volume Share (%), by Application 2025 & 2033
- Figure 31: Europe Li-Ion Pouch Battery Revenue (undefined), by Types 2025 & 2033
- Figure 32: Europe Li-Ion Pouch Battery Volume (K), by Types 2025 & 2033
- Figure 33: Europe Li-Ion Pouch Battery Revenue Share (%), by Types 2025 & 2033
- Figure 34: Europe Li-Ion Pouch Battery Volume Share (%), by Types 2025 & 2033
- Figure 35: Europe Li-Ion Pouch Battery Revenue (undefined), by Country 2025 & 2033
- Figure 36: Europe Li-Ion Pouch Battery Volume (K), by Country 2025 & 2033
- Figure 37: Europe Li-Ion Pouch Battery Revenue Share (%), by Country 2025 & 2033
- Figure 38: Europe Li-Ion Pouch Battery Volume Share (%), by Country 2025 & 2033
- Figure 39: Middle East & Africa Li-Ion Pouch Battery Revenue (undefined), by Application 2025 & 2033
- Figure 40: Middle East & Africa Li-Ion Pouch Battery Volume (K), by Application 2025 & 2033
- Figure 41: Middle East & Africa Li-Ion Pouch Battery Revenue Share (%), by Application 2025 & 2033
- Figure 42: Middle East & Africa Li-Ion Pouch Battery Volume Share (%), by Application 2025 & 2033
- Figure 43: Middle East & Africa Li-Ion Pouch Battery Revenue (undefined), by Types 2025 & 2033
- Figure 44: Middle East & Africa Li-Ion Pouch Battery Volume (K), by Types 2025 & 2033
- Figure 45: Middle East & Africa Li-Ion Pouch Battery Revenue Share (%), by Types 2025 & 2033
- Figure 46: Middle East & Africa Li-Ion Pouch Battery Volume Share (%), by Types 2025 & 2033
- Figure 47: Middle East & Africa Li-Ion Pouch Battery Revenue (undefined), by Country 2025 & 2033
- Figure 48: Middle East & Africa Li-Ion Pouch Battery Volume (K), by Country 2025 & 2033
- Figure 49: Middle East & Africa Li-Ion Pouch Battery Revenue Share (%), by Country 2025 & 2033
- Figure 50: Middle East & Africa Li-Ion Pouch Battery Volume Share (%), by Country 2025 & 2033
- Figure 51: Asia Pacific Li-Ion Pouch Battery Revenue (undefined), by Application 2025 & 2033
- Figure 52: Asia Pacific Li-Ion Pouch Battery Volume (K), by Application 2025 & 2033
- Figure 53: Asia Pacific Li-Ion Pouch Battery Revenue Share (%), by Application 2025 & 2033
- Figure 54: Asia Pacific Li-Ion Pouch Battery Volume Share (%), by Application 2025 & 2033
- Figure 55: Asia Pacific Li-Ion Pouch Battery Revenue (undefined), by Types 2025 & 2033
- Figure 56: Asia Pacific Li-Ion Pouch Battery Volume (K), by Types 2025 & 2033
- Figure 57: Asia Pacific Li-Ion Pouch Battery Revenue Share (%), by Types 2025 & 2033
- Figure 58: Asia Pacific Li-Ion Pouch Battery Volume Share (%), by Types 2025 & 2033
- Figure 59: Asia Pacific Li-Ion Pouch Battery Revenue (undefined), by Country 2025 & 2033
- Figure 60: Asia Pacific Li-Ion Pouch Battery Volume (K), by Country 2025 & 2033
- Figure 61: Asia Pacific Li-Ion Pouch Battery Revenue Share (%), by Country 2025 & 2033
- Figure 62: Asia Pacific Li-Ion Pouch Battery Volume Share (%), by Country 2025 & 2033
List of Tables
- Table 1: Global Li-Ion Pouch Battery Revenue undefined Forecast, by Application 2020 & 2033
- Table 2: Global Li-Ion Pouch Battery Volume K Forecast, by Application 2020 & 2033
- Table 3: Global Li-Ion Pouch Battery Revenue undefined Forecast, by Types 2020 & 2033
- Table 4: Global Li-Ion Pouch Battery Volume K Forecast, by Types 2020 & 2033
- Table 5: Global Li-Ion Pouch Battery Revenue undefined Forecast, by Region 2020 & 2033
- Table 6: Global Li-Ion Pouch Battery Volume K Forecast, by Region 2020 & 2033
- Table 7: Global Li-Ion Pouch Battery Revenue undefined Forecast, by Application 2020 & 2033
- Table 8: Global Li-Ion Pouch Battery Volume K Forecast, by Application 2020 & 2033
- Table 9: Global Li-Ion Pouch Battery Revenue undefined Forecast, by Types 2020 & 2033
- Table 10: Global Li-Ion Pouch Battery Volume K Forecast, by Types 2020 & 2033
- Table 11: Global Li-Ion Pouch Battery Revenue undefined Forecast, by Country 2020 & 2033
- Table 12: Global Li-Ion Pouch Battery Volume K Forecast, by Country 2020 & 2033
- Table 13: United States Li-Ion Pouch Battery Revenue (undefined) Forecast, by Application 2020 & 2033
- Table 14: United States Li-Ion Pouch Battery Volume (K) Forecast, by Application 2020 & 2033
- Table 15: Canada Li-Ion Pouch Battery Revenue (undefined) Forecast, by Application 2020 & 2033
- Table 16: Canada Li-Ion Pouch Battery Volume (K) Forecast, by Application 2020 & 2033
- Table 17: Mexico Li-Ion Pouch Battery Revenue (undefined) Forecast, by Application 2020 & 2033
- Table 18: Mexico Li-Ion Pouch Battery Volume (K) Forecast, by Application 2020 & 2033
- Table 19: Global Li-Ion Pouch Battery Revenue undefined Forecast, by Application 2020 & 2033
- Table 20: Global Li-Ion Pouch Battery Volume K Forecast, by Application 2020 & 2033
- Table 21: Global Li-Ion Pouch Battery Revenue undefined Forecast, by Types 2020 & 2033
- Table 22: Global Li-Ion Pouch Battery Volume K Forecast, by Types 2020 & 2033
- Table 23: Global Li-Ion Pouch Battery Revenue undefined Forecast, by Country 2020 & 2033
- Table 24: Global Li-Ion Pouch Battery Volume K Forecast, by Country 2020 & 2033
- Table 25: Brazil Li-Ion Pouch Battery Revenue (undefined) Forecast, by Application 2020 & 2033
- Table 26: Brazil Li-Ion Pouch Battery Volume (K) Forecast, by Application 2020 & 2033
- Table 27: Argentina Li-Ion Pouch Battery Revenue (undefined) Forecast, by Application 2020 & 2033
- Table 28: Argentina Li-Ion Pouch Battery Volume (K) Forecast, by Application 2020 & 2033
- Table 29: Rest of South America Li-Ion Pouch Battery Revenue (undefined) Forecast, by Application 2020 & 2033
- Table 30: Rest of South America Li-Ion Pouch Battery Volume (K) Forecast, by Application 2020 & 2033
- Table 31: Global Li-Ion Pouch Battery Revenue undefined Forecast, by Application 2020 & 2033
- Table 32: Global Li-Ion Pouch Battery Volume K Forecast, by Application 2020 & 2033
- Table 33: Global Li-Ion Pouch Battery Revenue undefined Forecast, by Types 2020 & 2033
- Table 34: Global Li-Ion Pouch Battery Volume K Forecast, by Types 2020 & 2033
- Table 35: Global Li-Ion Pouch Battery Revenue undefined Forecast, by Country 2020 & 2033
- Table 36: Global Li-Ion Pouch Battery Volume K Forecast, by Country 2020 & 2033
- Table 37: United Kingdom Li-Ion Pouch Battery Revenue (undefined) Forecast, by Application 2020 & 2033
- Table 38: United Kingdom Li-Ion Pouch Battery Volume (K) Forecast, by Application 2020 & 2033
- Table 39: Germany Li-Ion Pouch Battery Revenue (undefined) Forecast, by Application 2020 & 2033
- Table 40: Germany Li-Ion Pouch Battery Volume (K) Forecast, by Application 2020 & 2033
- Table 41: France Li-Ion Pouch Battery Revenue (undefined) Forecast, by Application 2020 & 2033
- Table 42: France Li-Ion Pouch Battery Volume (K) Forecast, by Application 2020 & 2033
- Table 43: Italy Li-Ion Pouch Battery Revenue (undefined) Forecast, by Application 2020 & 2033
- Table 44: Italy Li-Ion Pouch Battery Volume (K) Forecast, by Application 2020 & 2033
- Table 45: Spain Li-Ion Pouch Battery Revenue (undefined) Forecast, by Application 2020 & 2033
- Table 46: Spain Li-Ion Pouch Battery Volume (K) Forecast, by Application 2020 & 2033
- Table 47: Russia Li-Ion Pouch Battery Revenue (undefined) Forecast, by Application 2020 & 2033
- Table 48: Russia Li-Ion Pouch Battery Volume (K) Forecast, by Application 2020 & 2033
- Table 49: Benelux Li-Ion Pouch Battery Revenue (undefined) Forecast, by Application 2020 & 2033
- Table 50: Benelux Li-Ion Pouch Battery Volume (K) Forecast, by Application 2020 & 2033
- Table 51: Nordics Li-Ion Pouch Battery Revenue (undefined) Forecast, by Application 2020 & 2033
- Table 52: Nordics Li-Ion Pouch Battery Volume (K) Forecast, by Application 2020 & 2033
- Table 53: Rest of Europe Li-Ion Pouch Battery Revenue (undefined) Forecast, by Application 2020 & 2033
- Table 54: Rest of Europe Li-Ion Pouch Battery Volume (K) Forecast, by Application 2020 & 2033
- Table 55: Global Li-Ion Pouch Battery Revenue undefined Forecast, by Application 2020 & 2033
- Table 56: Global Li-Ion Pouch Battery Volume K Forecast, by Application 2020 & 2033
- Table 57: Global Li-Ion Pouch Battery Revenue undefined Forecast, by Types 2020 & 2033
- Table 58: Global Li-Ion Pouch Battery Volume K Forecast, by Types 2020 & 2033
- Table 59: Global Li-Ion Pouch Battery Revenue undefined Forecast, by Country 2020 & 2033
- Table 60: Global Li-Ion Pouch Battery Volume K Forecast, by Country 2020 & 2033
- Table 61: Turkey Li-Ion Pouch Battery Revenue (undefined) Forecast, by Application 2020 & 2033
- Table 62: Turkey Li-Ion Pouch Battery Volume (K) Forecast, by Application 2020 & 2033
- Table 63: Israel Li-Ion Pouch Battery Revenue (undefined) Forecast, by Application 2020 & 2033
- Table 64: Israel Li-Ion Pouch Battery Volume (K) Forecast, by Application 2020 & 2033
- Table 65: GCC Li-Ion Pouch Battery Revenue (undefined) Forecast, by Application 2020 & 2033
- Table 66: GCC Li-Ion Pouch Battery Volume (K) Forecast, by Application 2020 & 2033
- Table 67: North Africa Li-Ion Pouch Battery Revenue (undefined) Forecast, by Application 2020 & 2033
- Table 68: North Africa Li-Ion Pouch Battery Volume (K) Forecast, by Application 2020 & 2033
- Table 69: South Africa Li-Ion Pouch Battery Revenue (undefined) Forecast, by Application 2020 & 2033
- Table 70: South Africa Li-Ion Pouch Battery Volume (K) Forecast, by Application 2020 & 2033
- Table 71: Rest of Middle East & Africa Li-Ion Pouch Battery Revenue (undefined) Forecast, by Application 2020 & 2033
- Table 72: Rest of Middle East & Africa Li-Ion Pouch Battery Volume (K) Forecast, by Application 2020 & 2033
- Table 73: Global Li-Ion Pouch Battery Revenue undefined Forecast, by Application 2020 & 2033
- Table 74: Global Li-Ion Pouch Battery Volume K Forecast, by Application 2020 & 2033
- Table 75: Global Li-Ion Pouch Battery Revenue undefined Forecast, by Types 2020 & 2033
- Table 76: Global Li-Ion Pouch Battery Volume K Forecast, by Types 2020 & 2033
- Table 77: Global Li-Ion Pouch Battery Revenue undefined Forecast, by Country 2020 & 2033
- Table 78: Global Li-Ion Pouch Battery Volume K Forecast, by Country 2020 & 2033
- Table 79: China Li-Ion Pouch Battery Revenue (undefined) Forecast, by Application 2020 & 2033
- Table 80: China Li-Ion Pouch Battery Volume (K) Forecast, by Application 2020 & 2033
- Table 81: India Li-Ion Pouch Battery Revenue (undefined) Forecast, by Application 2020 & 2033
- Table 82: India Li-Ion Pouch Battery Volume (K) Forecast, by Application 2020 & 2033
- Table 83: Japan Li-Ion Pouch Battery Revenue (undefined) Forecast, by Application 2020 & 2033
- Table 84: Japan Li-Ion Pouch Battery Volume (K) Forecast, by Application 2020 & 2033
- Table 85: South Korea Li-Ion Pouch Battery Revenue (undefined) Forecast, by Application 2020 & 2033
- Table 86: South Korea Li-Ion Pouch Battery Volume (K) Forecast, by Application 2020 & 2033
- Table 87: ASEAN Li-Ion Pouch Battery Revenue (undefined) Forecast, by Application 2020 & 2033
- Table 88: ASEAN Li-Ion Pouch Battery Volume (K) Forecast, by Application 2020 & 2033
- Table 89: Oceania Li-Ion Pouch Battery Revenue (undefined) Forecast, by Application 2020 & 2033
- Table 90: Oceania Li-Ion Pouch Battery Volume (K) Forecast, by Application 2020 & 2033
- Table 91: Rest of Asia Pacific Li-Ion Pouch Battery Revenue (undefined) Forecast, by Application 2020 & 2033
- Table 92: Rest of Asia Pacific Li-Ion Pouch Battery Volume (K) Forecast, by Application 2020 & 2033
Frequently Asked Questions
1. What is the projected Compound Annual Growth Rate (CAGR) of the Li-Ion Pouch Battery?
The projected CAGR is approximately 10%.
2. Which companies are prominent players in the Li-Ion Pouch Battery?
Key companies in the market include Panasonic Industrial, Toshiba Corporation, Gee Power, FDK Corporation, SK Innovation, Bestgo B Vertical Partners West, EPEC, LLC, Enertech International, A123 Systems, FluxPower Battery, SOLAREDGE e-MOBILITY, CUSTOM CELLS ITZEHOE GMBH, Fruedenberg Group, Leclanche SA, Echion Technologies, YOK Energy, Servovision, DNK Power Company, Amperex Technology, Shenzhen Ace Battery, Energy Innovation Group, EVE Energy.
3. What are the main segments of the Li-Ion Pouch Battery?
The market segments include Application, Types.
4. Can you provide details about the market size?
The market size is estimated to be USD XXX N/A as of 2022.
5. What are some drivers contributing to market growth?
N/A
6. What are the notable trends driving market growth?
N/A
7. Are there any restraints impacting market growth?
N/A
8. Can you provide examples of recent developments in the market?
N/A
9. What pricing options are available for accessing the report?
Pricing options include single-user, multi-user, and enterprise licenses priced at USD 3350.00, USD 5025.00, and USD 6700.00 respectively.
10. Is the market size provided in terms of value or volume?
The market size is provided in terms of value, measured in N/A and volume, measured in K.
11. Are there any specific market keywords associated with the report?
Yes, the market keyword associated with the report is "Li-Ion Pouch Battery," which aids in identifying and referencing the specific market segment covered.
12. How do I determine which pricing option suits my needs best?
The pricing options vary based on user requirements and access needs. Individual users may opt for single-user licenses, while businesses requiring broader access may choose multi-user or enterprise licenses for cost-effective access to the report.
13. Are there any additional resources or data provided in the Li-Ion Pouch Battery report?
While the report offers comprehensive insights, it's advisable to review the specific contents or supplementary materials provided to ascertain if additional resources or data are available.
14. How can I stay updated on further developments or reports in the Li-Ion Pouch Battery?
To stay informed about further developments, trends, and reports in the Li-Ion Pouch Battery, consider subscribing to industry newsletters, following relevant companies and organizations, or regularly checking reputable industry news sources and publications.
Methodology
Step 1 - Identification of Relevant Samples Size from Population Database


Step 2 - Approaches for Defining Global Market Size (Value, Volume* & Price*)

Note*: In applicable scenarios
Step 3 - Data Sources
Primary Research
- Web Analytics
- Survey Reports
- Research Institute
- Latest Research Reports
- Opinion Leaders
Secondary Research
- Annual Reports
- White Paper
- Latest Press Release
- Industry Association
- Paid Database
- Investor Presentations

Step 4 - Data Triangulation
Involves using different sources of information in order to increase the validity of a study
These sources are likely to be stakeholders in a program - participants, other researchers, program staff, other community members, and so on.
Then we put all data in single framework & apply various statistical tools to find out the dynamic on the market.
During the analysis stage, feedback from the stakeholder groups would be compared to determine areas of agreement as well as areas of divergence