

Key Insights
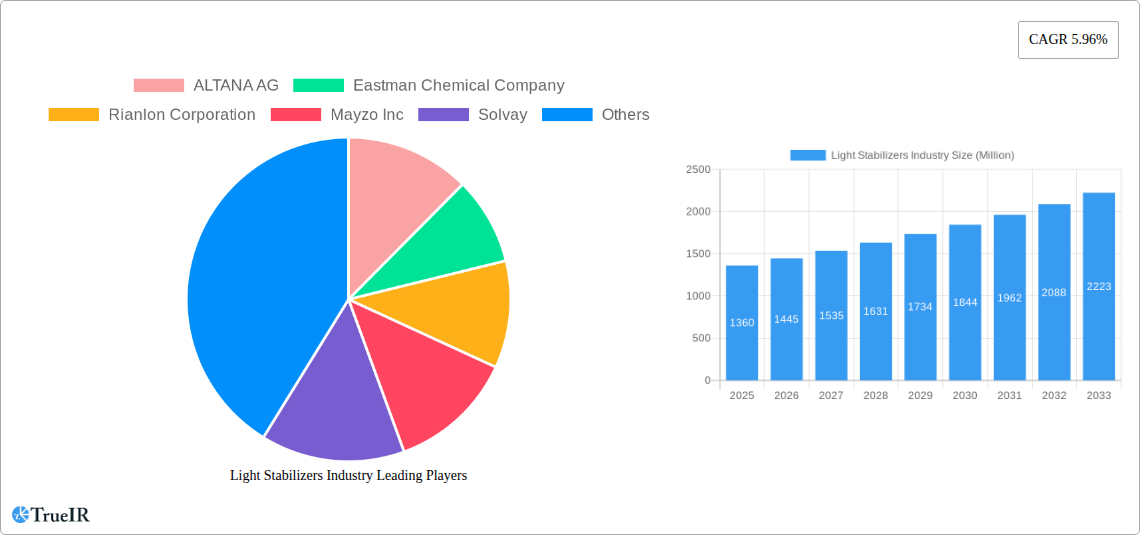
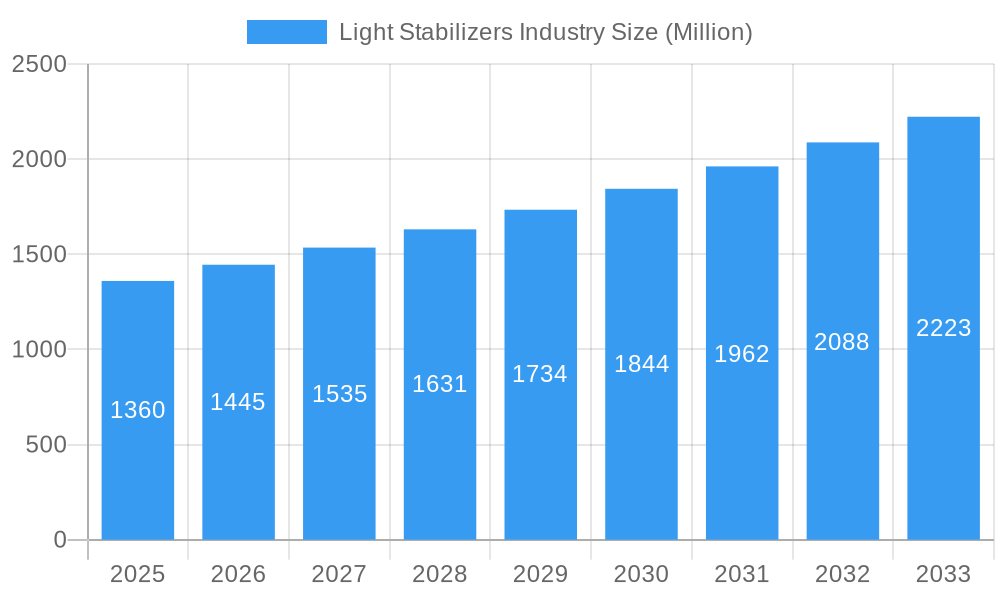
The global light stabilizers market, valued at $1.36 billion in 2025, is projected to experience robust growth, driven by a Compound Annual Growth Rate (CAGR) of 5.96% from 2025 to 2033. This expansion is fueled by several key factors. The burgeoning packaging industry, particularly in food and beverage, necessitates the use of light stabilizers to extend the shelf life and maintain the quality of products. Furthermore, the automotive sector's increasing demand for durable and UV-resistant materials in exterior components like dashboards and bumpers significantly contributes to market growth. The construction industry's adoption of polymers and plastics also fuels demand, as light stabilizers protect these materials from degradation caused by prolonged sun exposure. Growth is further spurred by advancements in stabilizer technology, leading to more efficient and effective formulations with improved properties such as enhanced UV absorption and thermal stability. The development of environmentally friendly, biodegradable light stabilizers is also gaining traction, responding to increasing environmental concerns.
Light Stabilizers Industry Market Size (In Billion)
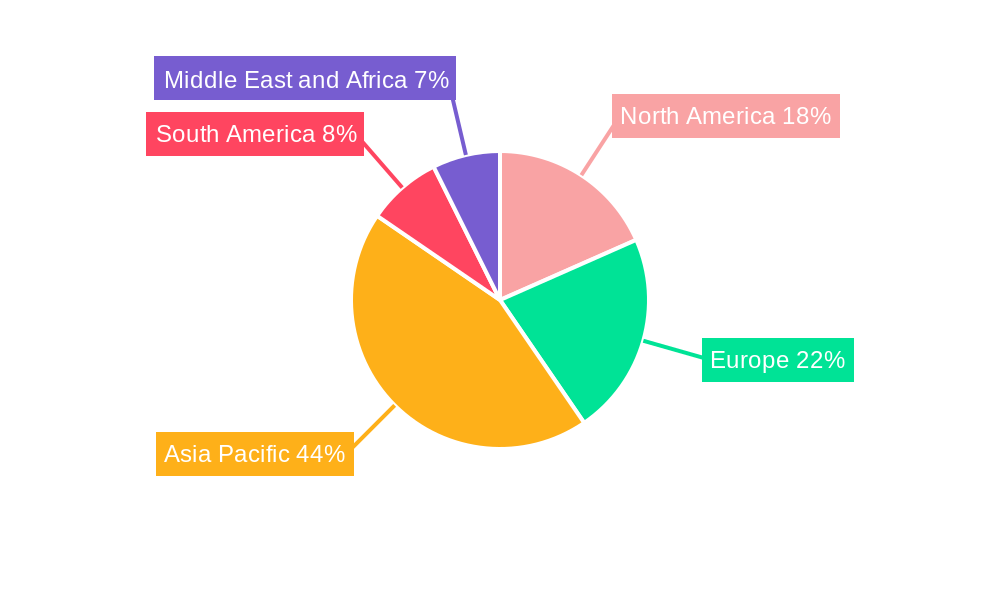
However, the market faces certain restraints. Fluctuations in raw material prices, particularly for key chemicals used in light stabilizer production, can impact profitability and pricing. Furthermore, stringent regulatory requirements concerning the use of certain chemical additives in specific applications can impose limitations on market expansion. Despite these challenges, the overall outlook for the light stabilizers market remains positive, with promising growth prospects driven by continuous innovation and expanding applications across diverse industries. Regional growth will likely be led by Asia Pacific, driven by rapid industrialization and increasing demand from developing economies like India and China. North America and Europe will also show sustained growth, though perhaps at a slightly slower pace than the Asia Pacific region.
Light Stabilizers Industry Company Market Share
Light Stabilizers Industry Report: 2019-2033 Forecast
This comprehensive report delivers an in-depth analysis of the global Light Stabilizers industry, providing valuable insights for stakeholders, investors, and industry professionals. With a focus on market trends, competitive dynamics, and future growth prospects, this report covers the period 2019-2033, with a base year of 2025 and an estimated year of 2025. The forecast period spans 2025-2033, encompassing historical data from 2019-2024. The market is valued at approximately $XX Billion in 2025 and is projected to reach $XX Billion by 2033, exhibiting a CAGR of XX%.
Light Stabilizers Industry Market Structure & Competitive Landscape
The light stabilizers market is moderately concentrated, with key players holding significant market share. However, the presence of several smaller, specialized companies fosters innovation and competition. The industry is characterized by ongoing mergers and acquisitions (M&A), with a total M&A volume of approximately $XX Billion recorded between 2019 and 2024. This activity reflects consolidation efforts and expansion strategies within the sector.
- Market Concentration: The Herfindahl-Hirschman Index (HHI) is estimated at XX, indicating a moderately concentrated market.
- Innovation Drivers: The demand for advanced materials with enhanced UV resistance in diverse applications fuels innovation. This includes the development of novel light stabilizers with improved efficacy and broader compatibility.
- Regulatory Impacts: Stringent environmental regulations and safety standards significantly impact the industry, particularly concerning the use of specific chemicals. Compliance costs and the need for sustainable solutions are crucial factors.
- Product Substitutes: While direct substitutes are limited, the market faces indirect competition from alternative technologies that improve material durability and UV resistance, such as specialized coatings and surface treatments.
- End-User Segmentation: The market is broadly segmented by end-use industries, with Packaging, Automotive, and Building & Construction representing the largest sectors. The diverse needs of these sectors drive the development of specialized light stabilizers.
- M&A Trends: M&A activity is driven by companies aiming to expand their product portfolios, access new technologies, and gain a larger market share. Strategic acquisitions of smaller specialized firms are a common trend.
Light Stabilizers Industry Market Trends & Opportunities
The global light stabilizers market demonstrates robust growth, driven by increasing demand from various end-use industries. Technological advancements are also shaping market trends, with a focus on developing more efficient and sustainable products. Consumer preferences towards longer-lasting and durable products further enhance the market outlook. The market is expected to witness a substantial expansion in the forecast period, fueled by the growing demand for high-performance materials in diverse sectors. A significant factor driving market growth is the increasing demand for UV protection in various applications, especially in the packaging and automotive industries.
The CAGR for the forecast period is estimated at XX%, demonstrating a significant market growth trajectory. Market penetration rates vary widely among different end-use segments and geographic regions. The automotive sector is predicted to exhibit the highest growth rate, driven by the increasing demand for long-lasting and high-performance automotive parts. Furthermore, the construction and agriculture industries demonstrate increasing demand for UV-resistant materials. Competitive dynamics are characterized by both collaboration and competition, with key players focusing on technological innovation and strategic partnerships to maintain their market positions.
Dominant Markets & Segments in Light Stabilizers Industry
The Asia-Pacific region holds a significant share of the global light stabilizers market, driven by rapid industrialization and significant construction activity. Within this region, China and India are prominent markets.
- Leading Regions/Countries: Asia-Pacific (particularly China and India), North America, and Europe represent the largest market segments.
- Leading Segments (Type): Hindered Amine Light Stabilizers (HALS) currently hold the largest market share, followed by UV Absorbers.
- Leading Segments (End-User Industry): The Packaging industry displays the highest demand for light stabilizers, followed by the Automotive and Building & Construction sectors.
Key Growth Drivers:
- Asia-Pacific: Rapid industrialization, significant infrastructure development, and rising disposable incomes contribute to market growth.
- Packaging: The growing demand for durable and long-lasting packaging materials drives the demand for light stabilizers.
- Automotive: The shift towards lightweight vehicles and the need for UV-resistant automotive components fuel growth in this segment.
- Building & Construction: The expanding construction sector and the increasing demand for UV-resistant building materials are major factors.
Light Stabilizers Industry Product Analysis
Recent innovations in light stabilizers focus on enhancing their efficiency, broadening their compatibility with various polymers, and improving their environmental profile. This includes the development of bio-based light stabilizers and formulations with reduced volatile organic compound (VOC) content. The market is witnessing the emergence of specialized light stabilizers tailored for specific applications, such as those with high heat resistance or superior UV protection. These advancements cater to the increasing demand for improved material performance and sustainability.
Key Drivers, Barriers & Challenges in Light Stabilizers Industry
Key Drivers:
- Growing Demand: The rising demand for durable, UV-resistant materials across various sectors fuels market expansion.
- Technological Advancements: Innovations in light stabilizer formulations and application technologies continuously improve their performance and efficiency.
- Stringent Regulations: Regulations regarding the use of certain chemicals drive the development of more sustainable and environmentally friendly products.
Key Challenges and Restraints:
- Price Volatility: Fluctuations in raw material prices and energy costs can impact profitability.
- Regulatory Compliance: Adherence to stringent safety and environmental regulations increases operational costs.
- Competition: The presence of numerous players creates a competitive market environment.
Growth Drivers in the Light Stabilizers Industry Market
The global light stabilizers market is primarily driven by the rising demand from various end-use industries, especially packaging, automotive, and construction. Technological advancements leading to the development of high-performance, environmentally friendly light stabilizers also contribute to market growth. Favorable government regulations and policies supporting sustainable materials further enhance market expansion.
Challenges Impacting Light Stabilizers Industry Growth
The light stabilizers industry faces challenges such as fluctuating raw material prices, strict environmental regulations, and intense competition. Supply chain disruptions can also impact production and profitability. These factors necessitate strategic planning and innovation to sustain growth.
Key Players Shaping the Light Stabilizers Industry Market
- ALTANA AG
- Eastman Chemical Company
- Rianlon Corporation
- Mayzo Inc
- Solvay
- SABO S p A
- CLARIANT
- Everlight Chemical Industrial Co
- SI Group Inc (SK Capital Partners)
- Chitec Technology Co Ltd
- ADEKA CORPORATION
- Lycus Ltd LLC
- SONGWON
- UniteChem Group
- BASF SE
Significant Light Stabilizers Industry Milestones
- July 2022: Solvay launched a novel UV-C stabilizer range for demanding hygiene applications, addressing polyolefin degradation caused by UV-C exposure.
- March 2022: BASF SE announced increased production capacity for its HALS (Tinuvin, Chimassorb, and Uvinul) at its Italian and German facilities.
Future Outlook for Light Stabilizers Industry Market
The light stabilizers market is poised for sustained growth, driven by increasing demand from diverse sectors, technological advancements, and evolving consumer preferences. Strategic collaborations, mergers, and acquisitions will further shape the market landscape. The development of sustainable and high-performance light stabilizers will be crucial for maintaining market competitiveness.
Light Stabilizers Industry Segmentation
-
1. Type
- 1.1. UV Absorbers
- 1.2. Hindered Amine Light Stabilizers (HALS)
- 1.3. Quenchers
- 1.4. Antioxidants
-
2. End-User Industry
- 2.1. Packaging
- 2.2. Automotive
- 2.3. Agriculture
- 2.4. Building and Construction
- 2.5. Adhesives and Sealants
- 2.6. Other End-User Industries
Light Stabilizers Industry Segmentation By Geography
-
1. Asia Pacific
- 1.1. China
- 1.2. India
- 1.3. Japan
- 1.4. South Korea
- 1.5. Rest of Asia Pacific
-
2. North America
- 2.1. United States
- 2.2. Canada
- 2.3. Mexico
-
3. Europe
- 3.1. Germany
- 3.2. United Kingdom
- 3.3. France
- 3.4. Italy
- 3.5. Rest of Europe
-
4. South America
- 4.1. Brazil
- 4.2. Argentina
- 4.3. Rest of South America
-
5. Middle East and Africa
- 5.1. Saudi Arabia
- 5.2. South Africa
- 5.3. Rest of Middle East and Africa
Light Stabilizers Industry Regional Market Share
Geographic Coverage of Light Stabilizers Industry
Light Stabilizers Industry REPORT HIGHLIGHTS
| Aspects | Details |
|---|---|
| Study Period | 2020-2034 |
| Base Year | 2025 |
| Estimated Year | 2026 |
| Forecast Period | 2026-2034 |
| Historical Period | 2020-2025 |
| Growth Rate | CAGR of 5.96% from 2020-2034 |
| Segmentation |
|
Table of Contents
- 1. Introduction
- 1.1. Research Scope
- 1.2. Market Segmentation
- 1.3. Research Methodology
- 1.4. Definitions and Assumptions
- 2. Executive Summary
- 2.1. Introduction
- 3. Market Dynamics
- 3.1. Introduction
- 3.2. Market Drivers
- 3.2.1. Rising Consumption in Polymer Industry; Increasing Demand for Wood Coatings
- 3.3. Market Restrains
- 3.3.1. Fluctuations in Raw Material Prices
- 3.4. Market Trends
- 3.4.1. Automotive Sector to Dominate the Market
- 4. Market Factor Analysis
- 4.1. Porters Five Forces
- 4.2. Supply/Value Chain
- 4.3. PESTEL analysis
- 4.4. Market Entropy
- 4.5. Patent/Trademark Analysis
- 5. Global Light Stabilizers Industry Analysis, Insights and Forecast, 2020-2032
- 5.1. Market Analysis, Insights and Forecast - by Type
- 5.1.1. UV Absorbers
- 5.1.2. Hindered Amine Light Stabilizers (HALS)
- 5.1.3. Quenchers
- 5.1.4. Antioxidants
- 5.2. Market Analysis, Insights and Forecast - by End-User Industry
- 5.2.1. Packaging
- 5.2.2. Automotive
- 5.2.3. Agriculture
- 5.2.4. Building and Construction
- 5.2.5. Adhesives and Sealants
- 5.2.6. Other End-User Industries
- 5.3. Market Analysis, Insights and Forecast - by Region
- 5.3.1. Asia Pacific
- 5.3.2. North America
- 5.3.3. Europe
- 5.3.4. South America
- 5.3.5. Middle East and Africa
- 5.1. Market Analysis, Insights and Forecast - by Type
- 6. Asia Pacific Light Stabilizers Industry Analysis, Insights and Forecast, 2020-2032
- 6.1. Market Analysis, Insights and Forecast - by Type
- 6.1.1. UV Absorbers
- 6.1.2. Hindered Amine Light Stabilizers (HALS)
- 6.1.3. Quenchers
- 6.1.4. Antioxidants
- 6.2. Market Analysis, Insights and Forecast - by End-User Industry
- 6.2.1. Packaging
- 6.2.2. Automotive
- 6.2.3. Agriculture
- 6.2.4. Building and Construction
- 6.2.5. Adhesives and Sealants
- 6.2.6. Other End-User Industries
- 6.1. Market Analysis, Insights and Forecast - by Type
- 7. North America Light Stabilizers Industry Analysis, Insights and Forecast, 2020-2032
- 7.1. Market Analysis, Insights and Forecast - by Type
- 7.1.1. UV Absorbers
- 7.1.2. Hindered Amine Light Stabilizers (HALS)
- 7.1.3. Quenchers
- 7.1.4. Antioxidants
- 7.2. Market Analysis, Insights and Forecast - by End-User Industry
- 7.2.1. Packaging
- 7.2.2. Automotive
- 7.2.3. Agriculture
- 7.2.4. Building and Construction
- 7.2.5. Adhesives and Sealants
- 7.2.6. Other End-User Industries
- 7.1. Market Analysis, Insights and Forecast - by Type
- 8. Europe Light Stabilizers Industry Analysis, Insights and Forecast, 2020-2032
- 8.1. Market Analysis, Insights and Forecast - by Type
- 8.1.1. UV Absorbers
- 8.1.2. Hindered Amine Light Stabilizers (HALS)
- 8.1.3. Quenchers
- 8.1.4. Antioxidants
- 8.2. Market Analysis, Insights and Forecast - by End-User Industry
- 8.2.1. Packaging
- 8.2.2. Automotive
- 8.2.3. Agriculture
- 8.2.4. Building and Construction
- 8.2.5. Adhesives and Sealants
- 8.2.6. Other End-User Industries
- 8.1. Market Analysis, Insights and Forecast - by Type
- 9. South America Light Stabilizers Industry Analysis, Insights and Forecast, 2020-2032
- 9.1. Market Analysis, Insights and Forecast - by Type
- 9.1.1. UV Absorbers
- 9.1.2. Hindered Amine Light Stabilizers (HALS)
- 9.1.3. Quenchers
- 9.1.4. Antioxidants
- 9.2. Market Analysis, Insights and Forecast - by End-User Industry
- 9.2.1. Packaging
- 9.2.2. Automotive
- 9.2.3. Agriculture
- 9.2.4. Building and Construction
- 9.2.5. Adhesives and Sealants
- 9.2.6. Other End-User Industries
- 9.1. Market Analysis, Insights and Forecast - by Type
- 10. Middle East and Africa Light Stabilizers Industry Analysis, Insights and Forecast, 2020-2032
- 10.1. Market Analysis, Insights and Forecast - by Type
- 10.1.1. UV Absorbers
- 10.1.2. Hindered Amine Light Stabilizers (HALS)
- 10.1.3. Quenchers
- 10.1.4. Antioxidants
- 10.2. Market Analysis, Insights and Forecast - by End-User Industry
- 10.2.1. Packaging
- 10.2.2. Automotive
- 10.2.3. Agriculture
- 10.2.4. Building and Construction
- 10.2.5. Adhesives and Sealants
- 10.2.6. Other End-User Industries
- 10.1. Market Analysis, Insights and Forecast - by Type
- 11. Competitive Analysis
- 11.1. Global Market Share Analysis 2025
- 11.2. Company Profiles
- 11.2.1 ALTANA AG
- 11.2.1.1. Overview
- 11.2.1.2. Products
- 11.2.1.3. SWOT Analysis
- 11.2.1.4. Recent Developments
- 11.2.1.5. Financials (Based on Availability)
- 11.2.2 Eastman Chemical Company
- 11.2.2.1. Overview
- 11.2.2.2. Products
- 11.2.2.3. SWOT Analysis
- 11.2.2.4. Recent Developments
- 11.2.2.5. Financials (Based on Availability)
- 11.2.3 Rianlon Corporation
- 11.2.3.1. Overview
- 11.2.3.2. Products
- 11.2.3.3. SWOT Analysis
- 11.2.3.4. Recent Developments
- 11.2.3.5. Financials (Based on Availability)
- 11.2.4 Mayzo Inc
- 11.2.4.1. Overview
- 11.2.4.2. Products
- 11.2.4.3. SWOT Analysis
- 11.2.4.4. Recent Developments
- 11.2.4.5. Financials (Based on Availability)
- 11.2.5 Solvay
- 11.2.5.1. Overview
- 11.2.5.2. Products
- 11.2.5.3. SWOT Analysis
- 11.2.5.4. Recent Developments
- 11.2.5.5. Financials (Based on Availability)
- 11.2.6 SABO S p A
- 11.2.6.1. Overview
- 11.2.6.2. Products
- 11.2.6.3. SWOT Analysis
- 11.2.6.4. Recent Developments
- 11.2.6.5. Financials (Based on Availability)
- 11.2.7 CLARIANT
- 11.2.7.1. Overview
- 11.2.7.2. Products
- 11.2.7.3. SWOT Analysis
- 11.2.7.4. Recent Developments
- 11.2.7.5. Financials (Based on Availability)
- 11.2.8 Everlight Chemical Industrial Co
- 11.2.8.1. Overview
- 11.2.8.2. Products
- 11.2.8.3. SWOT Analysis
- 11.2.8.4. Recent Developments
- 11.2.8.5. Financials (Based on Availability)
- 11.2.9 SI Group Inc (SK Capital Partners)
- 11.2.9.1. Overview
- 11.2.9.2. Products
- 11.2.9.3. SWOT Analysis
- 11.2.9.4. Recent Developments
- 11.2.9.5. Financials (Based on Availability)
- 11.2.10 Chitec Technology Co Ltd
- 11.2.10.1. Overview
- 11.2.10.2. Products
- 11.2.10.3. SWOT Analysis
- 11.2.10.4. Recent Developments
- 11.2.10.5. Financials (Based on Availability)
- 11.2.11 ADEKA CORPORATION
- 11.2.11.1. Overview
- 11.2.11.2. Products
- 11.2.11.3. SWOT Analysis
- 11.2.11.4. Recent Developments
- 11.2.11.5. Financials (Based on Availability)
- 11.2.12 Lycus Ltd LLC
- 11.2.12.1. Overview
- 11.2.12.2. Products
- 11.2.12.3. SWOT Analysis
- 11.2.12.4. Recent Developments
- 11.2.12.5. Financials (Based on Availability)
- 11.2.13 SONGWON
- 11.2.13.1. Overview
- 11.2.13.2. Products
- 11.2.13.3. SWOT Analysis
- 11.2.13.4. Recent Developments
- 11.2.13.5. Financials (Based on Availability)
- 11.2.14 UniteChem Group*List Not Exhaustive
- 11.2.14.1. Overview
- 11.2.14.2. Products
- 11.2.14.3. SWOT Analysis
- 11.2.14.4. Recent Developments
- 11.2.14.5. Financials (Based on Availability)
- 11.2.15 BASF SE
- 11.2.15.1. Overview
- 11.2.15.2. Products
- 11.2.15.3. SWOT Analysis
- 11.2.15.4. Recent Developments
- 11.2.15.5. Financials (Based on Availability)
- 11.2.1 ALTANA AG
List of Figures
- Figure 1: Global Light Stabilizers Industry Revenue Breakdown (Million, %) by Region 2025 & 2033
- Figure 2: Global Light Stabilizers Industry Volume Breakdown (Kiloton, %) by Region 2025 & 2033
- Figure 3: Asia Pacific Light Stabilizers Industry Revenue (Million), by Type 2025 & 2033
- Figure 4: Asia Pacific Light Stabilizers Industry Volume (Kiloton), by Type 2025 & 2033
- Figure 5: Asia Pacific Light Stabilizers Industry Revenue Share (%), by Type 2025 & 2033
- Figure 6: Asia Pacific Light Stabilizers Industry Volume Share (%), by Type 2025 & 2033
- Figure 7: Asia Pacific Light Stabilizers Industry Revenue (Million), by End-User Industry 2025 & 2033
- Figure 8: Asia Pacific Light Stabilizers Industry Volume (Kiloton), by End-User Industry 2025 & 2033
- Figure 9: Asia Pacific Light Stabilizers Industry Revenue Share (%), by End-User Industry 2025 & 2033
- Figure 10: Asia Pacific Light Stabilizers Industry Volume Share (%), by End-User Industry 2025 & 2033
- Figure 11: Asia Pacific Light Stabilizers Industry Revenue (Million), by Country 2025 & 2033
- Figure 12: Asia Pacific Light Stabilizers Industry Volume (Kiloton), by Country 2025 & 2033
- Figure 13: Asia Pacific Light Stabilizers Industry Revenue Share (%), by Country 2025 & 2033
- Figure 14: Asia Pacific Light Stabilizers Industry Volume Share (%), by Country 2025 & 2033
- Figure 15: North America Light Stabilizers Industry Revenue (Million), by Type 2025 & 2033
- Figure 16: North America Light Stabilizers Industry Volume (Kiloton), by Type 2025 & 2033
- Figure 17: North America Light Stabilizers Industry Revenue Share (%), by Type 2025 & 2033
- Figure 18: North America Light Stabilizers Industry Volume Share (%), by Type 2025 & 2033
- Figure 19: North America Light Stabilizers Industry Revenue (Million), by End-User Industry 2025 & 2033
- Figure 20: North America Light Stabilizers Industry Volume (Kiloton), by End-User Industry 2025 & 2033
- Figure 21: North America Light Stabilizers Industry Revenue Share (%), by End-User Industry 2025 & 2033
- Figure 22: North America Light Stabilizers Industry Volume Share (%), by End-User Industry 2025 & 2033
- Figure 23: North America Light Stabilizers Industry Revenue (Million), by Country 2025 & 2033
- Figure 24: North America Light Stabilizers Industry Volume (Kiloton), by Country 2025 & 2033
- Figure 25: North America Light Stabilizers Industry Revenue Share (%), by Country 2025 & 2033
- Figure 26: North America Light Stabilizers Industry Volume Share (%), by Country 2025 & 2033
- Figure 27: Europe Light Stabilizers Industry Revenue (Million), by Type 2025 & 2033
- Figure 28: Europe Light Stabilizers Industry Volume (Kiloton), by Type 2025 & 2033
- Figure 29: Europe Light Stabilizers Industry Revenue Share (%), by Type 2025 & 2033
- Figure 30: Europe Light Stabilizers Industry Volume Share (%), by Type 2025 & 2033
- Figure 31: Europe Light Stabilizers Industry Revenue (Million), by End-User Industry 2025 & 2033
- Figure 32: Europe Light Stabilizers Industry Volume (Kiloton), by End-User Industry 2025 & 2033
- Figure 33: Europe Light Stabilizers Industry Revenue Share (%), by End-User Industry 2025 & 2033
- Figure 34: Europe Light Stabilizers Industry Volume Share (%), by End-User Industry 2025 & 2033
- Figure 35: Europe Light Stabilizers Industry Revenue (Million), by Country 2025 & 2033
- Figure 36: Europe Light Stabilizers Industry Volume (Kiloton), by Country 2025 & 2033
- Figure 37: Europe Light Stabilizers Industry Revenue Share (%), by Country 2025 & 2033
- Figure 38: Europe Light Stabilizers Industry Volume Share (%), by Country 2025 & 2033
- Figure 39: South America Light Stabilizers Industry Revenue (Million), by Type 2025 & 2033
- Figure 40: South America Light Stabilizers Industry Volume (Kiloton), by Type 2025 & 2033
- Figure 41: South America Light Stabilizers Industry Revenue Share (%), by Type 2025 & 2033
- Figure 42: South America Light Stabilizers Industry Volume Share (%), by Type 2025 & 2033
- Figure 43: South America Light Stabilizers Industry Revenue (Million), by End-User Industry 2025 & 2033
- Figure 44: South America Light Stabilizers Industry Volume (Kiloton), by End-User Industry 2025 & 2033
- Figure 45: South America Light Stabilizers Industry Revenue Share (%), by End-User Industry 2025 & 2033
- Figure 46: South America Light Stabilizers Industry Volume Share (%), by End-User Industry 2025 & 2033
- Figure 47: South America Light Stabilizers Industry Revenue (Million), by Country 2025 & 2033
- Figure 48: South America Light Stabilizers Industry Volume (Kiloton), by Country 2025 & 2033
- Figure 49: South America Light Stabilizers Industry Revenue Share (%), by Country 2025 & 2033
- Figure 50: South America Light Stabilizers Industry Volume Share (%), by Country 2025 & 2033
- Figure 51: Middle East and Africa Light Stabilizers Industry Revenue (Million), by Type 2025 & 2033
- Figure 52: Middle East and Africa Light Stabilizers Industry Volume (Kiloton), by Type 2025 & 2033
- Figure 53: Middle East and Africa Light Stabilizers Industry Revenue Share (%), by Type 2025 & 2033
- Figure 54: Middle East and Africa Light Stabilizers Industry Volume Share (%), by Type 2025 & 2033
- Figure 55: Middle East and Africa Light Stabilizers Industry Revenue (Million), by End-User Industry 2025 & 2033
- Figure 56: Middle East and Africa Light Stabilizers Industry Volume (Kiloton), by End-User Industry 2025 & 2033
- Figure 57: Middle East and Africa Light Stabilizers Industry Revenue Share (%), by End-User Industry 2025 & 2033
- Figure 58: Middle East and Africa Light Stabilizers Industry Volume Share (%), by End-User Industry 2025 & 2033
- Figure 59: Middle East and Africa Light Stabilizers Industry Revenue (Million), by Country 2025 & 2033
- Figure 60: Middle East and Africa Light Stabilizers Industry Volume (Kiloton), by Country 2025 & 2033
- Figure 61: Middle East and Africa Light Stabilizers Industry Revenue Share (%), by Country 2025 & 2033
- Figure 62: Middle East and Africa Light Stabilizers Industry Volume Share (%), by Country 2025 & 2033
List of Tables
- Table 1: Global Light Stabilizers Industry Revenue Million Forecast, by Type 2020 & 2033
- Table 2: Global Light Stabilizers Industry Volume Kiloton Forecast, by Type 2020 & 2033
- Table 3: Global Light Stabilizers Industry Revenue Million Forecast, by End-User Industry 2020 & 2033
- Table 4: Global Light Stabilizers Industry Volume Kiloton Forecast, by End-User Industry 2020 & 2033
- Table 5: Global Light Stabilizers Industry Revenue Million Forecast, by Region 2020 & 2033
- Table 6: Global Light Stabilizers Industry Volume Kiloton Forecast, by Region 2020 & 2033
- Table 7: Global Light Stabilizers Industry Revenue Million Forecast, by Type 2020 & 2033
- Table 8: Global Light Stabilizers Industry Volume Kiloton Forecast, by Type 2020 & 2033
- Table 9: Global Light Stabilizers Industry Revenue Million Forecast, by End-User Industry 2020 & 2033
- Table 10: Global Light Stabilizers Industry Volume Kiloton Forecast, by End-User Industry 2020 & 2033
- Table 11: Global Light Stabilizers Industry Revenue Million Forecast, by Country 2020 & 2033
- Table 12: Global Light Stabilizers Industry Volume Kiloton Forecast, by Country 2020 & 2033
- Table 13: China Light Stabilizers Industry Revenue (Million) Forecast, by Application 2020 & 2033
- Table 14: China Light Stabilizers Industry Volume (Kiloton) Forecast, by Application 2020 & 2033
- Table 15: India Light Stabilizers Industry Revenue (Million) Forecast, by Application 2020 & 2033
- Table 16: India Light Stabilizers Industry Volume (Kiloton) Forecast, by Application 2020 & 2033
- Table 17: Japan Light Stabilizers Industry Revenue (Million) Forecast, by Application 2020 & 2033
- Table 18: Japan Light Stabilizers Industry Volume (Kiloton) Forecast, by Application 2020 & 2033
- Table 19: South Korea Light Stabilizers Industry Revenue (Million) Forecast, by Application 2020 & 2033
- Table 20: South Korea Light Stabilizers Industry Volume (Kiloton) Forecast, by Application 2020 & 2033
- Table 21: Rest of Asia Pacific Light Stabilizers Industry Revenue (Million) Forecast, by Application 2020 & 2033
- Table 22: Rest of Asia Pacific Light Stabilizers Industry Volume (Kiloton) Forecast, by Application 2020 & 2033
- Table 23: Global Light Stabilizers Industry Revenue Million Forecast, by Type 2020 & 2033
- Table 24: Global Light Stabilizers Industry Volume Kiloton Forecast, by Type 2020 & 2033
- Table 25: Global Light Stabilizers Industry Revenue Million Forecast, by End-User Industry 2020 & 2033
- Table 26: Global Light Stabilizers Industry Volume Kiloton Forecast, by End-User Industry 2020 & 2033
- Table 27: Global Light Stabilizers Industry Revenue Million Forecast, by Country 2020 & 2033
- Table 28: Global Light Stabilizers Industry Volume Kiloton Forecast, by Country 2020 & 2033
- Table 29: United States Light Stabilizers Industry Revenue (Million) Forecast, by Application 2020 & 2033
- Table 30: United States Light Stabilizers Industry Volume (Kiloton) Forecast, by Application 2020 & 2033
- Table 31: Canada Light Stabilizers Industry Revenue (Million) Forecast, by Application 2020 & 2033
- Table 32: Canada Light Stabilizers Industry Volume (Kiloton) Forecast, by Application 2020 & 2033
- Table 33: Mexico Light Stabilizers Industry Revenue (Million) Forecast, by Application 2020 & 2033
- Table 34: Mexico Light Stabilizers Industry Volume (Kiloton) Forecast, by Application 2020 & 2033
- Table 35: Global Light Stabilizers Industry Revenue Million Forecast, by Type 2020 & 2033
- Table 36: Global Light Stabilizers Industry Volume Kiloton Forecast, by Type 2020 & 2033
- Table 37: Global Light Stabilizers Industry Revenue Million Forecast, by End-User Industry 2020 & 2033
- Table 38: Global Light Stabilizers Industry Volume Kiloton Forecast, by End-User Industry 2020 & 2033
- Table 39: Global Light Stabilizers Industry Revenue Million Forecast, by Country 2020 & 2033
- Table 40: Global Light Stabilizers Industry Volume Kiloton Forecast, by Country 2020 & 2033
- Table 41: Germany Light Stabilizers Industry Revenue (Million) Forecast, by Application 2020 & 2033
- Table 42: Germany Light Stabilizers Industry Volume (Kiloton) Forecast, by Application 2020 & 2033
- Table 43: United Kingdom Light Stabilizers Industry Revenue (Million) Forecast, by Application 2020 & 2033
- Table 44: United Kingdom Light Stabilizers Industry Volume (Kiloton) Forecast, by Application 2020 & 2033
- Table 45: France Light Stabilizers Industry Revenue (Million) Forecast, by Application 2020 & 2033
- Table 46: France Light Stabilizers Industry Volume (Kiloton) Forecast, by Application 2020 & 2033
- Table 47: Italy Light Stabilizers Industry Revenue (Million) Forecast, by Application 2020 & 2033
- Table 48: Italy Light Stabilizers Industry Volume (Kiloton) Forecast, by Application 2020 & 2033
- Table 49: Rest of Europe Light Stabilizers Industry Revenue (Million) Forecast, by Application 2020 & 2033
- Table 50: Rest of Europe Light Stabilizers Industry Volume (Kiloton) Forecast, by Application 2020 & 2033
- Table 51: Global Light Stabilizers Industry Revenue Million Forecast, by Type 2020 & 2033
- Table 52: Global Light Stabilizers Industry Volume Kiloton Forecast, by Type 2020 & 2033
- Table 53: Global Light Stabilizers Industry Revenue Million Forecast, by End-User Industry 2020 & 2033
- Table 54: Global Light Stabilizers Industry Volume Kiloton Forecast, by End-User Industry 2020 & 2033
- Table 55: Global Light Stabilizers Industry Revenue Million Forecast, by Country 2020 & 2033
- Table 56: Global Light Stabilizers Industry Volume Kiloton Forecast, by Country 2020 & 2033
- Table 57: Brazil Light Stabilizers Industry Revenue (Million) Forecast, by Application 2020 & 2033
- Table 58: Brazil Light Stabilizers Industry Volume (Kiloton) Forecast, by Application 2020 & 2033
- Table 59: Argentina Light Stabilizers Industry Revenue (Million) Forecast, by Application 2020 & 2033
- Table 60: Argentina Light Stabilizers Industry Volume (Kiloton) Forecast, by Application 2020 & 2033
- Table 61: Rest of South America Light Stabilizers Industry Revenue (Million) Forecast, by Application 2020 & 2033
- Table 62: Rest of South America Light Stabilizers Industry Volume (Kiloton) Forecast, by Application 2020 & 2033
- Table 63: Global Light Stabilizers Industry Revenue Million Forecast, by Type 2020 & 2033
- Table 64: Global Light Stabilizers Industry Volume Kiloton Forecast, by Type 2020 & 2033
- Table 65: Global Light Stabilizers Industry Revenue Million Forecast, by End-User Industry 2020 & 2033
- Table 66: Global Light Stabilizers Industry Volume Kiloton Forecast, by End-User Industry 2020 & 2033
- Table 67: Global Light Stabilizers Industry Revenue Million Forecast, by Country 2020 & 2033
- Table 68: Global Light Stabilizers Industry Volume Kiloton Forecast, by Country 2020 & 2033
- Table 69: Saudi Arabia Light Stabilizers Industry Revenue (Million) Forecast, by Application 2020 & 2033
- Table 70: Saudi Arabia Light Stabilizers Industry Volume (Kiloton) Forecast, by Application 2020 & 2033
- Table 71: South Africa Light Stabilizers Industry Revenue (Million) Forecast, by Application 2020 & 2033
- Table 72: South Africa Light Stabilizers Industry Volume (Kiloton) Forecast, by Application 2020 & 2033
- Table 73: Rest of Middle East and Africa Light Stabilizers Industry Revenue (Million) Forecast, by Application 2020 & 2033
- Table 74: Rest of Middle East and Africa Light Stabilizers Industry Volume (Kiloton) Forecast, by Application 2020 & 2033
Frequently Asked Questions
1. What is the projected Compound Annual Growth Rate (CAGR) of the Light Stabilizers Industry?
The projected CAGR is approximately 5.96%.
2. Which companies are prominent players in the Light Stabilizers Industry?
Key companies in the market include ALTANA AG, Eastman Chemical Company, Rianlon Corporation, Mayzo Inc, Solvay, SABO S p A, CLARIANT, Everlight Chemical Industrial Co, SI Group Inc (SK Capital Partners), Chitec Technology Co Ltd, ADEKA CORPORATION, Lycus Ltd LLC, SONGWON, UniteChem Group*List Not Exhaustive, BASF SE.
3. What are the main segments of the Light Stabilizers Industry?
The market segments include Type, End-User Industry.
4. Can you provide details about the market size?
The market size is estimated to be USD 1.36 Million as of 2022.
5. What are some drivers contributing to market growth?
Rising Consumption in Polymer Industry; Increasing Demand for Wood Coatings.
6. What are the notable trends driving market growth?
Automotive Sector to Dominate the Market.
7. Are there any restraints impacting market growth?
Fluctuations in Raw Material Prices.
8. Can you provide examples of recent developments in the market?
July 2022: Solvay announced the creation of an innovative new UV-C stabilizer range. The UV-C spectrum (200-280 nm) was used to treat polyolefin surfaces in these products, intended for use in demanding hygiene applications where COVID and hospital-acquired infections were combated. The development of the new unique stabilizing technique, which was the first to address the dangers of polyolefin deterioration, discoloration, and microcrack formation brought on by frequent exposure to UV-C radiation, marks a significant turning point for the polyolefin industry.
9. What pricing options are available for accessing the report?
Pricing options include single-user, multi-user, and enterprise licenses priced at USD 4750, USD 5250, and USD 8750 respectively.
10. Is the market size provided in terms of value or volume?
The market size is provided in terms of value, measured in Million and volume, measured in Kiloton.
11. Are there any specific market keywords associated with the report?
Yes, the market keyword associated with the report is "Light Stabilizers Industry," which aids in identifying and referencing the specific market segment covered.
12. How do I determine which pricing option suits my needs best?
The pricing options vary based on user requirements and access needs. Individual users may opt for single-user licenses, while businesses requiring broader access may choose multi-user or enterprise licenses for cost-effective access to the report.
13. Are there any additional resources or data provided in the Light Stabilizers Industry report?
While the report offers comprehensive insights, it's advisable to review the specific contents or supplementary materials provided to ascertain if additional resources or data are available.
14. How can I stay updated on further developments or reports in the Light Stabilizers Industry?
To stay informed about further developments, trends, and reports in the Light Stabilizers Industry, consider subscribing to industry newsletters, following relevant companies and organizations, or regularly checking reputable industry news sources and publications.
Methodology
Step 1 - Identification of Relevant Samples Size from Population Database


Step 2 - Approaches for Defining Global Market Size (Value, Volume* & Price*)

Note*: In applicable scenarios
Step 3 - Data Sources
Primary Research
- Web Analytics
- Survey Reports
- Research Institute
- Latest Research Reports
- Opinion Leaders
Secondary Research
- Annual Reports
- White Paper
- Latest Press Release
- Industry Association
- Paid Database
- Investor Presentations

Step 4 - Data Triangulation
Involves using different sources of information in order to increase the validity of a study
These sources are likely to be stakeholders in a program - participants, other researchers, program staff, other community members, and so on.
Then we put all data in single framework & apply various statistical tools to find out the dynamic on the market.
During the analysis stage, feedback from the stakeholder groups would be compared to determine areas of agreement as well as areas of divergence