

Key Insights
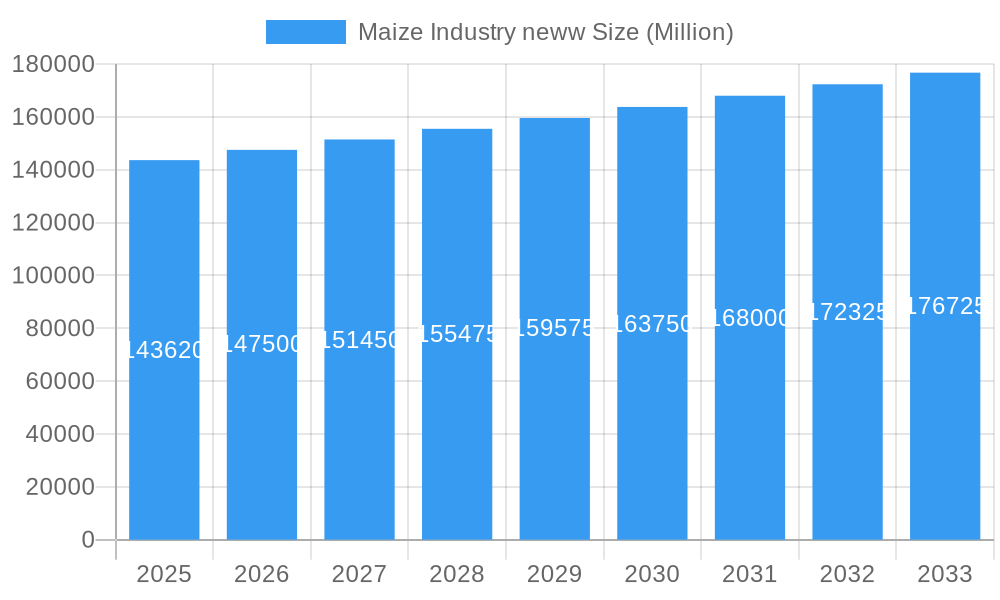
The global maize industry, valued at $143.62 billion in 2025, is projected to experience steady growth, driven by increasing demand for food and feed, coupled with the expanding biofuel sector. A compound annual growth rate (CAGR) of 3.01% from 2025 to 2033 indicates a substantial market expansion. Key drivers include rising global population, necessitating increased food production, and the growing adoption of maize as a sustainable biofuel source. Furthermore, advancements in hybrid seed technology are enhancing crop yields and resilience to climate change, contributing to market growth. However, factors like fluctuating weather patterns impacting crop yields and price volatility in the agricultural commodity market pose challenges to consistent growth. Segment analysis reveals that hybrid seeds are likely the most dominant product type, with food and beverage applications representing a significant portion of end-user demand. Regional analysis suggests North America and Asia-Pacific are key market players, driven by extensive agricultural production and strong demand. Competitive landscape analysis shows the presence of major players including ADM, Syngenta, Bayer, Bunge, Cargill, and Corteva, who are constantly innovating to maintain market share and meet the growing demand.

Maize Industry neww Market Size (In Billion)
The forecast period (2025-2033) will likely witness a shift towards more sustainable agricultural practices, influencing market dynamics. Increased focus on reducing the environmental impact of maize production will drive the adoption of precision agriculture technologies and environmentally friendly farming techniques. The industry will also see further consolidation as larger companies acquire smaller players to strengthen their supply chains and market reach. The successful navigation of these trends and challenges will be crucial for companies seeking long-term success in this dynamic market. Government policies promoting sustainable agriculture and biofuel initiatives will further influence market trends, making proactive adaptation and strategic planning essential for industry participants.
Maize Industry neww Company Market Share
Maize Industry Market Report: 2019-2033
This comprehensive report provides a detailed analysis of the global maize industry, projecting robust growth from 2025 to 2033. It offers invaluable insights into market dynamics, competitive landscapes, and future trends, empowering stakeholders to make informed strategic decisions. The report covers a study period of 2019-2033, with 2025 as the base and estimated year. The forecast period is 2025-2033, and the historical period analyzed is 2019-2024. The report utilizes data from key players such as ADM, Syngenta Crop Protection, SGS, Bayer Crop Science, Bunge, Bunge Limited, Cargill, Incorporated, Corteva Agriscience, Olam Group, and many more, considering segments like Hybrid Seeds, Yellow Maize, White Maize, Sweet Corn, and Popcorn, across End-users: Food & Beverage, Feed, and Biofuels. The global market is expected to reach xx Million by 2033.
Maize Industry Market Structure & Competitive Landscape
The global maize industry exhibits a moderately concentrated market structure, with several multinational corporations holding significant market share. The Herfindahl-Hirschman Index (HHI) for the industry is estimated to be around xx, indicating a moderately concentrated market. Key drivers of innovation include advancements in seed genetics, precision agriculture technologies, and sustainable farming practices. Regulatory impacts, including trade policies and food safety regulations, significantly influence market dynamics. Product substitutes, such as other grains and biofuel feedstocks, exert competitive pressure. The market is segmented by end-user, with Food & Beverage, Feed, and Biofuels representing the major consumption sectors.
- Market Concentration: HHI estimated at xx.
- Innovation Drivers: Seed genetics, precision agriculture, sustainable farming.
- Regulatory Impacts: Trade policies, food safety standards.
- Product Substitutes: Other grains, biofuel feedstocks.
- End-User Segmentation: Food & Beverage, Feed, Biofuels.
- M&A Trends: Over the past five years, there have been approximately xx major mergers and acquisitions, totaling approximately xx Million USD in value, driven primarily by consolidation and expansion efforts.
Maize Industry Market Trends & Opportunities
The global maize market is poised for significant growth, driven by rising global population, increasing demand for food and feed, and expanding biofuel production. The Compound Annual Growth Rate (CAGR) is projected to be xx% during the forecast period (2025-2033). Technological advancements in seed technology, precision farming, and crop protection are enhancing productivity and yield. Changing consumer preferences towards healthier and more sustainably produced food are influencing market dynamics. Competitive dynamics are characterized by intense competition among major players, necessitating continuous innovation and strategic partnerships. Market penetration rates for new technologies, such as drought-resistant maize varieties, are steadily increasing. Factors like climate change, fluctuating commodity prices, and geopolitical instability represent potential challenges.
Dominant Markets & Segments in Maize Industry
The dominant segment within the maize market is expected to be Yellow Maize, followed by White Maize, driven by strong demand from the feed and food & beverage industries. The major geographical regions dominating the market include North America, South America, and Asia-Pacific, reflecting high maize production and consumption.
- Key Growth Drivers:
- North America: Established infrastructure, technological advancements.
- South America: Favorable climatic conditions, increasing agricultural investments.
- Asia-Pacific: Rising population, growing livestock industry.
- Yellow Maize: High demand from feed and food industries.
- White Maize: Significant demand from human consumption in various regions.
The Food & Beverage sector constitutes the largest end-user segment. Governments across several regions are implementing policies aimed at supporting maize production and enhancing food security.
Maize Industry Product Analysis
Technological advancements in maize breeding have led to the development of high-yielding, pest-resistant, and climate-resilient varieties. These innovations improve productivity, reduce input costs, and enhance the overall sustainability of maize production. New applications of maize products are emerging in the biomaterials and bio-based chemicals industries, expanding market opportunities. The competitive advantage lies in developing superior seed varieties, optimizing agricultural practices, and offering value-added products.
Key Drivers, Barriers & Challenges in Maize Industry
Key Drivers: Rising global population driving food and feed demand; increasing biofuel production; technological advancements in seed genetics and farming practices; government support for agricultural development in various countries.
Challenges: Climate change and its impact on yields; price volatility; competition from other grains and feedstocks; supply chain disruptions; regulatory hurdles related to genetically modified organisms (GMOs). These factors represent considerable challenges, particularly supply chain issues that could lead to a xx Million USD loss in revenue annually.
Growth Drivers in the Maize Industry Market
Technological advancements in seed technology, precision agriculture, and improved farming practices are boosting maize production and productivity. Increased demand for food and feed, particularly from developing economies with growing populations, is a key driver of market expansion. Government policies and initiatives promoting agricultural development are also contributing to overall market growth.
Challenges Impacting Maize Industry Growth
Climate change poses a significant threat, impacting yields and creating uncertainties. Price volatility, influenced by weather patterns, global trade, and geopolitical events, impacts profitability and investment decisions. Supply chain disruptions, potentially aggravated by conflicts or natural disasters, can create shortages and price spikes.
Key Players Shaping the Maize Industry Market
Significant Maize Industry Milestones
- November 2021: Fufeng Group's announcement to build a USD 700 million corn wet milling plant signals significant investment in the maize processing sector.
- May 2022: The Indian government's initiative to boost maize production through MSP (Minimum Support Price) demonstrates a commitment to domestic food security.
- October 2022: The inauguration of a modern maize processing factory in Ghana highlights increasing investment in value-added processing within the African maize industry.
Future Outlook for Maize Industry Market
The maize industry is projected to witness sustained growth, driven by technological advancements, rising demand, and supportive government policies. Strategic opportunities exist in developing high-value maize products, enhancing supply chain efficiency, and promoting sustainable farming practices. The market holds significant potential for expansion in emerging economies and the bio-based economy.
Maize Industry neww Segmentation
- 1. Production Analysis
- 2. Consumption Analysis
- 3. Import Market Analysis (Value & Volume)
- 4. Export Market Analysis (Value & Volume)
- 5. Price Trend Analysis
Maize Industry neww Segmentation By Geography
-
1. North America
- 1.1. United States
- 1.2. Canada
- 1.3. Mexico
-
2. Europe
- 2.1. Spain
- 2.2. Italy
- 2.3. France
- 2.4. Germany
- 2.5. Russia
-
3. Asia Pacific
- 3.1. India
- 3.2. China
- 3.3. Vietnam
-
4. South America
- 4.1. Brazil
- 4.2. Argentina
-
5. Africa
- 5.1. South Africa
- 5.2. Nigeria

Maize Industry neww Regional Market Share
Geographic Coverage of Maize Industry neww
Maize Industry neww REPORT HIGHLIGHTS
| Aspects | Details |
|---|---|
| Study Period | 2020-2034 |
| Base Year | 2025 |
| Estimated Year | 2026 |
| Forecast Period | 2026-2034 |
| Historical Period | 2020-2025 |
| Growth Rate | CAGR of 3.01% from 2020-2034 |
| Segmentation |
|
Table of Contents
- 1. Introduction
- 1.1. Research Scope
- 1.2. Market Segmentation
- 1.3. Research Methodology
- 1.4. Definitions and Assumptions
- 2. Executive Summary
- 2.1. Introduction
- 3. Market Dynamics
- 3.1. Introduction
- 3.2. Market Drivers
- 3.3. Market Restrains
- 3.4. Market Trends
- 3.4.1. Increase in Demand for Animal-based Protein Sources
- 4. Market Factor Analysis
- 4.1. Porters Five Forces
- 4.2. Supply/Value Chain
- 4.3. PESTEL analysis
- 4.4. Market Entropy
- 4.5. Patent/Trademark Analysis
- 5. Global Maize Industry neww Analysis, Insights and Forecast, 2020-2032
- 5.1. Market Analysis, Insights and Forecast - by Production Analysis
- 5.2. Market Analysis, Insights and Forecast - by Consumption Analysis
- 5.3. Market Analysis, Insights and Forecast - by Import Market Analysis (Value & Volume)
- 5.4. Market Analysis, Insights and Forecast - by Export Market Analysis (Value & Volume)
- 5.5. Market Analysis, Insights and Forecast - by Price Trend Analysis
- 5.6. Market Analysis, Insights and Forecast - by Region
- 5.6.1. North America
- 5.6.2. Europe
- 5.6.3. Asia Pacific
- 5.6.4. South America
- 5.6.5. Africa
- 5.1. Market Analysis, Insights and Forecast - by Production Analysis
- 6. North America Maize Industry neww Analysis, Insights and Forecast, 2020-2032
- 6.1. Market Analysis, Insights and Forecast - by Production Analysis
- 6.2. Market Analysis, Insights and Forecast - by Consumption Analysis
- 6.3. Market Analysis, Insights and Forecast - by Import Market Analysis (Value & Volume)
- 6.4. Market Analysis, Insights and Forecast - by Export Market Analysis (Value & Volume)
- 6.5. Market Analysis, Insights and Forecast - by Price Trend Analysis
- 6.1. Market Analysis, Insights and Forecast - by Production Analysis
- 7. Europe Maize Industry neww Analysis, Insights and Forecast, 2020-2032
- 7.1. Market Analysis, Insights and Forecast - by Production Analysis
- 7.2. Market Analysis, Insights and Forecast - by Consumption Analysis
- 7.3. Market Analysis, Insights and Forecast - by Import Market Analysis (Value & Volume)
- 7.4. Market Analysis, Insights and Forecast - by Export Market Analysis (Value & Volume)
- 7.5. Market Analysis, Insights and Forecast - by Price Trend Analysis
- 7.1. Market Analysis, Insights and Forecast - by Production Analysis
- 8. Asia Pacific Maize Industry neww Analysis, Insights and Forecast, 2020-2032
- 8.1. Market Analysis, Insights and Forecast - by Production Analysis
- 8.2. Market Analysis, Insights and Forecast - by Consumption Analysis
- 8.3. Market Analysis, Insights and Forecast - by Import Market Analysis (Value & Volume)
- 8.4. Market Analysis, Insights and Forecast - by Export Market Analysis (Value & Volume)
- 8.5. Market Analysis, Insights and Forecast - by Price Trend Analysis
- 8.1. Market Analysis, Insights and Forecast - by Production Analysis
- 9. South America Maize Industry neww Analysis, Insights and Forecast, 2020-2032
- 9.1. Market Analysis, Insights and Forecast - by Production Analysis
- 9.2. Market Analysis, Insights and Forecast - by Consumption Analysis
- 9.3. Market Analysis, Insights and Forecast - by Import Market Analysis (Value & Volume)
- 9.4. Market Analysis, Insights and Forecast - by Export Market Analysis (Value & Volume)
- 9.5. Market Analysis, Insights and Forecast - by Price Trend Analysis
- 9.1. Market Analysis, Insights and Forecast - by Production Analysis
- 10. Africa Maize Industry neww Analysis, Insights and Forecast, 2020-2032
- 10.1. Market Analysis, Insights and Forecast - by Production Analysis
- 10.2. Market Analysis, Insights and Forecast - by Consumption Analysis
- 10.3. Market Analysis, Insights and Forecast - by Import Market Analysis (Value & Volume)
- 10.4. Market Analysis, Insights and Forecast - by Export Market Analysis (Value & Volume)
- 10.5. Market Analysis, Insights and Forecast - by Price Trend Analysis
- 10.1. Market Analysis, Insights and Forecast - by Production Analysis
- 11. Competitive Analysis
- 11.1. Global Market Share Analysis 2025
- 11.2. Company Profiles
- 11.2.1 ADM
- 11.2.1.1. Overview
- 11.2.1.2. Products
- 11.2.1.3. SWOT Analysis
- 11.2.1.4. Recent Developments
- 11.2.1.5. Financials (Based on Availability)
- 11.2.2 Syngenta Crop Protection
- 11.2.2.1. Overview
- 11.2.2.2. Products
- 11.2.2.3. SWOT Analysis
- 11.2.2.4. Recent Developments
- 11.2.2.5. Financials (Based on Availability)
- 11.2.3 Société Générale de Surveillance (SGS)
- 11.2.3.1. Overview
- 11.2.3.2. Products
- 11.2.3.3. SWOT Analysis
- 11.2.3.4. Recent Developments
- 11.2.3.5. Financials (Based on Availability)
- 11.2.4 Bayer Crop Science
- 11.2.4.1. Overview
- 11.2.4.2. Products
- 11.2.4.3. SWOT Analysis
- 11.2.4.4. Recent Developments
- 11.2.4.5. Financials (Based on Availability)
- 11.2.5 Bunge
- 11.2.5.1. Overview
- 11.2.5.2. Products
- 11.2.5.3. SWOT Analysis
- 11.2.5.4. Recent Developments
- 11.2.5.5. Financials (Based on Availability)
- 11.2.6 Bunge Limited
- 11.2.6.1. Overview
- 11.2.6.2. Products
- 11.2.6.3. SWOT Analysis
- 11.2.6.4. Recent Developments
- 11.2.6.5. Financials (Based on Availability)
- 11.2.7 Cargill Incorporated
- 11.2.7.1. Overview
- 11.2.7.2. Products
- 11.2.7.3. SWOT Analysis
- 11.2.7.4. Recent Developments
- 11.2.7.5. Financials (Based on Availability)
- 11.2.8 Corteva Agriscience
- 11.2.8.1. Overview
- 11.2.8.2. Products
- 11.2.8.3. SWOT Analysis
- 11.2.8.4. Recent Developments
- 11.2.8.5. Financials (Based on Availability)
- 11.2.9 ADM
- 11.2.9.1. Overview
- 11.2.9.2. Products
- 11.2.9.3. SWOT Analysis
- 11.2.9.4. Recent Developments
- 11.2.9.5. Financials (Based on Availability)
- 11.2.10 Olam Group
- 11.2.10.1. Overview
- 11.2.10.2. Products
- 11.2.10.3. SWOT Analysis
- 11.2.10.4. Recent Developments
- 11.2.10.5. Financials (Based on Availability)
- 11.2.1 ADM
List of Figures
- Figure 1: Global Maize Industry neww Revenue Breakdown (Million, %) by Region 2025 & 2033
- Figure 2: Global Maize Industry neww Volume Breakdown (Kiloton, %) by Region 2025 & 2033
- Figure 3: North America Maize Industry neww Revenue (Million), by Production Analysis 2025 & 2033
- Figure 4: North America Maize Industry neww Volume (Kiloton), by Production Analysis 2025 & 2033
- Figure 5: North America Maize Industry neww Revenue Share (%), by Production Analysis 2025 & 2033
- Figure 6: North America Maize Industry neww Volume Share (%), by Production Analysis 2025 & 2033
- Figure 7: North America Maize Industry neww Revenue (Million), by Consumption Analysis 2025 & 2033
- Figure 8: North America Maize Industry neww Volume (Kiloton), by Consumption Analysis 2025 & 2033
- Figure 9: North America Maize Industry neww Revenue Share (%), by Consumption Analysis 2025 & 2033
- Figure 10: North America Maize Industry neww Volume Share (%), by Consumption Analysis 2025 & 2033
- Figure 11: North America Maize Industry neww Revenue (Million), by Import Market Analysis (Value & Volume) 2025 & 2033
- Figure 12: North America Maize Industry neww Volume (Kiloton), by Import Market Analysis (Value & Volume) 2025 & 2033
- Figure 13: North America Maize Industry neww Revenue Share (%), by Import Market Analysis (Value & Volume) 2025 & 2033
- Figure 14: North America Maize Industry neww Volume Share (%), by Import Market Analysis (Value & Volume) 2025 & 2033
- Figure 15: North America Maize Industry neww Revenue (Million), by Export Market Analysis (Value & Volume) 2025 & 2033
- Figure 16: North America Maize Industry neww Volume (Kiloton), by Export Market Analysis (Value & Volume) 2025 & 2033
- Figure 17: North America Maize Industry neww Revenue Share (%), by Export Market Analysis (Value & Volume) 2025 & 2033
- Figure 18: North America Maize Industry neww Volume Share (%), by Export Market Analysis (Value & Volume) 2025 & 2033
- Figure 19: North America Maize Industry neww Revenue (Million), by Price Trend Analysis 2025 & 2033
- Figure 20: North America Maize Industry neww Volume (Kiloton), by Price Trend Analysis 2025 & 2033
- Figure 21: North America Maize Industry neww Revenue Share (%), by Price Trend Analysis 2025 & 2033
- Figure 22: North America Maize Industry neww Volume Share (%), by Price Trend Analysis 2025 & 2033
- Figure 23: North America Maize Industry neww Revenue (Million), by Country 2025 & 2033
- Figure 24: North America Maize Industry neww Volume (Kiloton), by Country 2025 & 2033
- Figure 25: North America Maize Industry neww Revenue Share (%), by Country 2025 & 2033
- Figure 26: North America Maize Industry neww Volume Share (%), by Country 2025 & 2033
- Figure 27: Europe Maize Industry neww Revenue (Million), by Production Analysis 2025 & 2033
- Figure 28: Europe Maize Industry neww Volume (Kiloton), by Production Analysis 2025 & 2033
- Figure 29: Europe Maize Industry neww Revenue Share (%), by Production Analysis 2025 & 2033
- Figure 30: Europe Maize Industry neww Volume Share (%), by Production Analysis 2025 & 2033
- Figure 31: Europe Maize Industry neww Revenue (Million), by Consumption Analysis 2025 & 2033
- Figure 32: Europe Maize Industry neww Volume (Kiloton), by Consumption Analysis 2025 & 2033
- Figure 33: Europe Maize Industry neww Revenue Share (%), by Consumption Analysis 2025 & 2033
- Figure 34: Europe Maize Industry neww Volume Share (%), by Consumption Analysis 2025 & 2033
- Figure 35: Europe Maize Industry neww Revenue (Million), by Import Market Analysis (Value & Volume) 2025 & 2033
- Figure 36: Europe Maize Industry neww Volume (Kiloton), by Import Market Analysis (Value & Volume) 2025 & 2033
- Figure 37: Europe Maize Industry neww Revenue Share (%), by Import Market Analysis (Value & Volume) 2025 & 2033
- Figure 38: Europe Maize Industry neww Volume Share (%), by Import Market Analysis (Value & Volume) 2025 & 2033
- Figure 39: Europe Maize Industry neww Revenue (Million), by Export Market Analysis (Value & Volume) 2025 & 2033
- Figure 40: Europe Maize Industry neww Volume (Kiloton), by Export Market Analysis (Value & Volume) 2025 & 2033
- Figure 41: Europe Maize Industry neww Revenue Share (%), by Export Market Analysis (Value & Volume) 2025 & 2033
- Figure 42: Europe Maize Industry neww Volume Share (%), by Export Market Analysis (Value & Volume) 2025 & 2033
- Figure 43: Europe Maize Industry neww Revenue (Million), by Price Trend Analysis 2025 & 2033
- Figure 44: Europe Maize Industry neww Volume (Kiloton), by Price Trend Analysis 2025 & 2033
- Figure 45: Europe Maize Industry neww Revenue Share (%), by Price Trend Analysis 2025 & 2033
- Figure 46: Europe Maize Industry neww Volume Share (%), by Price Trend Analysis 2025 & 2033
- Figure 47: Europe Maize Industry neww Revenue (Million), by Country 2025 & 2033
- Figure 48: Europe Maize Industry neww Volume (Kiloton), by Country 2025 & 2033
- Figure 49: Europe Maize Industry neww Revenue Share (%), by Country 2025 & 2033
- Figure 50: Europe Maize Industry neww Volume Share (%), by Country 2025 & 2033
- Figure 51: Asia Pacific Maize Industry neww Revenue (Million), by Production Analysis 2025 & 2033
- Figure 52: Asia Pacific Maize Industry neww Volume (Kiloton), by Production Analysis 2025 & 2033
- Figure 53: Asia Pacific Maize Industry neww Revenue Share (%), by Production Analysis 2025 & 2033
- Figure 54: Asia Pacific Maize Industry neww Volume Share (%), by Production Analysis 2025 & 2033
- Figure 55: Asia Pacific Maize Industry neww Revenue (Million), by Consumption Analysis 2025 & 2033
- Figure 56: Asia Pacific Maize Industry neww Volume (Kiloton), by Consumption Analysis 2025 & 2033
- Figure 57: Asia Pacific Maize Industry neww Revenue Share (%), by Consumption Analysis 2025 & 2033
- Figure 58: Asia Pacific Maize Industry neww Volume Share (%), by Consumption Analysis 2025 & 2033
- Figure 59: Asia Pacific Maize Industry neww Revenue (Million), by Import Market Analysis (Value & Volume) 2025 & 2033
- Figure 60: Asia Pacific Maize Industry neww Volume (Kiloton), by Import Market Analysis (Value & Volume) 2025 & 2033
- Figure 61: Asia Pacific Maize Industry neww Revenue Share (%), by Import Market Analysis (Value & Volume) 2025 & 2033
- Figure 62: Asia Pacific Maize Industry neww Volume Share (%), by Import Market Analysis (Value & Volume) 2025 & 2033
- Figure 63: Asia Pacific Maize Industry neww Revenue (Million), by Export Market Analysis (Value & Volume) 2025 & 2033
- Figure 64: Asia Pacific Maize Industry neww Volume (Kiloton), by Export Market Analysis (Value & Volume) 2025 & 2033
- Figure 65: Asia Pacific Maize Industry neww Revenue Share (%), by Export Market Analysis (Value & Volume) 2025 & 2033
- Figure 66: Asia Pacific Maize Industry neww Volume Share (%), by Export Market Analysis (Value & Volume) 2025 & 2033
- Figure 67: Asia Pacific Maize Industry neww Revenue (Million), by Price Trend Analysis 2025 & 2033
- Figure 68: Asia Pacific Maize Industry neww Volume (Kiloton), by Price Trend Analysis 2025 & 2033
- Figure 69: Asia Pacific Maize Industry neww Revenue Share (%), by Price Trend Analysis 2025 & 2033
- Figure 70: Asia Pacific Maize Industry neww Volume Share (%), by Price Trend Analysis 2025 & 2033
- Figure 71: Asia Pacific Maize Industry neww Revenue (Million), by Country 2025 & 2033
- Figure 72: Asia Pacific Maize Industry neww Volume (Kiloton), by Country 2025 & 2033
- Figure 73: Asia Pacific Maize Industry neww Revenue Share (%), by Country 2025 & 2033
- Figure 74: Asia Pacific Maize Industry neww Volume Share (%), by Country 2025 & 2033
- Figure 75: South America Maize Industry neww Revenue (Million), by Production Analysis 2025 & 2033
- Figure 76: South America Maize Industry neww Volume (Kiloton), by Production Analysis 2025 & 2033
- Figure 77: South America Maize Industry neww Revenue Share (%), by Production Analysis 2025 & 2033
- Figure 78: South America Maize Industry neww Volume Share (%), by Production Analysis 2025 & 2033
- Figure 79: South America Maize Industry neww Revenue (Million), by Consumption Analysis 2025 & 2033
- Figure 80: South America Maize Industry neww Volume (Kiloton), by Consumption Analysis 2025 & 2033
- Figure 81: South America Maize Industry neww Revenue Share (%), by Consumption Analysis 2025 & 2033
- Figure 82: South America Maize Industry neww Volume Share (%), by Consumption Analysis 2025 & 2033
- Figure 83: South America Maize Industry neww Revenue (Million), by Import Market Analysis (Value & Volume) 2025 & 2033
- Figure 84: South America Maize Industry neww Volume (Kiloton), by Import Market Analysis (Value & Volume) 2025 & 2033
- Figure 85: South America Maize Industry neww Revenue Share (%), by Import Market Analysis (Value & Volume) 2025 & 2033
- Figure 86: South America Maize Industry neww Volume Share (%), by Import Market Analysis (Value & Volume) 2025 & 2033
- Figure 87: South America Maize Industry neww Revenue (Million), by Export Market Analysis (Value & Volume) 2025 & 2033
- Figure 88: South America Maize Industry neww Volume (Kiloton), by Export Market Analysis (Value & Volume) 2025 & 2033
- Figure 89: South America Maize Industry neww Revenue Share (%), by Export Market Analysis (Value & Volume) 2025 & 2033
- Figure 90: South America Maize Industry neww Volume Share (%), by Export Market Analysis (Value & Volume) 2025 & 2033
- Figure 91: South America Maize Industry neww Revenue (Million), by Price Trend Analysis 2025 & 2033
- Figure 92: South America Maize Industry neww Volume (Kiloton), by Price Trend Analysis 2025 & 2033
- Figure 93: South America Maize Industry neww Revenue Share (%), by Price Trend Analysis 2025 & 2033
- Figure 94: South America Maize Industry neww Volume Share (%), by Price Trend Analysis 2025 & 2033
- Figure 95: South America Maize Industry neww Revenue (Million), by Country 2025 & 2033
- Figure 96: South America Maize Industry neww Volume (Kiloton), by Country 2025 & 2033
- Figure 97: South America Maize Industry neww Revenue Share (%), by Country 2025 & 2033
- Figure 98: South America Maize Industry neww Volume Share (%), by Country 2025 & 2033
- Figure 99: Africa Maize Industry neww Revenue (Million), by Production Analysis 2025 & 2033
- Figure 100: Africa Maize Industry neww Volume (Kiloton), by Production Analysis 2025 & 2033
- Figure 101: Africa Maize Industry neww Revenue Share (%), by Production Analysis 2025 & 2033
- Figure 102: Africa Maize Industry neww Volume Share (%), by Production Analysis 2025 & 2033
- Figure 103: Africa Maize Industry neww Revenue (Million), by Consumption Analysis 2025 & 2033
- Figure 104: Africa Maize Industry neww Volume (Kiloton), by Consumption Analysis 2025 & 2033
- Figure 105: Africa Maize Industry neww Revenue Share (%), by Consumption Analysis 2025 & 2033
- Figure 106: Africa Maize Industry neww Volume Share (%), by Consumption Analysis 2025 & 2033
- Figure 107: Africa Maize Industry neww Revenue (Million), by Import Market Analysis (Value & Volume) 2025 & 2033
- Figure 108: Africa Maize Industry neww Volume (Kiloton), by Import Market Analysis (Value & Volume) 2025 & 2033
- Figure 109: Africa Maize Industry neww Revenue Share (%), by Import Market Analysis (Value & Volume) 2025 & 2033
- Figure 110: Africa Maize Industry neww Volume Share (%), by Import Market Analysis (Value & Volume) 2025 & 2033
- Figure 111: Africa Maize Industry neww Revenue (Million), by Export Market Analysis (Value & Volume) 2025 & 2033
- Figure 112: Africa Maize Industry neww Volume (Kiloton), by Export Market Analysis (Value & Volume) 2025 & 2033
- Figure 113: Africa Maize Industry neww Revenue Share (%), by Export Market Analysis (Value & Volume) 2025 & 2033
- Figure 114: Africa Maize Industry neww Volume Share (%), by Export Market Analysis (Value & Volume) 2025 & 2033
- Figure 115: Africa Maize Industry neww Revenue (Million), by Price Trend Analysis 2025 & 2033
- Figure 116: Africa Maize Industry neww Volume (Kiloton), by Price Trend Analysis 2025 & 2033
- Figure 117: Africa Maize Industry neww Revenue Share (%), by Price Trend Analysis 2025 & 2033
- Figure 118: Africa Maize Industry neww Volume Share (%), by Price Trend Analysis 2025 & 2033
- Figure 119: Africa Maize Industry neww Revenue (Million), by Country 2025 & 2033
- Figure 120: Africa Maize Industry neww Volume (Kiloton), by Country 2025 & 2033
- Figure 121: Africa Maize Industry neww Revenue Share (%), by Country 2025 & 2033
- Figure 122: Africa Maize Industry neww Volume Share (%), by Country 2025 & 2033
List of Tables
- Table 1: Global Maize Industry neww Revenue Million Forecast, by Production Analysis 2020 & 2033
- Table 2: Global Maize Industry neww Volume Kiloton Forecast, by Production Analysis 2020 & 2033
- Table 3: Global Maize Industry neww Revenue Million Forecast, by Consumption Analysis 2020 & 2033
- Table 4: Global Maize Industry neww Volume Kiloton Forecast, by Consumption Analysis 2020 & 2033
- Table 5: Global Maize Industry neww Revenue Million Forecast, by Import Market Analysis (Value & Volume) 2020 & 2033
- Table 6: Global Maize Industry neww Volume Kiloton Forecast, by Import Market Analysis (Value & Volume) 2020 & 2033
- Table 7: Global Maize Industry neww Revenue Million Forecast, by Export Market Analysis (Value & Volume) 2020 & 2033
- Table 8: Global Maize Industry neww Volume Kiloton Forecast, by Export Market Analysis (Value & Volume) 2020 & 2033
- Table 9: Global Maize Industry neww Revenue Million Forecast, by Price Trend Analysis 2020 & 2033
- Table 10: Global Maize Industry neww Volume Kiloton Forecast, by Price Trend Analysis 2020 & 2033
- Table 11: Global Maize Industry neww Revenue Million Forecast, by Region 2020 & 2033
- Table 12: Global Maize Industry neww Volume Kiloton Forecast, by Region 2020 & 2033
- Table 13: Global Maize Industry neww Revenue Million Forecast, by Production Analysis 2020 & 2033
- Table 14: Global Maize Industry neww Volume Kiloton Forecast, by Production Analysis 2020 & 2033
- Table 15: Global Maize Industry neww Revenue Million Forecast, by Consumption Analysis 2020 & 2033
- Table 16: Global Maize Industry neww Volume Kiloton Forecast, by Consumption Analysis 2020 & 2033
- Table 17: Global Maize Industry neww Revenue Million Forecast, by Import Market Analysis (Value & Volume) 2020 & 2033
- Table 18: Global Maize Industry neww Volume Kiloton Forecast, by Import Market Analysis (Value & Volume) 2020 & 2033
- Table 19: Global Maize Industry neww Revenue Million Forecast, by Export Market Analysis (Value & Volume) 2020 & 2033
- Table 20: Global Maize Industry neww Volume Kiloton Forecast, by Export Market Analysis (Value & Volume) 2020 & 2033
- Table 21: Global Maize Industry neww Revenue Million Forecast, by Price Trend Analysis 2020 & 2033
- Table 22: Global Maize Industry neww Volume Kiloton Forecast, by Price Trend Analysis 2020 & 2033
- Table 23: Global Maize Industry neww Revenue Million Forecast, by Country 2020 & 2033
- Table 24: Global Maize Industry neww Volume Kiloton Forecast, by Country 2020 & 2033
- Table 25: United States Maize Industry neww Revenue (Million) Forecast, by Application 2020 & 2033
- Table 26: United States Maize Industry neww Volume (Kiloton) Forecast, by Application 2020 & 2033
- Table 27: Canada Maize Industry neww Revenue (Million) Forecast, by Application 2020 & 2033
- Table 28: Canada Maize Industry neww Volume (Kiloton) Forecast, by Application 2020 & 2033
- Table 29: Mexico Maize Industry neww Revenue (Million) Forecast, by Application 2020 & 2033
- Table 30: Mexico Maize Industry neww Volume (Kiloton) Forecast, by Application 2020 & 2033
- Table 31: Global Maize Industry neww Revenue Million Forecast, by Production Analysis 2020 & 2033
- Table 32: Global Maize Industry neww Volume Kiloton Forecast, by Production Analysis 2020 & 2033
- Table 33: Global Maize Industry neww Revenue Million Forecast, by Consumption Analysis 2020 & 2033
- Table 34: Global Maize Industry neww Volume Kiloton Forecast, by Consumption Analysis 2020 & 2033
- Table 35: Global Maize Industry neww Revenue Million Forecast, by Import Market Analysis (Value & Volume) 2020 & 2033
- Table 36: Global Maize Industry neww Volume Kiloton Forecast, by Import Market Analysis (Value & Volume) 2020 & 2033
- Table 37: Global Maize Industry neww Revenue Million Forecast, by Export Market Analysis (Value & Volume) 2020 & 2033
- Table 38: Global Maize Industry neww Volume Kiloton Forecast, by Export Market Analysis (Value & Volume) 2020 & 2033
- Table 39: Global Maize Industry neww Revenue Million Forecast, by Price Trend Analysis 2020 & 2033
- Table 40: Global Maize Industry neww Volume Kiloton Forecast, by Price Trend Analysis 2020 & 2033
- Table 41: Global Maize Industry neww Revenue Million Forecast, by Country 2020 & 2033
- Table 42: Global Maize Industry neww Volume Kiloton Forecast, by Country 2020 & 2033
- Table 43: Spain Maize Industry neww Revenue (Million) Forecast, by Application 2020 & 2033
- Table 44: Spain Maize Industry neww Volume (Kiloton) Forecast, by Application 2020 & 2033
- Table 45: Italy Maize Industry neww Revenue (Million) Forecast, by Application 2020 & 2033
- Table 46: Italy Maize Industry neww Volume (Kiloton) Forecast, by Application 2020 & 2033
- Table 47: France Maize Industry neww Revenue (Million) Forecast, by Application 2020 & 2033
- Table 48: France Maize Industry neww Volume (Kiloton) Forecast, by Application 2020 & 2033
- Table 49: Germany Maize Industry neww Revenue (Million) Forecast, by Application 2020 & 2033
- Table 50: Germany Maize Industry neww Volume (Kiloton) Forecast, by Application 2020 & 2033
- Table 51: Russia Maize Industry neww Revenue (Million) Forecast, by Application 2020 & 2033
- Table 52: Russia Maize Industry neww Volume (Kiloton) Forecast, by Application 2020 & 2033
- Table 53: Global Maize Industry neww Revenue Million Forecast, by Production Analysis 2020 & 2033
- Table 54: Global Maize Industry neww Volume Kiloton Forecast, by Production Analysis 2020 & 2033
- Table 55: Global Maize Industry neww Revenue Million Forecast, by Consumption Analysis 2020 & 2033
- Table 56: Global Maize Industry neww Volume Kiloton Forecast, by Consumption Analysis 2020 & 2033
- Table 57: Global Maize Industry neww Revenue Million Forecast, by Import Market Analysis (Value & Volume) 2020 & 2033
- Table 58: Global Maize Industry neww Volume Kiloton Forecast, by Import Market Analysis (Value & Volume) 2020 & 2033
- Table 59: Global Maize Industry neww Revenue Million Forecast, by Export Market Analysis (Value & Volume) 2020 & 2033
- Table 60: Global Maize Industry neww Volume Kiloton Forecast, by Export Market Analysis (Value & Volume) 2020 & 2033
- Table 61: Global Maize Industry neww Revenue Million Forecast, by Price Trend Analysis 2020 & 2033
- Table 62: Global Maize Industry neww Volume Kiloton Forecast, by Price Trend Analysis 2020 & 2033
- Table 63: Global Maize Industry neww Revenue Million Forecast, by Country 2020 & 2033
- Table 64: Global Maize Industry neww Volume Kiloton Forecast, by Country 2020 & 2033
- Table 65: India Maize Industry neww Revenue (Million) Forecast, by Application 2020 & 2033
- Table 66: India Maize Industry neww Volume (Kiloton) Forecast, by Application 2020 & 2033
- Table 67: China Maize Industry neww Revenue (Million) Forecast, by Application 2020 & 2033
- Table 68: China Maize Industry neww Volume (Kiloton) Forecast, by Application 2020 & 2033
- Table 69: Vietnam Maize Industry neww Revenue (Million) Forecast, by Application 2020 & 2033
- Table 70: Vietnam Maize Industry neww Volume (Kiloton) Forecast, by Application 2020 & 2033
- Table 71: Global Maize Industry neww Revenue Million Forecast, by Production Analysis 2020 & 2033
- Table 72: Global Maize Industry neww Volume Kiloton Forecast, by Production Analysis 2020 & 2033
- Table 73: Global Maize Industry neww Revenue Million Forecast, by Consumption Analysis 2020 & 2033
- Table 74: Global Maize Industry neww Volume Kiloton Forecast, by Consumption Analysis 2020 & 2033
- Table 75: Global Maize Industry neww Revenue Million Forecast, by Import Market Analysis (Value & Volume) 2020 & 2033
- Table 76: Global Maize Industry neww Volume Kiloton Forecast, by Import Market Analysis (Value & Volume) 2020 & 2033
- Table 77: Global Maize Industry neww Revenue Million Forecast, by Export Market Analysis (Value & Volume) 2020 & 2033
- Table 78: Global Maize Industry neww Volume Kiloton Forecast, by Export Market Analysis (Value & Volume) 2020 & 2033
- Table 79: Global Maize Industry neww Revenue Million Forecast, by Price Trend Analysis 2020 & 2033
- Table 80: Global Maize Industry neww Volume Kiloton Forecast, by Price Trend Analysis 2020 & 2033
- Table 81: Global Maize Industry neww Revenue Million Forecast, by Country 2020 & 2033
- Table 82: Global Maize Industry neww Volume Kiloton Forecast, by Country 2020 & 2033
- Table 83: Brazil Maize Industry neww Revenue (Million) Forecast, by Application 2020 & 2033
- Table 84: Brazil Maize Industry neww Volume (Kiloton) Forecast, by Application 2020 & 2033
- Table 85: Argentina Maize Industry neww Revenue (Million) Forecast, by Application 2020 & 2033
- Table 86: Argentina Maize Industry neww Volume (Kiloton) Forecast, by Application 2020 & 2033
- Table 87: Global Maize Industry neww Revenue Million Forecast, by Production Analysis 2020 & 2033
- Table 88: Global Maize Industry neww Volume Kiloton Forecast, by Production Analysis 2020 & 2033
- Table 89: Global Maize Industry neww Revenue Million Forecast, by Consumption Analysis 2020 & 2033
- Table 90: Global Maize Industry neww Volume Kiloton Forecast, by Consumption Analysis 2020 & 2033
- Table 91: Global Maize Industry neww Revenue Million Forecast, by Import Market Analysis (Value & Volume) 2020 & 2033
- Table 92: Global Maize Industry neww Volume Kiloton Forecast, by Import Market Analysis (Value & Volume) 2020 & 2033
- Table 93: Global Maize Industry neww Revenue Million Forecast, by Export Market Analysis (Value & Volume) 2020 & 2033
- Table 94: Global Maize Industry neww Volume Kiloton Forecast, by Export Market Analysis (Value & Volume) 2020 & 2033
- Table 95: Global Maize Industry neww Revenue Million Forecast, by Price Trend Analysis 2020 & 2033
- Table 96: Global Maize Industry neww Volume Kiloton Forecast, by Price Trend Analysis 2020 & 2033
- Table 97: Global Maize Industry neww Revenue Million Forecast, by Country 2020 & 2033
- Table 98: Global Maize Industry neww Volume Kiloton Forecast, by Country 2020 & 2033
- Table 99: South Africa Maize Industry neww Revenue (Million) Forecast, by Application 2020 & 2033
- Table 100: South Africa Maize Industry neww Volume (Kiloton) Forecast, by Application 2020 & 2033
- Table 101: Nigeria Maize Industry neww Revenue (Million) Forecast, by Application 2020 & 2033
- Table 102: Nigeria Maize Industry neww Volume (Kiloton) Forecast, by Application 2020 & 2033
Frequently Asked Questions
1. What is the projected Compound Annual Growth Rate (CAGR) of the Maize Industry neww?
The projected CAGR is approximately 3.01%.
2. Which companies are prominent players in the Maize Industry neww?
Key companies in the market include ADM, Syngenta Crop Protection , Société Générale de Surveillance (SGS) , Bayer Crop Science , Bunge , Bunge Limited , Cargill, Incorporated , Corteva Agriscience , ADM , Olam Group .
3. What are the main segments of the Maize Industry neww?
The market segments include Production Analysis, Consumption Analysis, Import Market Analysis (Value & Volume), Export Market Analysis (Value & Volume), Price Trend Analysis.
4. Can you provide details about the market size?
The market size is estimated to be USD 143.62 Million as of 2022.
5. What are some drivers contributing to market growth?
N/A
6. What are the notable trends driving market growth?
Increase in Demand for Animal-based Protein Sources.
7. Are there any restraints impacting market growth?
N/A
8. Can you provide examples of recent developments in the market?
October 2022: Ghana's President, Nana Addo Dankwa Akufo-Addo, inaugurated an ultramodern maize processing factory at Nsuta-Kwagye in the Sekyere-Central District of the Ashanti Region, as part of the "One District, One Factory" initiative. The facility is equipped with cutting-edge processing equipment, such as a maize drying plant, a grit milling machine, and many more.
9. What pricing options are available for accessing the report?
Pricing options include single-user, multi-user, and enterprise licenses priced at USD 4750, USD 5250, and USD 8750 respectively.
10. Is the market size provided in terms of value or volume?
The market size is provided in terms of value, measured in Million and volume, measured in Kiloton.
11. Are there any specific market keywords associated with the report?
Yes, the market keyword associated with the report is "Maize Industry neww," which aids in identifying and referencing the specific market segment covered.
12. How do I determine which pricing option suits my needs best?
The pricing options vary based on user requirements and access needs. Individual users may opt for single-user licenses, while businesses requiring broader access may choose multi-user or enterprise licenses for cost-effective access to the report.
13. Are there any additional resources or data provided in the Maize Industry neww report?
While the report offers comprehensive insights, it's advisable to review the specific contents or supplementary materials provided to ascertain if additional resources or data are available.
14. How can I stay updated on further developments or reports in the Maize Industry neww?
To stay informed about further developments, trends, and reports in the Maize Industry neww, consider subscribing to industry newsletters, following relevant companies and organizations, or regularly checking reputable industry news sources and publications.
Methodology
Step 1 - Identification of Relevant Samples Size from Population Database


Step 2 - Approaches for Defining Global Market Size (Value, Volume* & Price*)

Note*: In applicable scenarios
Step 3 - Data Sources
Primary Research
- Web Analytics
- Survey Reports
- Research Institute
- Latest Research Reports
- Opinion Leaders
Secondary Research
- Annual Reports
- White Paper
- Latest Press Release
- Industry Association
- Paid Database
- Investor Presentations

Step 4 - Data Triangulation
Involves using different sources of information in order to increase the validity of a study
These sources are likely to be stakeholders in a program - participants, other researchers, program staff, other community members, and so on.
Then we put all data in single framework & apply various statistical tools to find out the dynamic on the market.
During the analysis stage, feedback from the stakeholder groups would be compared to determine areas of agreement as well as areas of divergence