

Key Insights
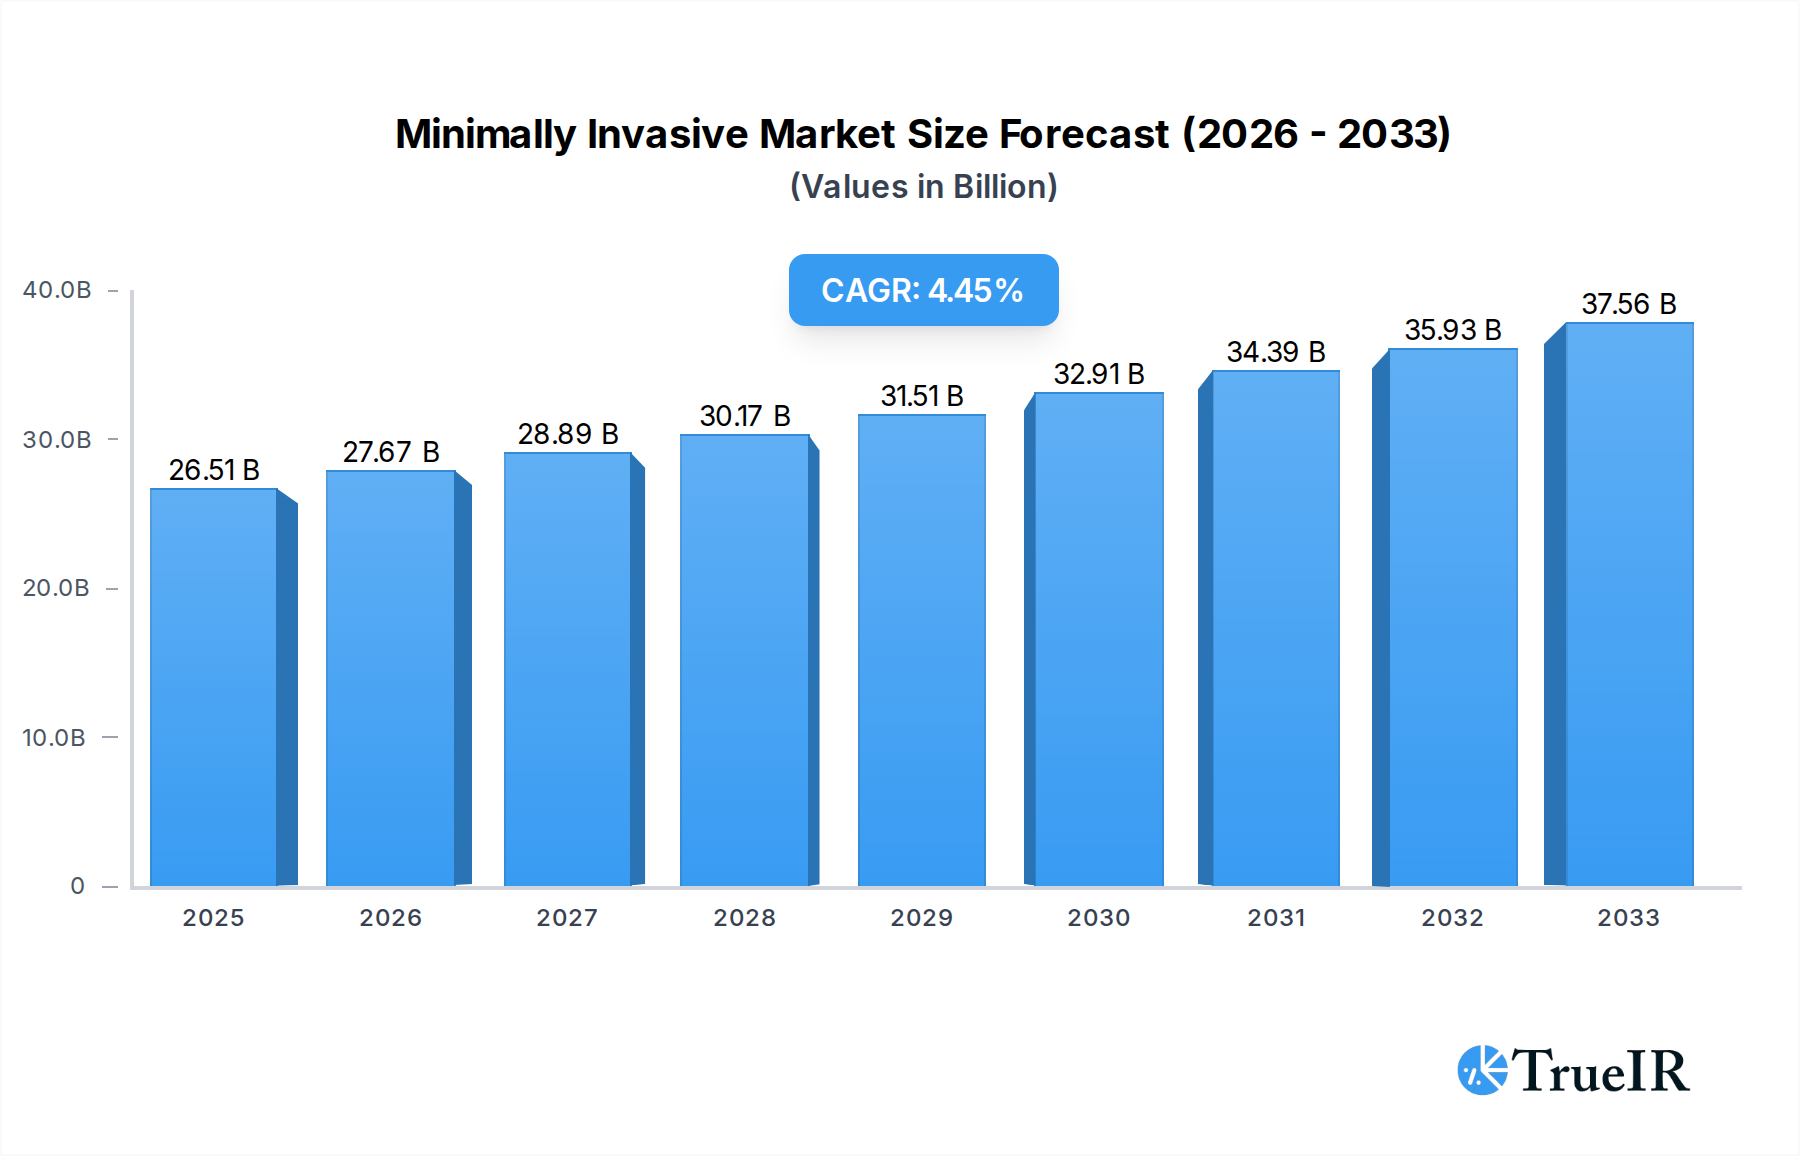
The Minimally Invasive & Non-Invasive Medical Imaging and Visualization System market is poised for significant expansion, projected to reach $26.51 billion in 2025 and grow at a robust CAGR of 4.4% through 2033. This upward trajectory is propelled by an increasing global demand for advanced diagnostic and therapeutic solutions that reduce patient trauma, shorten recovery times, and enhance procedural accuracy. The growing prevalence of chronic diseases across various medical disciplines, including neurology, cardiology, and orthopedics, is a primary driver, necessitating sophisticated imaging technologies for early detection and precise intervention. Furthermore, the continuous technological advancements in imaging modalities such as ultrasound, CT, MRI, and nuclear imaging, coupled with the integration of AI and machine learning for enhanced image analysis and interpretation, are fueling market growth. The shift towards value-based healthcare and the increasing adoption of these systems in ambulatory surgical centers and diagnostic imaging facilities are also contributing factors.

Minimally Invasive & Non-Invasive Medical Imaging And Visualization System Market Size (In Billion)
The market's growth is further bolstered by a supportive regulatory environment in developed regions, encouraging innovation and the adoption of cutting-edge medical devices. Key trends include the miniaturization of imaging probes, the development of hybrid imaging systems, and the growing application of augmented reality and virtual reality in surgical planning and navigation. While the high cost of advanced imaging equipment and the need for specialized training can present challenges, the long-term benefits of improved patient outcomes and reduced healthcare costs are expected to outweigh these restraints. Major players are actively investing in research and development, strategic partnerships, and acquisitions to expand their product portfolios and geographical reach, intensifying competition and driving innovation within this dynamic market.
Minimally Invasive & Non-Invasive Medical Imaging And Visualization System Company Market Share
This comprehensive report offers an in-depth analysis of the Minimally Invasive & Non-Invasive Medical Imaging And Visualization System market. With a study period spanning from 2019 to 2033, and a base year of 2025, this report provides invaluable insights into market dynamics, trends, and future projections. The estimated year is also 2025, with a robust forecast period from 2025 to 2033, building upon historical data from 2019 to 2024. This report is essential for stakeholders seeking to understand the trajectory of advanced medical imaging technologies that are revolutionizing patient care and diagnostics.
Minimally Invasive & Non-Invasive Medical Imaging And Visualization System Market Structure & Competitive Landscape
The minimally invasive & non-invasive medical imaging and visualization system market exhibits a XX% market concentration, indicating a moderately competitive landscape. Innovation is primarily driven by advancements in artificial intelligence for image analysis, miniaturization of imaging devices, and the integration of augmented reality for enhanced visualization. Regulatory frameworks, particularly those from the FDA and EMA, are crucial in shaping product development and market entry. The threat of product substitutes is moderate, with traditional open surgical procedures posing the most significant alternative in specific niche applications. End-user segmentation is robust, with hospitals and diagnostic centers accounting for the largest share. Mergers and acquisitions (M&A) trends show a consistent pattern of consolidation, with approximately XX M&A deals recorded in the historical period, valued at over Billion. Key players are strategically acquiring smaller innovators to expand their technological portfolios and market reach.
- Key Innovation Drivers:
- AI-powered image interpretation and diagnosis
- Development of ultra-portable and handheld imaging devices
- Integration of AR/VR for surgical guidance and training
- Enhanced resolution and contrast agents
- Regulatory Impacts: Strict approval processes for new imaging modalities and software, data privacy regulations (e.g., HIPAA, GDPR).
- End-User Segmentation:
- Hospitals
- Diagnostic Imaging Centers
- Surgical Centers
- Research Institutions
- M&A Trends: Strategic acquisitions of AI startups, companies specializing in advanced sensor technology, and regional distributors.
Minimally Invasive & Non-Invasive Medical Imaging And Visualization System Market Trends & Opportunities
The global minimally invasive & non-invasive medical imaging and visualization system market is projected to experience substantial growth, driven by an increasing demand for less invasive diagnostic and therapeutic procedures. The market size is anticipated to reach over Billion by the end of the forecast period, exhibiting a compound annual growth rate (CAGR) of XX%. Technological shifts are a primary catalyst, with continuous innovations in ultrasound, CT, MRI, and X-ray imaging systems enhancing diagnostic accuracy and patient comfort. The adoption of AI and machine learning algorithms for image processing and interpretation is revolutionizing diagnostic capabilities, enabling earlier detection of diseases and more precise treatment planning. Consumer preferences are increasingly leaning towards procedures that offer shorter recovery times, reduced pain, and fewer complications, which directly fuels the demand for minimally invasive and non-invasive technologies.
The competitive dynamics within the market are characterized by intense R&D investments, strategic partnerships, and a focus on developing integrated imaging and visualization solutions. Companies are striving to offer comprehensive platforms that combine imaging hardware, advanced software, and data analytics to provide end-to-end solutions for healthcare providers. The growing prevalence of chronic diseases such as cardiovascular disorders, neurological conditions, and cancer is a significant market driver, as these conditions often necessitate frequent and precise imaging for diagnosis, monitoring, and treatment. Furthermore, the expanding healthcare infrastructure in emerging economies, coupled with increasing healthcare expenditure, presents considerable market penetration opportunities for advanced imaging systems.
The development of portable and point-of-care imaging devices is another key trend, enabling diagnostics to be performed closer to the patient, thereby improving accessibility and reducing healthcare costs. This is particularly impactful in remote areas or during public health emergencies. The integration of robotic surgery with advanced imaging and visualization systems is creating new avenues for complex procedures to be performed with greater precision and control. The market is also witnessing a surge in the development of specialized imaging techniques for niche applications, such as fetal imaging in obstetrics or advanced endoscopic visualization in gastroenterology. Opportunities also lie in developing cost-effective imaging solutions that can cater to the needs of resource-limited settings without compromising on diagnostic quality.
Dominant Markets & Segments in Minimally Invasive & Non-Invasive Medical Imaging And Visualization System
The Cardiology segment, driven by the escalating burden of cardiovascular diseases globally, emerges as a dominant application within the minimally invasive & non-invasive medical imaging and visualization system market. This dominance is further bolstered by the continuous innovation in cardiac imaging modalities such as echocardiography, cardiac CT, and cardiac MRI, which offer unparalleled insights into cardiac function and structure with minimal patient invasiveness. The United States stands as the leading regional market, fueled by high healthcare expenditure, advanced technological adoption, and a well-established reimbursement framework for sophisticated diagnostic procedures.
Within the 'Types' segment, Ultrasound systems continue to command a significant market share due to their inherent advantages of being portable, radiation-free, and cost-effective. However, CT Imaging is experiencing robust growth, particularly in its advanced iterations like dual-energy CT and spectral CT, which provide enhanced diagnostic information for a wide range of pathologies. The increasing demand for detailed anatomical visualization in complex surgical planning further propels CT imaging's market penetration.
- Dominant Application Segment: Cardiology
- Key Growth Drivers:
- Rising global incidence of cardiovascular diseases (e.g., heart failure, coronary artery disease).
- Technological advancements in echocardiography (e.g., 3D/4D imaging, strain imaging).
- Increased use of CT angiography for non-invasive assessment of coronary arteries.
- Development of advanced MRI techniques for myocardial tissue characterization.
- Growing preference for interventional cardiology procedures requiring precise imaging guidance.
- Key Growth Drivers:
- Dominant Regional Market: United States
- Key Growth Drivers:
- High prevalence of chronic diseases.
- Strong reimbursement policies for advanced medical technologies.
- Significant investment in healthcare R&D and infrastructure.
- Early adoption of cutting-edge medical imaging innovations.
- Presence of major medical device manufacturers and research institutions.
- Key Growth Drivers:
- Dominant Type Segment: Ultrasound & CT Imaging
- Ultrasound Growth Drivers:
- Portability and ease of use.
- No ionizing radiation exposure.
- Cost-effectiveness compared to other modalities.
- Versatility across various medical specialties.
- CT Imaging Growth Drivers:
- High spatial resolution and rapid scan times.
- Advancements in spectral and dual-energy CT for material decomposition.
- Increasing use in trauma, oncology, and cardiovascular imaging.
- Development of lower-dose CT technologies.
- Ultrasound Growth Drivers:
Minimally Invasive & Non-Invasive Medical Imaging And Visualization System Product Analysis
The minimally invasive & non-invasive medical imaging and visualization system market is characterized by a continuous influx of innovative products that enhance diagnostic accuracy, patient comfort, and procedural efficiency. Recent product launches highlight advancements in AI-powered image analysis, offering automated detection of anomalies and quantitative assessments. The development of ultra-high-resolution ultrasound probes and compact MRI systems are key technological breakthroughs. These innovations provide superior image quality, enabling earlier and more precise disease diagnosis. Competitive advantages are derived from enhanced visualization capabilities, reduced scan times, and the integration of these systems into existing healthcare workflows, ultimately leading to improved patient outcomes and reduced healthcare costs.
Key Drivers, Barriers & Challenges in Minimally Invasive & Non-Invasive Medical Imaging And Visualization System
The minimally invasive & non-invasive medical imaging and visualization system market is propelled by several key drivers, including the increasing global prevalence of chronic diseases necessitating advanced diagnostics, rapid technological advancements in imaging modalities, and a growing preference among patients and healthcare providers for less invasive procedures that offer quicker recovery times and reduced pain. Favorable reimbursement policies and government initiatives promoting adoption of advanced medical technologies also play a significant role.
However, the market faces substantial challenges and restraints. High initial capital investment for advanced imaging equipment, coupled with ongoing maintenance costs, can be a barrier, especially for smaller healthcare facilities. Stringent regulatory approval processes and evolving compliance requirements add to the development timelines and costs. Furthermore, the need for skilled personnel to operate and interpret complex imaging systems presents a workforce challenge. Supply chain disruptions and the potential for cybersecurity threats to sensitive patient imaging data also pose significant risks.
Growth Drivers in the Minimally Invasive & Non-Invasive Medical Imaging And Visualization System Market
Key growth drivers for the minimally invasive & non-invasive medical imaging and visualization system market include the escalating global burden of chronic diseases such as cancer, cardiovascular disorders, and neurological conditions, which demand continuous and precise diagnostic monitoring. Technological advancements, particularly in AI-driven image analysis, miniaturization of devices, and enhanced resolution across modalities like Ultrasound, CT, MRI, and X-ray, are pivotal. Furthermore, a societal shift towards patient-centric care, favoring procedures with reduced pain and faster recovery, significantly boosts demand. Favorable reimbursement policies and government support for healthcare infrastructure development in emerging economies also contribute to market expansion.
Challenges Impacting Minimally Invasive & Non-Invasive Medical Imaging And Visualization System Growth
Several challenges impact the growth of the minimally invasive & non-invasive medical imaging and visualization system market. The high cost of advanced imaging equipment and associated software licenses represents a significant barrier to adoption, particularly for smaller healthcare providers and in developing regions. Stringent and evolving regulatory landscapes for medical devices and software require substantial investment in compliance and can prolong product launch timelines. Supply chain vulnerabilities, exacerbated by geopolitical events, can lead to delays in component procurement and increased manufacturing costs. Moreover, intense competition among established players and emerging innovators necessitates continuous investment in R&D to maintain market share, while data security and privacy concerns related to increasingly connected imaging systems remain a critical challenge.
Key Players Shaping the Minimally Invasive & Non-Invasive Medical Imaging And Visualization System Market
- Smith & Nephew
- Boston Scientific
- Medtronic
- Siemens
- CONMED Corporation
- GE
- Stryker
- Olympus
- KARL STORZ
- FUJIFILM Corporation
- Philips
- B. Braun
- Johnson and Johnson
Significant Minimally Invasive & Non-Invasive Medical Imaging And Visualization System Industry Milestones
- 2019: Launch of AI-powered diagnostic software for enhanced detection of early-stage cancers in CT scans.
- 2020: Introduction of a portable ultrasound device with cloud connectivity for remote diagnostics.
- 2021: FDA approval for a new generation of low-dose CT scanners with improved image reconstruction algorithms.
- 2022: Major acquisition of a leading AR/VR visualization company by a prominent medical imaging vendor to enhance surgical planning capabilities.
- 2023: Release of a novel MRI contrast agent with improved safety profile and enhanced image contrast.
- January 2024: Significant advancements in real-time 3D echocardiography technology enabling more precise cardiac interventions.
- April 2024: Introduction of a miniaturized endoscopic imaging capsule for comprehensive gastrointestinal examination.
- July 2024: Development of a wearable ultrasound device for continuous patient monitoring.
- October 2024: Regulatory approval for an integrated AI platform that consolidates data from multiple imaging modalities for a holistic patient view.
- December 2024: Launch of a next-generation X-ray imaging system with reduced radiation exposure and enhanced image detail.
Future Outlook for Minimally Invasive & Non-Invasive Medical Imaging And Visualization System Market
The future outlook for the minimally invasive & non-invasive medical imaging and visualization system market is exceptionally promising, driven by ongoing technological innovation and a persistent global demand for advanced, patient-friendly healthcare solutions. Expect a continued surge in AI integration, leading to more automated diagnoses, personalized treatment pathways, and predictive analytics. The miniaturization and portability of imaging devices will further democratize access to high-quality diagnostics, expanding reach into remote and underserved areas. The convergence of imaging with robotics and augmented reality will unlock new possibilities for complex surgeries and interventions. Strategic collaborations, market expansion into emerging economies, and a relentless focus on improving diagnostic accuracy and patient outcomes will define the growth trajectory, solidifying this market's critical role in modern medicine.
Minimally Invasive & Non-Invasive Medical Imaging And Visualization System Segmentation
-
1. Application
- 1.1. Neurology
- 1.2. Cardiology
- 1.3. Gastrointestinal
- 1.4. Orthopedic
- 1.5. Gynecological
- 1.6. Other
-
2. Types
- 2.1. Ultrasound
- 2.2. CT Imaging
- 2.3. X-ray Imaging
- 2.4. MRI Imaging
- 2.5. Nuclear Imaging
- 2.6. Other
Minimally Invasive & Non-Invasive Medical Imaging And Visualization System Segmentation By Geography
-
1. North America
- 1.1. United States
- 1.2. Canada
- 1.3. Mexico
-
2. South America
- 2.1. Brazil
- 2.2. Argentina
- 2.3. Rest of South America
-
3. Europe
- 3.1. United Kingdom
- 3.2. Germany
- 3.3. France
- 3.4. Italy
- 3.5. Spain
- 3.6. Russia
- 3.7. Benelux
- 3.8. Nordics
- 3.9. Rest of Europe
-
4. Middle East & Africa
- 4.1. Turkey
- 4.2. Israel
- 4.3. GCC
- 4.4. North Africa
- 4.5. South Africa
- 4.6. Rest of Middle East & Africa
-
5. Asia Pacific
- 5.1. China
- 5.2. India
- 5.3. Japan
- 5.4. South Korea
- 5.5. ASEAN
- 5.6. Oceania
- 5.7. Rest of Asia Pacific

Minimally Invasive & Non-Invasive Medical Imaging And Visualization System Regional Market Share
Geographic Coverage of Minimally Invasive & Non-Invasive Medical Imaging And Visualization System
Minimally Invasive & Non-Invasive Medical Imaging And Visualization System REPORT HIGHLIGHTS
| Aspects | Details |
|---|---|
| Study Period | 2020-2034 |
| Base Year | 2025 |
| Estimated Year | 2026 |
| Forecast Period | 2026-2034 |
| Historical Period | 2020-2025 |
| Growth Rate | CAGR of 4.4% from 2020-2034 |
| Segmentation |
|
Table of Contents
- 1. Introduction
- 1.1. Research Scope
- 1.2. Market Segmentation
- 1.3. Research Methodology
- 1.4. Definitions and Assumptions
- 2. Executive Summary
- 2.1. Introduction
- 3. Market Dynamics
- 3.1. Introduction
- 3.2. Market Drivers
- 3.3. Market Restrains
- 3.4. Market Trends
- 4. Market Factor Analysis
- 4.1. Porters Five Forces
- 4.2. Supply/Value Chain
- 4.3. PESTEL analysis
- 4.4. Market Entropy
- 4.5. Patent/Trademark Analysis
- 5. Global Minimally Invasive & Non-Invasive Medical Imaging And Visualization System Analysis, Insights and Forecast, 2020-2032
- 5.1. Market Analysis, Insights and Forecast - by Application
- 5.1.1. Neurology
- 5.1.2. Cardiology
- 5.1.3. Gastrointestinal
- 5.1.4. Orthopedic
- 5.1.5. Gynecological
- 5.1.6. Other
- 5.2. Market Analysis, Insights and Forecast - by Types
- 5.2.1. Ultrasound
- 5.2.2. CT Imaging
- 5.2.3. X-ray Imaging
- 5.2.4. MRI Imaging
- 5.2.5. Nuclear Imaging
- 5.2.6. Other
- 5.3. Market Analysis, Insights and Forecast - by Region
- 5.3.1. North America
- 5.3.2. South America
- 5.3.3. Europe
- 5.3.4. Middle East & Africa
- 5.3.5. Asia Pacific
- 5.1. Market Analysis, Insights and Forecast - by Application
- 6. North America Minimally Invasive & Non-Invasive Medical Imaging And Visualization System Analysis, Insights and Forecast, 2020-2032
- 6.1. Market Analysis, Insights and Forecast - by Application
- 6.1.1. Neurology
- 6.1.2. Cardiology
- 6.1.3. Gastrointestinal
- 6.1.4. Orthopedic
- 6.1.5. Gynecological
- 6.1.6. Other
- 6.2. Market Analysis, Insights and Forecast - by Types
- 6.2.1. Ultrasound
- 6.2.2. CT Imaging
- 6.2.3. X-ray Imaging
- 6.2.4. MRI Imaging
- 6.2.5. Nuclear Imaging
- 6.2.6. Other
- 6.1. Market Analysis, Insights and Forecast - by Application
- 7. South America Minimally Invasive & Non-Invasive Medical Imaging And Visualization System Analysis, Insights and Forecast, 2020-2032
- 7.1. Market Analysis, Insights and Forecast - by Application
- 7.1.1. Neurology
- 7.1.2. Cardiology
- 7.1.3. Gastrointestinal
- 7.1.4. Orthopedic
- 7.1.5. Gynecological
- 7.1.6. Other
- 7.2. Market Analysis, Insights and Forecast - by Types
- 7.2.1. Ultrasound
- 7.2.2. CT Imaging
- 7.2.3. X-ray Imaging
- 7.2.4. MRI Imaging
- 7.2.5. Nuclear Imaging
- 7.2.6. Other
- 7.1. Market Analysis, Insights and Forecast - by Application
- 8. Europe Minimally Invasive & Non-Invasive Medical Imaging And Visualization System Analysis, Insights and Forecast, 2020-2032
- 8.1. Market Analysis, Insights and Forecast - by Application
- 8.1.1. Neurology
- 8.1.2. Cardiology
- 8.1.3. Gastrointestinal
- 8.1.4. Orthopedic
- 8.1.5. Gynecological
- 8.1.6. Other
- 8.2. Market Analysis, Insights and Forecast - by Types
- 8.2.1. Ultrasound
- 8.2.2. CT Imaging
- 8.2.3. X-ray Imaging
- 8.2.4. MRI Imaging
- 8.2.5. Nuclear Imaging
- 8.2.6. Other
- 8.1. Market Analysis, Insights and Forecast - by Application
- 9. Middle East & Africa Minimally Invasive & Non-Invasive Medical Imaging And Visualization System Analysis, Insights and Forecast, 2020-2032
- 9.1. Market Analysis, Insights and Forecast - by Application
- 9.1.1. Neurology
- 9.1.2. Cardiology
- 9.1.3. Gastrointestinal
- 9.1.4. Orthopedic
- 9.1.5. Gynecological
- 9.1.6. Other
- 9.2. Market Analysis, Insights and Forecast - by Types
- 9.2.1. Ultrasound
- 9.2.2. CT Imaging
- 9.2.3. X-ray Imaging
- 9.2.4. MRI Imaging
- 9.2.5. Nuclear Imaging
- 9.2.6. Other
- 9.1. Market Analysis, Insights and Forecast - by Application
- 10. Asia Pacific Minimally Invasive & Non-Invasive Medical Imaging And Visualization System Analysis, Insights and Forecast, 2020-2032
- 10.1. Market Analysis, Insights and Forecast - by Application
- 10.1.1. Neurology
- 10.1.2. Cardiology
- 10.1.3. Gastrointestinal
- 10.1.4. Orthopedic
- 10.1.5. Gynecological
- 10.1.6. Other
- 10.2. Market Analysis, Insights and Forecast - by Types
- 10.2.1. Ultrasound
- 10.2.2. CT Imaging
- 10.2.3. X-ray Imaging
- 10.2.4. MRI Imaging
- 10.2.5. Nuclear Imaging
- 10.2.6. Other
- 10.1. Market Analysis, Insights and Forecast - by Application
- 11. Competitive Analysis
- 11.1. Global Market Share Analysis 2025
- 11.2. Company Profiles
- 11.2.1 Smith & Nephew
- 11.2.1.1. Overview
- 11.2.1.2. Products
- 11.2.1.3. SWOT Analysis
- 11.2.1.4. Recent Developments
- 11.2.1.5. Financials (Based on Availability)
- 11.2.2 Boston Scientific
- 11.2.2.1. Overview
- 11.2.2.2. Products
- 11.2.2.3. SWOT Analysis
- 11.2.2.4. Recent Developments
- 11.2.2.5. Financials (Based on Availability)
- 11.2.3 Medtronic
- 11.2.3.1. Overview
- 11.2.3.2. Products
- 11.2.3.3. SWOT Analysis
- 11.2.3.4. Recent Developments
- 11.2.3.5. Financials (Based on Availability)
- 11.2.4 Siemens
- 11.2.4.1. Overview
- 11.2.4.2. Products
- 11.2.4.3. SWOT Analysis
- 11.2.4.4. Recent Developments
- 11.2.4.5. Financials (Based on Availability)
- 11.2.5 CONMED Corporation
- 11.2.5.1. Overview
- 11.2.5.2. Products
- 11.2.5.3. SWOT Analysis
- 11.2.5.4. Recent Developments
- 11.2.5.5. Financials (Based on Availability)
- 11.2.6 GE
- 11.2.6.1. Overview
- 11.2.6.2. Products
- 11.2.6.3. SWOT Analysis
- 11.2.6.4. Recent Developments
- 11.2.6.5. Financials (Based on Availability)
- 11.2.7 Stryker
- 11.2.7.1. Overview
- 11.2.7.2. Products
- 11.2.7.3. SWOT Analysis
- 11.2.7.4. Recent Developments
- 11.2.7.5. Financials (Based on Availability)
- 11.2.8 Olympus
- 11.2.8.1. Overview
- 11.2.8.2. Products
- 11.2.8.3. SWOT Analysis
- 11.2.8.4. Recent Developments
- 11.2.8.5. Financials (Based on Availability)
- 11.2.9 KARL STORZ
- 11.2.9.1. Overview
- 11.2.9.2. Products
- 11.2.9.3. SWOT Analysis
- 11.2.9.4. Recent Developments
- 11.2.9.5. Financials (Based on Availability)
- 11.2.10 FUJIFILM Corporation.
- 11.2.10.1. Overview
- 11.2.10.2. Products
- 11.2.10.3. SWOT Analysis
- 11.2.10.4. Recent Developments
- 11.2.10.5. Financials (Based on Availability)
- 11.2.11 Philips
- 11.2.11.1. Overview
- 11.2.11.2. Products
- 11.2.11.3. SWOT Analysis
- 11.2.11.4. Recent Developments
- 11.2.11.5. Financials (Based on Availability)
- 11.2.12 B. Braun
- 11.2.12.1. Overview
- 11.2.12.2. Products
- 11.2.12.3. SWOT Analysis
- 11.2.12.4. Recent Developments
- 11.2.12.5. Financials (Based on Availability)
- 11.2.13 Johnson and Johnson
- 11.2.13.1. Overview
- 11.2.13.2. Products
- 11.2.13.3. SWOT Analysis
- 11.2.13.4. Recent Developments
- 11.2.13.5. Financials (Based on Availability)
- 11.2.1 Smith & Nephew
List of Figures
- Figure 1: Global Minimally Invasive & Non-Invasive Medical Imaging And Visualization System Revenue Breakdown (billion, %) by Region 2025 & 2033
- Figure 2: North America Minimally Invasive & Non-Invasive Medical Imaging And Visualization System Revenue (billion), by Application 2025 & 2033
- Figure 3: North America Minimally Invasive & Non-Invasive Medical Imaging And Visualization System Revenue Share (%), by Application 2025 & 2033
- Figure 4: North America Minimally Invasive & Non-Invasive Medical Imaging And Visualization System Revenue (billion), by Types 2025 & 2033
- Figure 5: North America Minimally Invasive & Non-Invasive Medical Imaging And Visualization System Revenue Share (%), by Types 2025 & 2033
- Figure 6: North America Minimally Invasive & Non-Invasive Medical Imaging And Visualization System Revenue (billion), by Country 2025 & 2033
- Figure 7: North America Minimally Invasive & Non-Invasive Medical Imaging And Visualization System Revenue Share (%), by Country 2025 & 2033
- Figure 8: South America Minimally Invasive & Non-Invasive Medical Imaging And Visualization System Revenue (billion), by Application 2025 & 2033
- Figure 9: South America Minimally Invasive & Non-Invasive Medical Imaging And Visualization System Revenue Share (%), by Application 2025 & 2033
- Figure 10: South America Minimally Invasive & Non-Invasive Medical Imaging And Visualization System Revenue (billion), by Types 2025 & 2033
- Figure 11: South America Minimally Invasive & Non-Invasive Medical Imaging And Visualization System Revenue Share (%), by Types 2025 & 2033
- Figure 12: South America Minimally Invasive & Non-Invasive Medical Imaging And Visualization System Revenue (billion), by Country 2025 & 2033
- Figure 13: South America Minimally Invasive & Non-Invasive Medical Imaging And Visualization System Revenue Share (%), by Country 2025 & 2033
- Figure 14: Europe Minimally Invasive & Non-Invasive Medical Imaging And Visualization System Revenue (billion), by Application 2025 & 2033
- Figure 15: Europe Minimally Invasive & Non-Invasive Medical Imaging And Visualization System Revenue Share (%), by Application 2025 & 2033
- Figure 16: Europe Minimally Invasive & Non-Invasive Medical Imaging And Visualization System Revenue (billion), by Types 2025 & 2033
- Figure 17: Europe Minimally Invasive & Non-Invasive Medical Imaging And Visualization System Revenue Share (%), by Types 2025 & 2033
- Figure 18: Europe Minimally Invasive & Non-Invasive Medical Imaging And Visualization System Revenue (billion), by Country 2025 & 2033
- Figure 19: Europe Minimally Invasive & Non-Invasive Medical Imaging And Visualization System Revenue Share (%), by Country 2025 & 2033
- Figure 20: Middle East & Africa Minimally Invasive & Non-Invasive Medical Imaging And Visualization System Revenue (billion), by Application 2025 & 2033
- Figure 21: Middle East & Africa Minimally Invasive & Non-Invasive Medical Imaging And Visualization System Revenue Share (%), by Application 2025 & 2033
- Figure 22: Middle East & Africa Minimally Invasive & Non-Invasive Medical Imaging And Visualization System Revenue (billion), by Types 2025 & 2033
- Figure 23: Middle East & Africa Minimally Invasive & Non-Invasive Medical Imaging And Visualization System Revenue Share (%), by Types 2025 & 2033
- Figure 24: Middle East & Africa Minimally Invasive & Non-Invasive Medical Imaging And Visualization System Revenue (billion), by Country 2025 & 2033
- Figure 25: Middle East & Africa Minimally Invasive & Non-Invasive Medical Imaging And Visualization System Revenue Share (%), by Country 2025 & 2033
- Figure 26: Asia Pacific Minimally Invasive & Non-Invasive Medical Imaging And Visualization System Revenue (billion), by Application 2025 & 2033
- Figure 27: Asia Pacific Minimally Invasive & Non-Invasive Medical Imaging And Visualization System Revenue Share (%), by Application 2025 & 2033
- Figure 28: Asia Pacific Minimally Invasive & Non-Invasive Medical Imaging And Visualization System Revenue (billion), by Types 2025 & 2033
- Figure 29: Asia Pacific Minimally Invasive & Non-Invasive Medical Imaging And Visualization System Revenue Share (%), by Types 2025 & 2033
- Figure 30: Asia Pacific Minimally Invasive & Non-Invasive Medical Imaging And Visualization System Revenue (billion), by Country 2025 & 2033
- Figure 31: Asia Pacific Minimally Invasive & Non-Invasive Medical Imaging And Visualization System Revenue Share (%), by Country 2025 & 2033
List of Tables
- Table 1: Global Minimally Invasive & Non-Invasive Medical Imaging And Visualization System Revenue billion Forecast, by Application 2020 & 2033
- Table 2: Global Minimally Invasive & Non-Invasive Medical Imaging And Visualization System Revenue billion Forecast, by Types 2020 & 2033
- Table 3: Global Minimally Invasive & Non-Invasive Medical Imaging And Visualization System Revenue billion Forecast, by Region 2020 & 2033
- Table 4: Global Minimally Invasive & Non-Invasive Medical Imaging And Visualization System Revenue billion Forecast, by Application 2020 & 2033
- Table 5: Global Minimally Invasive & Non-Invasive Medical Imaging And Visualization System Revenue billion Forecast, by Types 2020 & 2033
- Table 6: Global Minimally Invasive & Non-Invasive Medical Imaging And Visualization System Revenue billion Forecast, by Country 2020 & 2033
- Table 7: United States Minimally Invasive & Non-Invasive Medical Imaging And Visualization System Revenue (billion) Forecast, by Application 2020 & 2033
- Table 8: Canada Minimally Invasive & Non-Invasive Medical Imaging And Visualization System Revenue (billion) Forecast, by Application 2020 & 2033
- Table 9: Mexico Minimally Invasive & Non-Invasive Medical Imaging And Visualization System Revenue (billion) Forecast, by Application 2020 & 2033
- Table 10: Global Minimally Invasive & Non-Invasive Medical Imaging And Visualization System Revenue billion Forecast, by Application 2020 & 2033
- Table 11: Global Minimally Invasive & Non-Invasive Medical Imaging And Visualization System Revenue billion Forecast, by Types 2020 & 2033
- Table 12: Global Minimally Invasive & Non-Invasive Medical Imaging And Visualization System Revenue billion Forecast, by Country 2020 & 2033
- Table 13: Brazil Minimally Invasive & Non-Invasive Medical Imaging And Visualization System Revenue (billion) Forecast, by Application 2020 & 2033
- Table 14: Argentina Minimally Invasive & Non-Invasive Medical Imaging And Visualization System Revenue (billion) Forecast, by Application 2020 & 2033
- Table 15: Rest of South America Minimally Invasive & Non-Invasive Medical Imaging And Visualization System Revenue (billion) Forecast, by Application 2020 & 2033
- Table 16: Global Minimally Invasive & Non-Invasive Medical Imaging And Visualization System Revenue billion Forecast, by Application 2020 & 2033
- Table 17: Global Minimally Invasive & Non-Invasive Medical Imaging And Visualization System Revenue billion Forecast, by Types 2020 & 2033
- Table 18: Global Minimally Invasive & Non-Invasive Medical Imaging And Visualization System Revenue billion Forecast, by Country 2020 & 2033
- Table 19: United Kingdom Minimally Invasive & Non-Invasive Medical Imaging And Visualization System Revenue (billion) Forecast, by Application 2020 & 2033
- Table 20: Germany Minimally Invasive & Non-Invasive Medical Imaging And Visualization System Revenue (billion) Forecast, by Application 2020 & 2033
- Table 21: France Minimally Invasive & Non-Invasive Medical Imaging And Visualization System Revenue (billion) Forecast, by Application 2020 & 2033
- Table 22: Italy Minimally Invasive & Non-Invasive Medical Imaging And Visualization System Revenue (billion) Forecast, by Application 2020 & 2033
- Table 23: Spain Minimally Invasive & Non-Invasive Medical Imaging And Visualization System Revenue (billion) Forecast, by Application 2020 & 2033
- Table 24: Russia Minimally Invasive & Non-Invasive Medical Imaging And Visualization System Revenue (billion) Forecast, by Application 2020 & 2033
- Table 25: Benelux Minimally Invasive & Non-Invasive Medical Imaging And Visualization System Revenue (billion) Forecast, by Application 2020 & 2033
- Table 26: Nordics Minimally Invasive & Non-Invasive Medical Imaging And Visualization System Revenue (billion) Forecast, by Application 2020 & 2033
- Table 27: Rest of Europe Minimally Invasive & Non-Invasive Medical Imaging And Visualization System Revenue (billion) Forecast, by Application 2020 & 2033
- Table 28: Global Minimally Invasive & Non-Invasive Medical Imaging And Visualization System Revenue billion Forecast, by Application 2020 & 2033
- Table 29: Global Minimally Invasive & Non-Invasive Medical Imaging And Visualization System Revenue billion Forecast, by Types 2020 & 2033
- Table 30: Global Minimally Invasive & Non-Invasive Medical Imaging And Visualization System Revenue billion Forecast, by Country 2020 & 2033
- Table 31: Turkey Minimally Invasive & Non-Invasive Medical Imaging And Visualization System Revenue (billion) Forecast, by Application 2020 & 2033
- Table 32: Israel Minimally Invasive & Non-Invasive Medical Imaging And Visualization System Revenue (billion) Forecast, by Application 2020 & 2033
- Table 33: GCC Minimally Invasive & Non-Invasive Medical Imaging And Visualization System Revenue (billion) Forecast, by Application 2020 & 2033
- Table 34: North Africa Minimally Invasive & Non-Invasive Medical Imaging And Visualization System Revenue (billion) Forecast, by Application 2020 & 2033
- Table 35: South Africa Minimally Invasive & Non-Invasive Medical Imaging And Visualization System Revenue (billion) Forecast, by Application 2020 & 2033
- Table 36: Rest of Middle East & Africa Minimally Invasive & Non-Invasive Medical Imaging And Visualization System Revenue (billion) Forecast, by Application 2020 & 2033
- Table 37: Global Minimally Invasive & Non-Invasive Medical Imaging And Visualization System Revenue billion Forecast, by Application 2020 & 2033
- Table 38: Global Minimally Invasive & Non-Invasive Medical Imaging And Visualization System Revenue billion Forecast, by Types 2020 & 2033
- Table 39: Global Minimally Invasive & Non-Invasive Medical Imaging And Visualization System Revenue billion Forecast, by Country 2020 & 2033
- Table 40: China Minimally Invasive & Non-Invasive Medical Imaging And Visualization System Revenue (billion) Forecast, by Application 2020 & 2033
- Table 41: India Minimally Invasive & Non-Invasive Medical Imaging And Visualization System Revenue (billion) Forecast, by Application 2020 & 2033
- Table 42: Japan Minimally Invasive & Non-Invasive Medical Imaging And Visualization System Revenue (billion) Forecast, by Application 2020 & 2033
- Table 43: South Korea Minimally Invasive & Non-Invasive Medical Imaging And Visualization System Revenue (billion) Forecast, by Application 2020 & 2033
- Table 44: ASEAN Minimally Invasive & Non-Invasive Medical Imaging And Visualization System Revenue (billion) Forecast, by Application 2020 & 2033
- Table 45: Oceania Minimally Invasive & Non-Invasive Medical Imaging And Visualization System Revenue (billion) Forecast, by Application 2020 & 2033
- Table 46: Rest of Asia Pacific Minimally Invasive & Non-Invasive Medical Imaging And Visualization System Revenue (billion) Forecast, by Application 2020 & 2033
Frequently Asked Questions
1. What is the projected Compound Annual Growth Rate (CAGR) of the Minimally Invasive & Non-Invasive Medical Imaging And Visualization System?
The projected CAGR is approximately 4.4%.
2. Which companies are prominent players in the Minimally Invasive & Non-Invasive Medical Imaging And Visualization System?
Key companies in the market include Smith & Nephew, Boston Scientific, Medtronic, Siemens, CONMED Corporation, GE, Stryker, Olympus, KARL STORZ, FUJIFILM Corporation., Philips, B. Braun, Johnson and Johnson.
3. What are the main segments of the Minimally Invasive & Non-Invasive Medical Imaging And Visualization System?
The market segments include Application, Types.
4. Can you provide details about the market size?
The market size is estimated to be USD 26.51 billion as of 2022.
5. What are some drivers contributing to market growth?
N/A
6. What are the notable trends driving market growth?
N/A
7. Are there any restraints impacting market growth?
N/A
8. Can you provide examples of recent developments in the market?
N/A
9. What pricing options are available for accessing the report?
Pricing options include single-user, multi-user, and enterprise licenses priced at USD 2900.00, USD 4350.00, and USD 5800.00 respectively.
10. Is the market size provided in terms of value or volume?
The market size is provided in terms of value, measured in billion.
11. Are there any specific market keywords associated with the report?
Yes, the market keyword associated with the report is "Minimally Invasive & Non-Invasive Medical Imaging And Visualization System," which aids in identifying and referencing the specific market segment covered.
12. How do I determine which pricing option suits my needs best?
The pricing options vary based on user requirements and access needs. Individual users may opt for single-user licenses, while businesses requiring broader access may choose multi-user or enterprise licenses for cost-effective access to the report.
13. Are there any additional resources or data provided in the Minimally Invasive & Non-Invasive Medical Imaging And Visualization System report?
While the report offers comprehensive insights, it's advisable to review the specific contents or supplementary materials provided to ascertain if additional resources or data are available.
14. How can I stay updated on further developments or reports in the Minimally Invasive & Non-Invasive Medical Imaging And Visualization System?
To stay informed about further developments, trends, and reports in the Minimally Invasive & Non-Invasive Medical Imaging And Visualization System, consider subscribing to industry newsletters, following relevant companies and organizations, or regularly checking reputable industry news sources and publications.
Methodology
Step 1 - Identification of Relevant Samples Size from Population Database


Step 2 - Approaches for Defining Global Market Size (Value, Volume* & Price*)

Note*: In applicable scenarios
Step 3 - Data Sources
Primary Research
- Web Analytics
- Survey Reports
- Research Institute
- Latest Research Reports
- Opinion Leaders
Secondary Research
- Annual Reports
- White Paper
- Latest Press Release
- Industry Association
- Paid Database
- Investor Presentations

Step 4 - Data Triangulation
Involves using different sources of information in order to increase the validity of a study
These sources are likely to be stakeholders in a program - participants, other researchers, program staff, other community members, and so on.
Then we put all data in single framework & apply various statistical tools to find out the dynamic on the market.
During the analysis stage, feedback from the stakeholder groups would be compared to determine areas of agreement as well as areas of divergence