

Key Insights
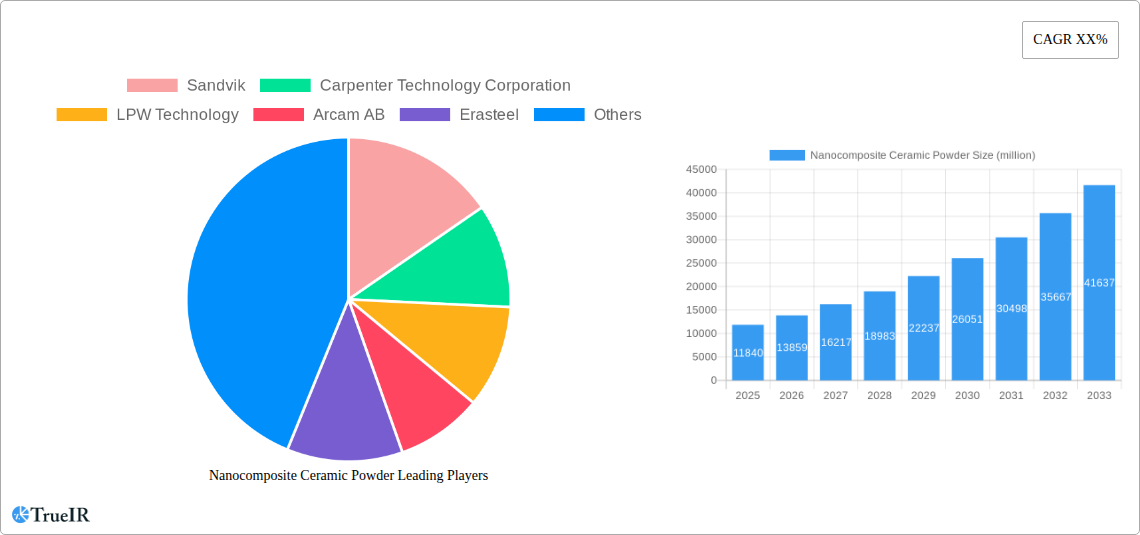
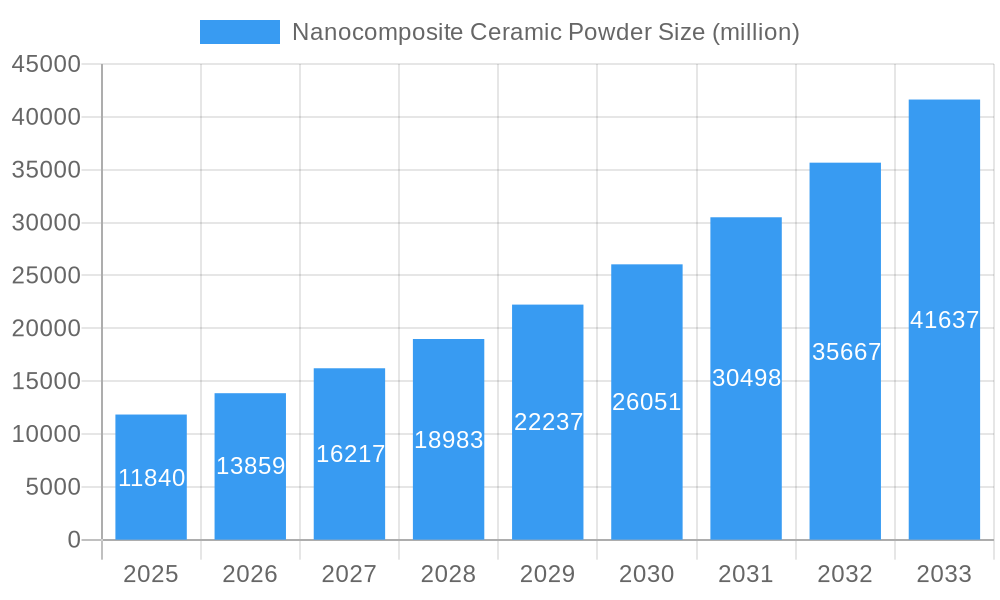
The Nanocomposite Ceramic Powder market is poised for substantial expansion, projected to reach an estimated USD 11.84 billion in 2025. This robust growth is fueled by a significant Compound Annual Growth Rate (CAGR) of 17.01%, indicating a dynamic and rapidly evolving industry. A primary driver for this surge is the increasing demand from the aerospace sector, where the superior strength-to-weight ratio and thermal resistance of nanocomposite ceramics are critical for advanced aircraft and spacecraft components. The automotive industry is another key contributor, leveraging these materials for enhanced engine performance, reduced emissions, and improved durability in components like brake systems and catalytic converters. Emerging applications in electronics and industrial manufacturing further bolster market demand, as the unique electrical and thermal properties of nanocomposite ceramics unlock new possibilities for miniaturization and efficiency.
Nanocomposite Ceramic Powder Market Size (In Billion)
The market's trajectory is further shaped by several key trends. Advances in powder processing techniques, leading to improved particle size control and uniformity, are enhancing the performance characteristics of nanocomposite ceramic powders. Furthermore, growing investments in research and development are continually expanding the range of applications and optimizing material properties for specific end-uses. While the market exhibits strong upward momentum, certain restraints need to be addressed. High manufacturing costs associated with the production of high-purity nanocomposite ceramic powders can pose a challenge to widespread adoption, particularly in cost-sensitive applications. Additionally, the complex processing requirements and the need for specialized equipment can be a barrier for some manufacturers. Despite these challenges, the inherent advantages of nanocomposite ceramic powders in terms of strength, thermal stability, and wear resistance ensure their continued dominance in high-performance applications and their expansion into new and innovative fields.
Nanocomposite Ceramic Powder Company Market Share
This comprehensive report delves into the dynamic Nanocomposite Ceramic Powder Market, offering deep insights and strategic guidance for industry stakeholders. Leveraging a robust study period from 2019 to 2033, with a base year and estimated year of 2025, and a detailed forecast period of 2025–2033, this analysis provides actionable intelligence based on historical data from 2019–2024.
Nanocomposite Ceramic Powder Market Structure & Competitive Landscape
The global Nanocomposite Ceramic Powder market exhibits a XX% market concentration, characterized by a blend of established multinational corporations and agile niche players. Innovation drivers are primarily fueled by an escalating demand for high-performance materials in demanding sectors like Aerospace and Automotive. Regulatory impacts, particularly concerning material safety and environmental sustainability, are increasingly shaping product development and market entry strategies, with an anticipated XX% increase in compliance-driven R&D spending over the forecast period. Product substitutes, while present in lower-performance applications, struggle to match the unique thermal, mechanical, and chemical resistance properties of nanocomposite ceramics, limiting their competitive threat to less than XX% of the overall market share in specialized applications. End-user segmentation reveals a strong reliance on the Aerospace segment (XX% market share), followed by the Automotive sector (XX% market share), and a growing "Others" category encompassing sectors like electronics and medical devices, projected to grow at a CAGR of XX%. Mergers and acquisitions (M&A) activity is expected to remain steady, with an estimated XX billion in M&A deals anticipated over the next five years as companies seek to consolidate market positions, acquire novel technologies, and expand their product portfolios.
Nanocomposite Ceramic Powder Market Trends & Opportunities
The Nanocomposite Ceramic Powder market is poised for significant expansion, driven by an intricate interplay of technological advancements, evolving consumer preferences, and intensifying competitive dynamics. The market size is projected to reach an impressive XX billion by 2033, growing at a robust Compound Annual Growth Rate (CAGR) of XX% from 2025. This surge is underpinned by ongoing technological shifts, particularly in nanoparticle synthesis and dispersion techniques, which are leading to the development of powders with enhanced properties such as superior strength-to-weight ratios, increased thermal conductivity, and improved wear resistance. These advancements are directly addressing the stringent performance requirements of key end-use industries.
Consumer preferences are increasingly leaning towards materials that offer enhanced durability, reduced environmental impact, and optimized performance. In the Aerospace industry, there's a continuous drive for lighter yet stronger components to improve fuel efficiency and payload capacity. Nanocomposite ceramics are instrumental in achieving these goals, finding applications in engine parts, structural components, and thermal protection systems. Similarly, the Automotive sector is witnessing a demand for lightweight materials that can withstand higher operating temperatures and improve overall vehicle efficiency, leading to increased adoption in engine components, brake systems, and advanced catalytic converters.
Competitive dynamics are characterized by a race for innovation and a focus on niche applications. Key players are investing heavily in research and development to create customized nanocomposite ceramic powders with tailored properties for specific end-uses. This includes developing High Temperature Ceramic Powders capable of operating in extreme environments, Medium Temperature Ceramic Powders for general industrial applications, and Low Temperature Ceramic Powders for more cost-sensitive markets. Strategic partnerships and collaborations between raw material suppliers, powder manufacturers, and end-users are becoming crucial for accelerating product development cycles and market penetration. The market penetration rate for nanocomposite ceramic powders is expected to reach XX% by 2033, indicating a substantial growth trajectory. Furthermore, emerging applications in areas such as energy storage, advanced electronics, and biomedical implants present significant untapped opportunities, promising sustained market growth and innovation.
Dominant Markets & Segments in Nanocomposite Ceramic Powder
The global Nanocomposite Ceramic Powder market demonstrates clear regional and segment-specific dominance, driven by distinct industrial demands and supportive infrastructure. North America currently holds the largest market share, estimated at XX%, primarily due to its advanced Aerospace industry and robust automotive manufacturing base. Within North America, the United States stands out as the leading country, contributing an estimated XX% to the regional market.
The Aerospace application segment reigns supreme, accounting for a substantial XX% of the total market revenue. This dominance is fueled by the stringent performance requirements of aircraft components, including high-temperature resistance, lightweighting for fuel efficiency, and superior durability. Key growth drivers in this segment include:
- Increased air travel demand: Post-pandemic recovery and growing global connectivity are boosting aircraft production and maintenance, thereby escalating the need for advanced materials.
- Next-generation aircraft development: Investments in new aircraft designs, including those focused on electric propulsion and hypersonic capabilities, necessitate materials that can withstand extreme conditions.
- Stringent safety and performance regulations: Aviation authorities mandate the use of materials that offer the highest levels of safety and reliability.
The Automotive application segment follows closely, capturing approximately XX% of the market share. The drive towards electric vehicles (EVs) and the increasing complexity of internal combustion engines are key catalysts. Growth drivers in this segment include:
- Lightweighting initiatives: To improve fuel efficiency in conventional vehicles and extend range in EVs, automakers are actively seeking lighter materials for engine components, chassis, and body parts.
- Demand for high-temperature resistant components: Advanced engine designs and more efficient braking systems require materials that can withstand higher operating temperatures.
- Emergence of electric vehicle components: Nanocomposite ceramics are finding applications in battery thermal management systems, power electronics, and lightweight structural parts for EVs.
In terms of product types, High Temperature Ceramic Powder commands the largest segment, representing an estimated XX% of the market. This is directly linked to its critical role in the dominant Aerospace and demanding Automotive applications.
- Key growth drivers for High Temperature Ceramic Powder:
- Advancements in aerospace propulsion systems.
- Development of high-performance automotive engines and exhaust systems.
- Growing use in industrial furnaces and refractory applications.
The Medium Temperature Ceramic Powder segment accounts for approximately XX% of the market, serving a broad range of industrial applications.
- Key growth drivers for Medium Temperature Ceramic Powder:
- Increasing demand for wear-resistant coatings in manufacturing.
- Applications in electronics for insulation and thermal management.
- Use in cutting tools and abrasive materials.
The Low Temperature Ceramic Powder segment, while smaller at XX%, is projected to experience significant growth due to its cost-effectiveness and applicability in less extreme environments.
- Key growth drivers for Low Temperature Ceramic Powder:
- Expansion of its use in consumer electronics.
- Growing adoption in construction and architectural applications requiring durable coatings.
- Potential for use in 3D printing of ceramic components.
The "Others" application segment, which includes electronics, medical devices, and energy storage, is expected to exhibit the highest growth rate, driven by innovation in these rapidly evolving fields.
Nanocomposite Ceramic Powder Product Analysis
Nanocomposite ceramic powders represent a significant advancement in material science, offering unparalleled performance characteristics by integrating nanoparticles into ceramic matrices. These innovative materials boast enhanced mechanical strength, superior thermal shock resistance, and exceptional chemical inertness, making them ideal for extreme environments. Key product innovations focus on tailoring the nanoparticle composition and size to achieve specific properties, such as increased hardness, reduced friction, and improved electrical insulation or conductivity. Competitive advantages lie in their ability to replace heavier, less durable traditional materials, leading to lighter components, extended product lifespans, and improved operational efficiency across various industries.
Key Drivers, Barriers & Challenges in Nanocomposite Ceramic Powder
Key Drivers, Barriers & Challenges in Nanocomposite Ceramic Powder
The Nanocomposite Ceramic Powder market is propelled by several critical growth drivers:
- Technological Advancements: Continuous innovation in nanoparticle synthesis and processing techniques leads to powders with superior properties. For example, advancements in atomic layer deposition (ALD) enable precise control over nanocomposite structures, enhancing performance.
- Increasing Demand for High-Performance Materials: Sectors like Aerospace and Automotive require materials that can withstand extreme temperatures, pressures, and corrosive environments, a demand that nanocomposite ceramics are uniquely positioned to meet.
- Lightweighting Initiatives: The global push for fuel efficiency and reduced emissions in transportation necessitates the use of lightweight yet strong materials, a key benefit offered by these powders.
- Growing R&D Investments: Significant investments in research and development by both academic institutions and private companies are unlocking new applications and improving material properties.
However, the market also faces significant barriers and challenges:
- High Production Costs: The complex synthesis and processing involved in producing high-quality nanocomposite ceramic powders contribute to their relatively high cost, which can be a barrier to adoption in cost-sensitive applications.
- Scalability of Production: Scaling up the manufacturing of these advanced materials to meet large-volume industrial demands while maintaining consistent quality remains a technical challenge.
- Regulatory Hurdles: While regulations often drive innovation, complex and evolving environmental and safety regulations can increase compliance costs and slow down market entry.
- Supply Chain Complexities: Sourcing specialized raw materials and ensuring a stable, high-quality supply chain for nanomaterials can be challenging.
- Competitive Pressure: The presence of established alternative materials and ongoing innovation in competing material science fields creates continuous competitive pressure.
Growth Drivers in the Nanocomposite Ceramic Powder Market
The Nanocomposite Ceramic Powder market's expansion is primarily fueled by relentless technological innovation, particularly in advanced synthesis methods that yield powders with superior mechanical, thermal, and chemical properties. The escalating demand from the Aerospace and Automotive sectors for lightweight, high-strength, and temperature-resistant materials is a significant catalyst. Furthermore, substantial investments in research and development by both public and private entities are continuously uncovering new applications and enhancing material performance. Economic growth in emerging economies also contributes by increasing the industrial base and the demand for advanced materials in various manufacturing sectors.
Challenges Impacting Nanocomposite Ceramic Powder Growth
Several factors present significant challenges to the growth of the Nanocomposite Ceramic Powder market. The inherent complexity and cost associated with the synthesis and processing of these advanced materials often lead to higher price points, limiting their widespread adoption in price-sensitive applications. Scaling up production to meet burgeoning industrial demand while ensuring consistent quality and purity remains a considerable technical hurdle. Additionally, navigating evolving regulatory landscapes concerning nanomaterial safety and environmental impact can introduce compliance complexities and increased operational costs. Intense competition from established alternative materials and the continuous development of new materials also exert pressure on market growth.
Key Players Shaping the Nanocomposite Ceramic Powder Market
- Sandvik
- Carpenter Technology Corporation
- LPW Technology
- Arcam AB
- Erasteel
- Arkema
- Exone
Significant Nanocomposite Ceramic Powder Industry Milestones
- 2019: Significant advancements in additive manufacturing of ceramic components utilizing nanocomposite powders.
- 2020: Introduction of novel nanocomposite ceramic powders with enhanced thermal conductivity for electronics cooling.
- 2021: Increased R&D focus on biocompatible nanocomposite ceramics for medical implants.
- 2022: Development of high-volume, cost-effective synthesis methods for key nanocomposite ceramic powders.
- 2023: Strategic partnerships formed to accelerate the commercialization of nanocomposite ceramics in the automotive sector.
- 2024: Emergence of new applications in energy storage solutions utilizing advanced nanocomposite materials.
Future Outlook for Nanocomposite Ceramic Powder Market
The future outlook for the Nanocomposite Ceramic Powder market is exceptionally promising, driven by continued technological advancements and escalating demand for high-performance materials. Strategic opportunities lie in expanding applications within the burgeoning electric vehicle sector, advanced aerospace propulsion systems, and cutting-edge electronics. The market's potential is further amplified by ongoing research into novel nanocomposite formulations and more efficient, scalable production methods. As industries increasingly prioritize durability, efficiency, and lightweighting, nanocomposite ceramic powders are poised to play an indispensable role, ensuring sustained growth and innovation in the coming years.
Nanocomposite Ceramic Powder Segmentation
-
1. Application
- 1.1. Aerospace
- 1.2. Automotive
- 1.3. Others
-
2. Types
- 2.1. High Temperature Ceramic Powder
- 2.2. Medium Temperature Ceramic Powder
- 2.3. Low Temperature Ceramic Powder
Nanocomposite Ceramic Powder Segmentation By Geography
-
1. North America
- 1.1. United States
- 1.2. Canada
- 1.3. Mexico
-
2. South America
- 2.1. Brazil
- 2.2. Argentina
- 2.3. Rest of South America
-
3. Europe
- 3.1. United Kingdom
- 3.2. Germany
- 3.3. France
- 3.4. Italy
- 3.5. Spain
- 3.6. Russia
- 3.7. Benelux
- 3.8. Nordics
- 3.9. Rest of Europe
-
4. Middle East & Africa
- 4.1. Turkey
- 4.2. Israel
- 4.3. GCC
- 4.4. North Africa
- 4.5. South Africa
- 4.6. Rest of Middle East & Africa
-
5. Asia Pacific
- 5.1. China
- 5.2. India
- 5.3. Japan
- 5.4. South Korea
- 5.5. ASEAN
- 5.6. Oceania
- 5.7. Rest of Asia Pacific
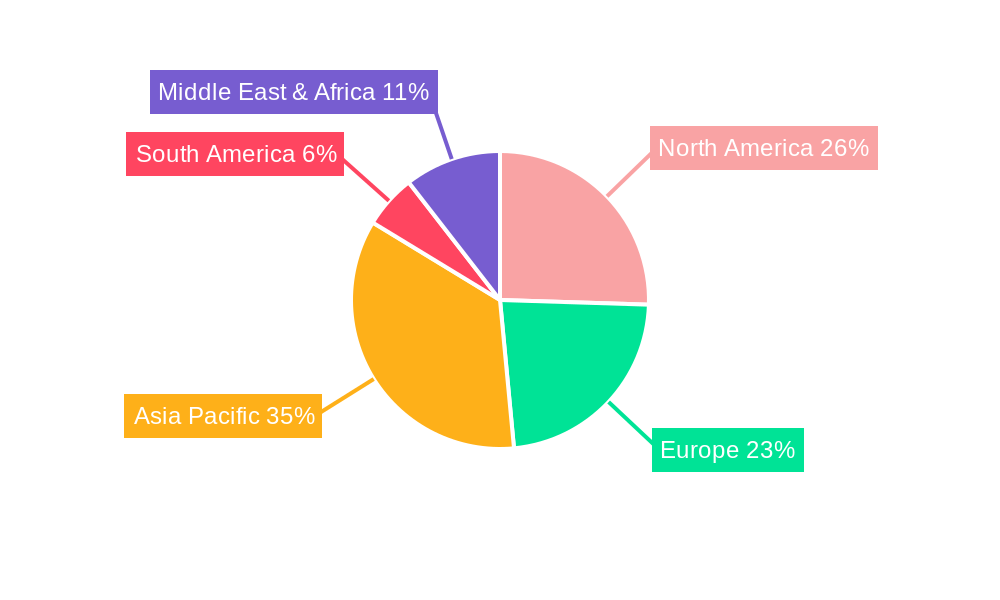
Nanocomposite Ceramic Powder Regional Market Share
Geographic Coverage of Nanocomposite Ceramic Powder
Nanocomposite Ceramic Powder REPORT HIGHLIGHTS
| Aspects | Details |
|---|---|
| Study Period | 2020-2034 |
| Base Year | 2025 |
| Estimated Year | 2026 |
| Forecast Period | 2026-2034 |
| Historical Period | 2020-2025 |
| Growth Rate | CAGR of 17.01% from 2020-2034 |
| Segmentation |
|
Table of Contents
- 1. Introduction
- 1.1. Research Scope
- 1.2. Market Segmentation
- 1.3. Research Methodology
- 1.4. Definitions and Assumptions
- 2. Executive Summary
- 2.1. Introduction
- 3. Market Dynamics
- 3.1. Introduction
- 3.2. Market Drivers
- 3.3. Market Restrains
- 3.4. Market Trends
- 4. Market Factor Analysis
- 4.1. Porters Five Forces
- 4.2. Supply/Value Chain
- 4.3. PESTEL analysis
- 4.4. Market Entropy
- 4.5. Patent/Trademark Analysis
- 5. Global Nanocomposite Ceramic Powder Analysis, Insights and Forecast, 2020-2032
- 5.1. Market Analysis, Insights and Forecast - by Application
- 5.1.1. Aerospace
- 5.1.2. Automotive
- 5.1.3. Others
- 5.2. Market Analysis, Insights and Forecast - by Types
- 5.2.1. High Temperature Ceramic Powder
- 5.2.2. Medium Temperature Ceramic Powder
- 5.2.3. Low Temperature Ceramic Powder
- 5.3. Market Analysis, Insights and Forecast - by Region
- 5.3.1. North America
- 5.3.2. South America
- 5.3.3. Europe
- 5.3.4. Middle East & Africa
- 5.3.5. Asia Pacific
- 5.1. Market Analysis, Insights and Forecast - by Application
- 6. North America Nanocomposite Ceramic Powder Analysis, Insights and Forecast, 2020-2032
- 6.1. Market Analysis, Insights and Forecast - by Application
- 6.1.1. Aerospace
- 6.1.2. Automotive
- 6.1.3. Others
- 6.2. Market Analysis, Insights and Forecast - by Types
- 6.2.1. High Temperature Ceramic Powder
- 6.2.2. Medium Temperature Ceramic Powder
- 6.2.3. Low Temperature Ceramic Powder
- 6.1. Market Analysis, Insights and Forecast - by Application
- 7. South America Nanocomposite Ceramic Powder Analysis, Insights and Forecast, 2020-2032
- 7.1. Market Analysis, Insights and Forecast - by Application
- 7.1.1. Aerospace
- 7.1.2. Automotive
- 7.1.3. Others
- 7.2. Market Analysis, Insights and Forecast - by Types
- 7.2.1. High Temperature Ceramic Powder
- 7.2.2. Medium Temperature Ceramic Powder
- 7.2.3. Low Temperature Ceramic Powder
- 7.1. Market Analysis, Insights and Forecast - by Application
- 8. Europe Nanocomposite Ceramic Powder Analysis, Insights and Forecast, 2020-2032
- 8.1. Market Analysis, Insights and Forecast - by Application
- 8.1.1. Aerospace
- 8.1.2. Automotive
- 8.1.3. Others
- 8.2. Market Analysis, Insights and Forecast - by Types
- 8.2.1. High Temperature Ceramic Powder
- 8.2.2. Medium Temperature Ceramic Powder
- 8.2.3. Low Temperature Ceramic Powder
- 8.1. Market Analysis, Insights and Forecast - by Application
- 9. Middle East & Africa Nanocomposite Ceramic Powder Analysis, Insights and Forecast, 2020-2032
- 9.1. Market Analysis, Insights and Forecast - by Application
- 9.1.1. Aerospace
- 9.1.2. Automotive
- 9.1.3. Others
- 9.2. Market Analysis, Insights and Forecast - by Types
- 9.2.1. High Temperature Ceramic Powder
- 9.2.2. Medium Temperature Ceramic Powder
- 9.2.3. Low Temperature Ceramic Powder
- 9.1. Market Analysis, Insights and Forecast - by Application
- 10. Asia Pacific Nanocomposite Ceramic Powder Analysis, Insights and Forecast, 2020-2032
- 10.1. Market Analysis, Insights and Forecast - by Application
- 10.1.1. Aerospace
- 10.1.2. Automotive
- 10.1.3. Others
- 10.2. Market Analysis, Insights and Forecast - by Types
- 10.2.1. High Temperature Ceramic Powder
- 10.2.2. Medium Temperature Ceramic Powder
- 10.2.3. Low Temperature Ceramic Powder
- 10.1. Market Analysis, Insights and Forecast - by Application
- 11. Competitive Analysis
- 11.1. Global Market Share Analysis 2025
- 11.2. Company Profiles
- 11.2.1 Sandvik
- 11.2.1.1. Overview
- 11.2.1.2. Products
- 11.2.1.3. SWOT Analysis
- 11.2.1.4. Recent Developments
- 11.2.1.5. Financials (Based on Availability)
- 11.2.2 Carpenter Technology Corporation
- 11.2.2.1. Overview
- 11.2.2.2. Products
- 11.2.2.3. SWOT Analysis
- 11.2.2.4. Recent Developments
- 11.2.2.5. Financials (Based on Availability)
- 11.2.3 LPW Technology
- 11.2.3.1. Overview
- 11.2.3.2. Products
- 11.2.3.3. SWOT Analysis
- 11.2.3.4. Recent Developments
- 11.2.3.5. Financials (Based on Availability)
- 11.2.4 Arcam AB
- 11.2.4.1. Overview
- 11.2.4.2. Products
- 11.2.4.3. SWOT Analysis
- 11.2.4.4. Recent Developments
- 11.2.4.5. Financials (Based on Availability)
- 11.2.5 Erasteel
- 11.2.5.1. Overview
- 11.2.5.2. Products
- 11.2.5.3. SWOT Analysis
- 11.2.5.4. Recent Developments
- 11.2.5.5. Financials (Based on Availability)
- 11.2.6 Arkema
- 11.2.6.1. Overview
- 11.2.6.2. Products
- 11.2.6.3. SWOT Analysis
- 11.2.6.4. Recent Developments
- 11.2.6.5. Financials (Based on Availability)
- 11.2.7 Exone
- 11.2.7.1. Overview
- 11.2.7.2. Products
- 11.2.7.3. SWOT Analysis
- 11.2.7.4. Recent Developments
- 11.2.7.5. Financials (Based on Availability)
- 11.2.1 Sandvik
List of Figures
- Figure 1: Global Nanocomposite Ceramic Powder Revenue Breakdown (undefined, %) by Region 2025 & 2033
- Figure 2: North America Nanocomposite Ceramic Powder Revenue (undefined), by Application 2025 & 2033
- Figure 3: North America Nanocomposite Ceramic Powder Revenue Share (%), by Application 2025 & 2033
- Figure 4: North America Nanocomposite Ceramic Powder Revenue (undefined), by Types 2025 & 2033
- Figure 5: North America Nanocomposite Ceramic Powder Revenue Share (%), by Types 2025 & 2033
- Figure 6: North America Nanocomposite Ceramic Powder Revenue (undefined), by Country 2025 & 2033
- Figure 7: North America Nanocomposite Ceramic Powder Revenue Share (%), by Country 2025 & 2033
- Figure 8: South America Nanocomposite Ceramic Powder Revenue (undefined), by Application 2025 & 2033
- Figure 9: South America Nanocomposite Ceramic Powder Revenue Share (%), by Application 2025 & 2033
- Figure 10: South America Nanocomposite Ceramic Powder Revenue (undefined), by Types 2025 & 2033
- Figure 11: South America Nanocomposite Ceramic Powder Revenue Share (%), by Types 2025 & 2033
- Figure 12: South America Nanocomposite Ceramic Powder Revenue (undefined), by Country 2025 & 2033
- Figure 13: South America Nanocomposite Ceramic Powder Revenue Share (%), by Country 2025 & 2033
- Figure 14: Europe Nanocomposite Ceramic Powder Revenue (undefined), by Application 2025 & 2033
- Figure 15: Europe Nanocomposite Ceramic Powder Revenue Share (%), by Application 2025 & 2033
- Figure 16: Europe Nanocomposite Ceramic Powder Revenue (undefined), by Types 2025 & 2033
- Figure 17: Europe Nanocomposite Ceramic Powder Revenue Share (%), by Types 2025 & 2033
- Figure 18: Europe Nanocomposite Ceramic Powder Revenue (undefined), by Country 2025 & 2033
- Figure 19: Europe Nanocomposite Ceramic Powder Revenue Share (%), by Country 2025 & 2033
- Figure 20: Middle East & Africa Nanocomposite Ceramic Powder Revenue (undefined), by Application 2025 & 2033
- Figure 21: Middle East & Africa Nanocomposite Ceramic Powder Revenue Share (%), by Application 2025 & 2033
- Figure 22: Middle East & Africa Nanocomposite Ceramic Powder Revenue (undefined), by Types 2025 & 2033
- Figure 23: Middle East & Africa Nanocomposite Ceramic Powder Revenue Share (%), by Types 2025 & 2033
- Figure 24: Middle East & Africa Nanocomposite Ceramic Powder Revenue (undefined), by Country 2025 & 2033
- Figure 25: Middle East & Africa Nanocomposite Ceramic Powder Revenue Share (%), by Country 2025 & 2033
- Figure 26: Asia Pacific Nanocomposite Ceramic Powder Revenue (undefined), by Application 2025 & 2033
- Figure 27: Asia Pacific Nanocomposite Ceramic Powder Revenue Share (%), by Application 2025 & 2033
- Figure 28: Asia Pacific Nanocomposite Ceramic Powder Revenue (undefined), by Types 2025 & 2033
- Figure 29: Asia Pacific Nanocomposite Ceramic Powder Revenue Share (%), by Types 2025 & 2033
- Figure 30: Asia Pacific Nanocomposite Ceramic Powder Revenue (undefined), by Country 2025 & 2033
- Figure 31: Asia Pacific Nanocomposite Ceramic Powder Revenue Share (%), by Country 2025 & 2033
List of Tables
- Table 1: Global Nanocomposite Ceramic Powder Revenue undefined Forecast, by Application 2020 & 2033
- Table 2: Global Nanocomposite Ceramic Powder Revenue undefined Forecast, by Types 2020 & 2033
- Table 3: Global Nanocomposite Ceramic Powder Revenue undefined Forecast, by Region 2020 & 2033
- Table 4: Global Nanocomposite Ceramic Powder Revenue undefined Forecast, by Application 2020 & 2033
- Table 5: Global Nanocomposite Ceramic Powder Revenue undefined Forecast, by Types 2020 & 2033
- Table 6: Global Nanocomposite Ceramic Powder Revenue undefined Forecast, by Country 2020 & 2033
- Table 7: United States Nanocomposite Ceramic Powder Revenue (undefined) Forecast, by Application 2020 & 2033
- Table 8: Canada Nanocomposite Ceramic Powder Revenue (undefined) Forecast, by Application 2020 & 2033
- Table 9: Mexico Nanocomposite Ceramic Powder Revenue (undefined) Forecast, by Application 2020 & 2033
- Table 10: Global Nanocomposite Ceramic Powder Revenue undefined Forecast, by Application 2020 & 2033
- Table 11: Global Nanocomposite Ceramic Powder Revenue undefined Forecast, by Types 2020 & 2033
- Table 12: Global Nanocomposite Ceramic Powder Revenue undefined Forecast, by Country 2020 & 2033
- Table 13: Brazil Nanocomposite Ceramic Powder Revenue (undefined) Forecast, by Application 2020 & 2033
- Table 14: Argentina Nanocomposite Ceramic Powder Revenue (undefined) Forecast, by Application 2020 & 2033
- Table 15: Rest of South America Nanocomposite Ceramic Powder Revenue (undefined) Forecast, by Application 2020 & 2033
- Table 16: Global Nanocomposite Ceramic Powder Revenue undefined Forecast, by Application 2020 & 2033
- Table 17: Global Nanocomposite Ceramic Powder Revenue undefined Forecast, by Types 2020 & 2033
- Table 18: Global Nanocomposite Ceramic Powder Revenue undefined Forecast, by Country 2020 & 2033
- Table 19: United Kingdom Nanocomposite Ceramic Powder Revenue (undefined) Forecast, by Application 2020 & 2033
- Table 20: Germany Nanocomposite Ceramic Powder Revenue (undefined) Forecast, by Application 2020 & 2033
- Table 21: France Nanocomposite Ceramic Powder Revenue (undefined) Forecast, by Application 2020 & 2033
- Table 22: Italy Nanocomposite Ceramic Powder Revenue (undefined) Forecast, by Application 2020 & 2033
- Table 23: Spain Nanocomposite Ceramic Powder Revenue (undefined) Forecast, by Application 2020 & 2033
- Table 24: Russia Nanocomposite Ceramic Powder Revenue (undefined) Forecast, by Application 2020 & 2033
- Table 25: Benelux Nanocomposite Ceramic Powder Revenue (undefined) Forecast, by Application 2020 & 2033
- Table 26: Nordics Nanocomposite Ceramic Powder Revenue (undefined) Forecast, by Application 2020 & 2033
- Table 27: Rest of Europe Nanocomposite Ceramic Powder Revenue (undefined) Forecast, by Application 2020 & 2033
- Table 28: Global Nanocomposite Ceramic Powder Revenue undefined Forecast, by Application 2020 & 2033
- Table 29: Global Nanocomposite Ceramic Powder Revenue undefined Forecast, by Types 2020 & 2033
- Table 30: Global Nanocomposite Ceramic Powder Revenue undefined Forecast, by Country 2020 & 2033
- Table 31: Turkey Nanocomposite Ceramic Powder Revenue (undefined) Forecast, by Application 2020 & 2033
- Table 32: Israel Nanocomposite Ceramic Powder Revenue (undefined) Forecast, by Application 2020 & 2033
- Table 33: GCC Nanocomposite Ceramic Powder Revenue (undefined) Forecast, by Application 2020 & 2033
- Table 34: North Africa Nanocomposite Ceramic Powder Revenue (undefined) Forecast, by Application 2020 & 2033
- Table 35: South Africa Nanocomposite Ceramic Powder Revenue (undefined) Forecast, by Application 2020 & 2033
- Table 36: Rest of Middle East & Africa Nanocomposite Ceramic Powder Revenue (undefined) Forecast, by Application 2020 & 2033
- Table 37: Global Nanocomposite Ceramic Powder Revenue undefined Forecast, by Application 2020 & 2033
- Table 38: Global Nanocomposite Ceramic Powder Revenue undefined Forecast, by Types 2020 & 2033
- Table 39: Global Nanocomposite Ceramic Powder Revenue undefined Forecast, by Country 2020 & 2033
- Table 40: China Nanocomposite Ceramic Powder Revenue (undefined) Forecast, by Application 2020 & 2033
- Table 41: India Nanocomposite Ceramic Powder Revenue (undefined) Forecast, by Application 2020 & 2033
- Table 42: Japan Nanocomposite Ceramic Powder Revenue (undefined) Forecast, by Application 2020 & 2033
- Table 43: South Korea Nanocomposite Ceramic Powder Revenue (undefined) Forecast, by Application 2020 & 2033
- Table 44: ASEAN Nanocomposite Ceramic Powder Revenue (undefined) Forecast, by Application 2020 & 2033
- Table 45: Oceania Nanocomposite Ceramic Powder Revenue (undefined) Forecast, by Application 2020 & 2033
- Table 46: Rest of Asia Pacific Nanocomposite Ceramic Powder Revenue (undefined) Forecast, by Application 2020 & 2033
Frequently Asked Questions
1. What is the projected Compound Annual Growth Rate (CAGR) of the Nanocomposite Ceramic Powder?
The projected CAGR is approximately 17.01%.
2. Which companies are prominent players in the Nanocomposite Ceramic Powder?
Key companies in the market include Sandvik, Carpenter Technology Corporation, LPW Technology, Arcam AB, Erasteel, Arkema, Exone.
3. What are the main segments of the Nanocomposite Ceramic Powder?
The market segments include Application, Types.
4. Can you provide details about the market size?
The market size is estimated to be USD XXX N/A as of 2022.
5. What are some drivers contributing to market growth?
N/A
6. What are the notable trends driving market growth?
N/A
7. Are there any restraints impacting market growth?
N/A
8. Can you provide examples of recent developments in the market?
N/A
9. What pricing options are available for accessing the report?
Pricing options include single-user, multi-user, and enterprise licenses priced at USD 4900.00, USD 7350.00, and USD 9800.00 respectively.
10. Is the market size provided in terms of value or volume?
The market size is provided in terms of value, measured in N/A.
11. Are there any specific market keywords associated with the report?
Yes, the market keyword associated with the report is "Nanocomposite Ceramic Powder," which aids in identifying and referencing the specific market segment covered.
12. How do I determine which pricing option suits my needs best?
The pricing options vary based on user requirements and access needs. Individual users may opt for single-user licenses, while businesses requiring broader access may choose multi-user or enterprise licenses for cost-effective access to the report.
13. Are there any additional resources or data provided in the Nanocomposite Ceramic Powder report?
While the report offers comprehensive insights, it's advisable to review the specific contents or supplementary materials provided to ascertain if additional resources or data are available.
14. How can I stay updated on further developments or reports in the Nanocomposite Ceramic Powder?
To stay informed about further developments, trends, and reports in the Nanocomposite Ceramic Powder, consider subscribing to industry newsletters, following relevant companies and organizations, or regularly checking reputable industry news sources and publications.
Methodology
Step 1 - Identification of Relevant Samples Size from Population Database


Step 2 - Approaches for Defining Global Market Size (Value, Volume* & Price*)

Note*: In applicable scenarios
Step 3 - Data Sources
Primary Research
- Web Analytics
- Survey Reports
- Research Institute
- Latest Research Reports
- Opinion Leaders
Secondary Research
- Annual Reports
- White Paper
- Latest Press Release
- Industry Association
- Paid Database
- Investor Presentations

Step 4 - Data Triangulation
Involves using different sources of information in order to increase the validity of a study
These sources are likely to be stakeholders in a program - participants, other researchers, program staff, other community members, and so on.
Then we put all data in single framework & apply various statistical tools to find out the dynamic on the market.
During the analysis stage, feedback from the stakeholder groups would be compared to determine areas of agreement as well as areas of divergence