

Key Insights
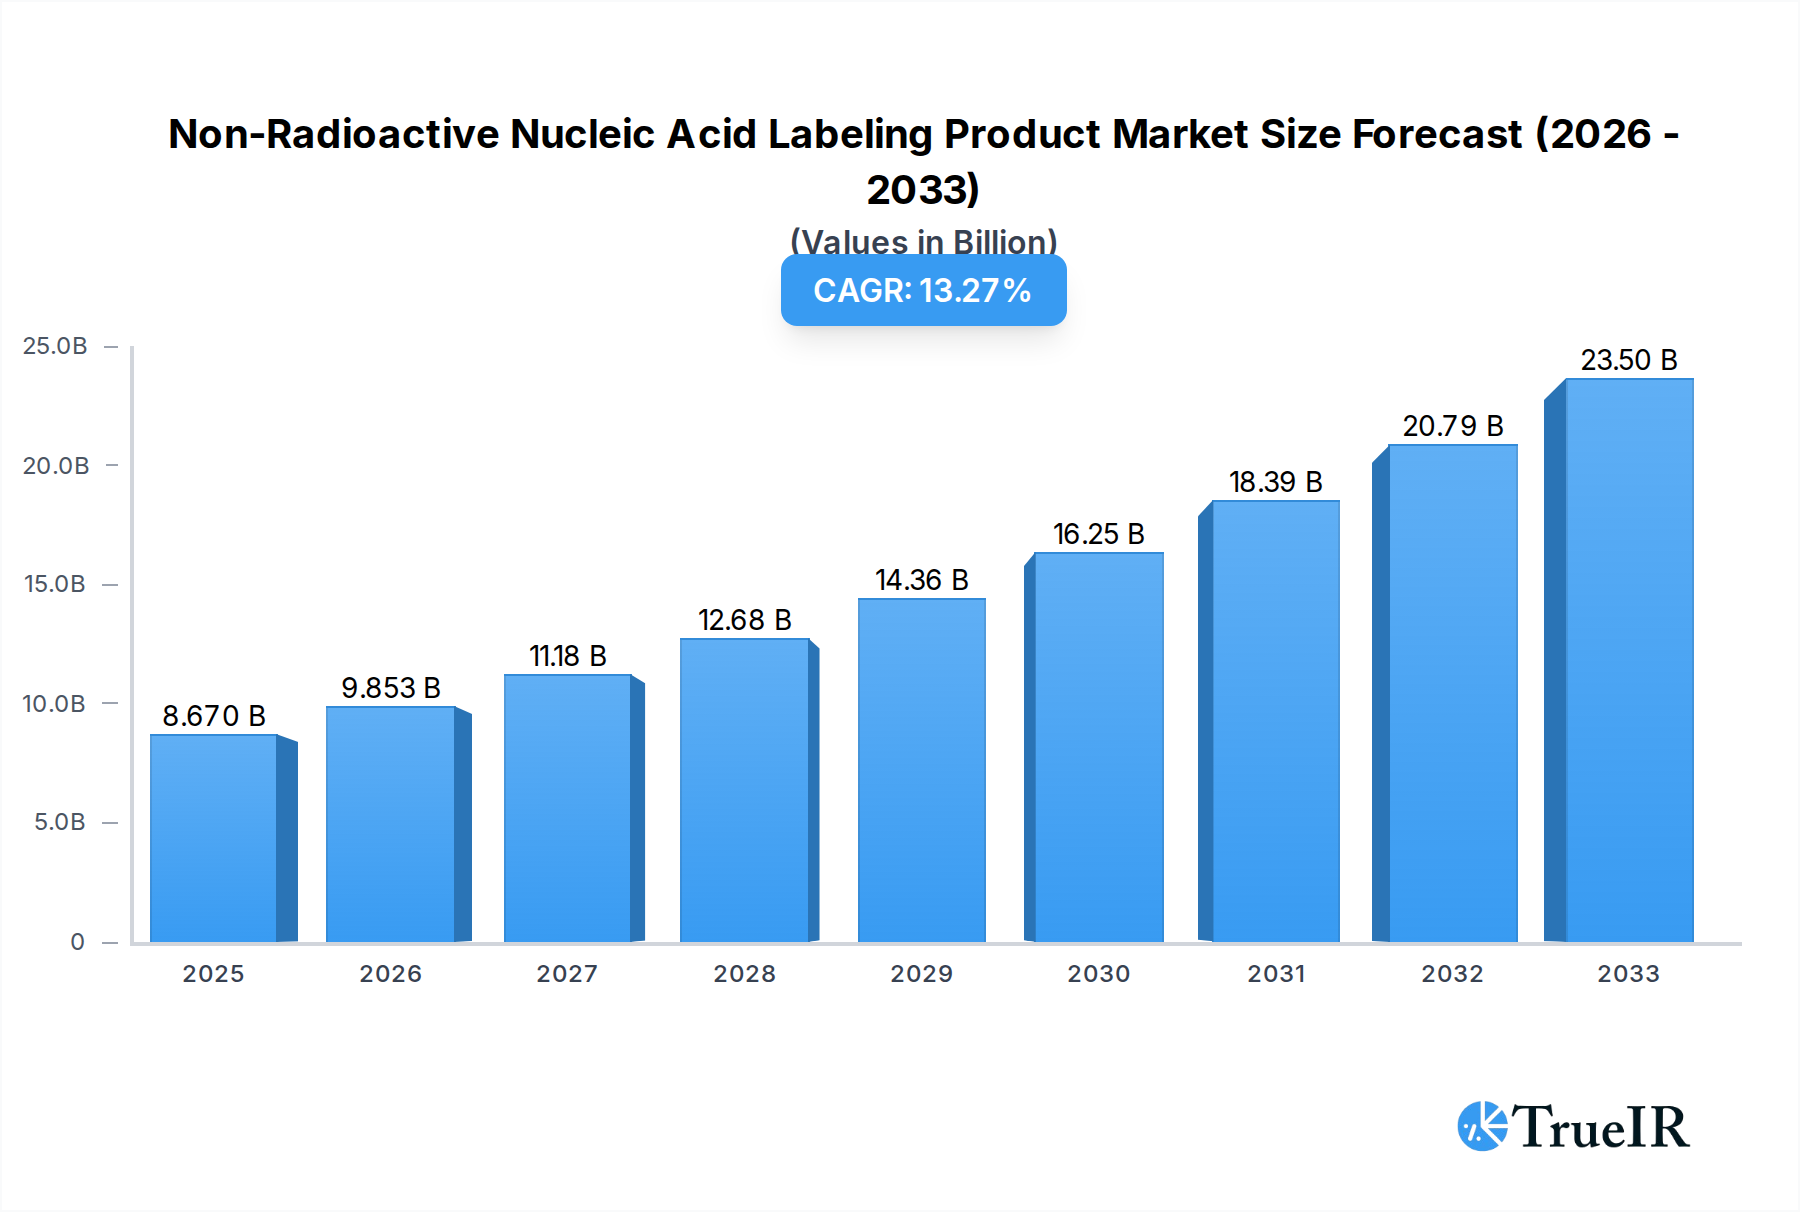
The Non-Radioactive Nucleic Acid Labeling Product market is poised for significant expansion, projected to reach USD 8.67 billion in 2025 and exhibiting a robust compound annual growth rate (CAGR) of 13.94% through 2033. This impressive growth is primarily fueled by the increasing demand for advanced diagnostic and research tools across various life science disciplines. Key drivers include the expanding landscape of genomic and proteomic research, the rising incidence of chronic diseases necessitating early and accurate detection, and the growing adoption of personalized medicine approaches. Furthermore, the inherent advantages of non-radioactive labeling techniques, such as enhanced safety, prolonged shelf-life of labeled probes, and improved detection sensitivity compared to traditional radioactive methods, are propelling their widespread utilization in molecular biology laboratories, pharmaceutical R&D, and clinical diagnostics. The market is witnessing a strong emphasis on innovative labeling chemistries and multiplexing capabilities, enabling simultaneous detection of multiple targets with higher specificity and reduced background noise.

Non-Radioactive Nucleic Acid Labeling Product Market Size (In Billion)
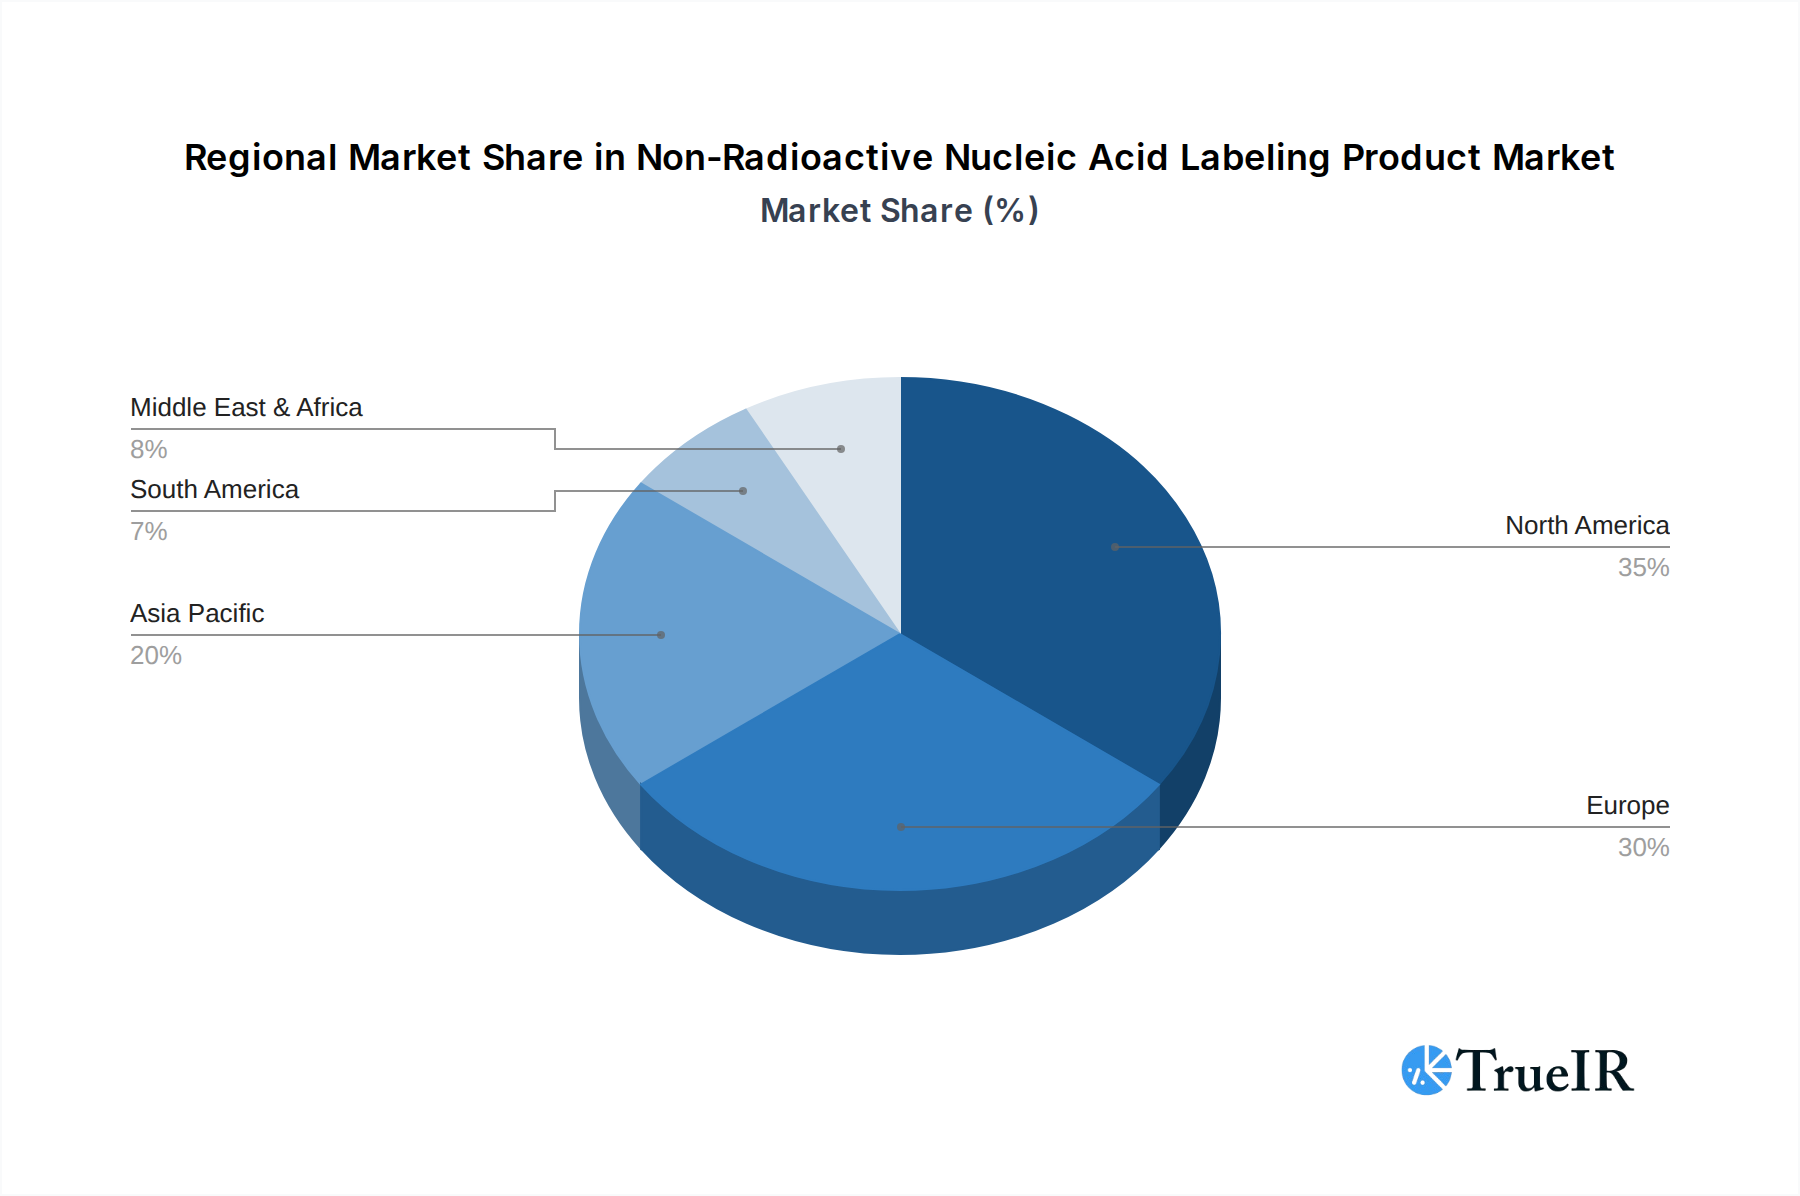
The market's trajectory is further bolstered by continuous technological advancements in labeling chemistries, including the development of highly stable and sensitive fluorescent dyes and the optimization of enzymatic labeling systems. The increasing investment in biotechnology research and development globally, coupled with government initiatives supporting life science innovation, are also significant contributors to market growth. Geographically, North America and Europe are expected to remain dominant regions, driven by established research infrastructures and high healthcare spending. However, the Asia Pacific region is anticipated to exhibit the fastest growth, owing to expanding research activities, increasing adoption of advanced technologies, and a growing biopharmaceutical industry. While the market is generally favorable, potential restraints such as the high cost of some advanced labeling kits and the need for specialized equipment might pose challenges, although the long-term benefits and efficiency gains are expected to outweigh these concerns. The diverse application segments, including DNA labeling, RNA labeling, and oligonucleotide labeling, along with various types of labels such as Biotin, DIG System, and Fluorescent, highlight the broad utility and adaptive nature of non-radioactive nucleic acid labeling products.
Non-Radioactive Nucleic Acid Labeling Product Company Market Share
Non-Radioactive Nucleic Acid Labeling Product Market Structure & Competitive Landscape
The non-radioactive nucleic acid labeling product market is characterized by a highly fragmented structure, with a significant presence of both established multinational corporations and smaller, specialized biotechnology firms. Market concentration is moderate, with the top ten players estimated to command approximately 60% of the global market share. Innovation is a key driver, fueled by extensive research and development in areas like improved sensitivity, multiplexing capabilities, and simpler assay formats. Regulatory impacts, while generally favoring advancements in diagnostics and therapeutics, can also present hurdles for new product approvals, particularly in sensitive applications. Product substitutes, though limited due to the specificity of nucleic acid labeling, include alternative detection methods and certain non-labeling based molecular analysis techniques. End-user segmentation reveals strong demand from research institutions, pharmaceutical and biotechnology companies, and clinical diagnostic laboratories. Merger and acquisition (M&A) activity has been moderate, with an estimated xx billion worth of transactions recorded during the historical period (2019-2024), indicating strategic consolidation and expansion of product portfolios.
Non-Radioactive Nucleic Acid Labeling Product Market Trends & Opportunities
The global non-radioactive nucleic acid labeling product market is poised for substantial growth, projected to expand at a Compound Annual Growth Rate (CAGR) of approximately 8.5% from 2025 to 2033, reaching an estimated market size of over xx billion by the end of the forecast period. This robust expansion is underpinned by a confluence of technological advancements, evolving consumer preferences, and intensifying competitive dynamics. A key trend is the increasing demand for highly sensitive and specific labeling techniques to support advancements in personalized medicine, infectious disease diagnostics, and cancer research. The shift away from radioactive isotopes towards safer and more user-friendly non-radioactive methods continues to gain momentum, driven by regulatory preferences and improved performance of newer labeling chemistries.
Technological innovation is at the forefront of market evolution. Developments in fluorescent labeling, including the advent of novel fluorophores with enhanced brightness and photostability, are revolutionizing multiplexing applications and enabling more complex biological analyses. Similarly, advancements in enzyme-based labeling systems, such as those utilizing biotin-streptavidin or DIG-antibody interactions, are offering improved signal amplification and assay versatility. The proliferation of high-throughput screening and next-generation sequencing (NGS) technologies further amplifies the need for efficient and scalable nucleic acid labeling solutions.
Consumer preferences are increasingly leaning towards integrated solutions that offer convenience, reduced turnaround times, and cost-effectiveness. This is driving market players to develop comprehensive kits and platforms that streamline the entire labeling workflow, from sample preparation to data analysis. The growing adoption of these products in point-of-care diagnostics and remote monitoring applications also signifies a significant market shift.
Competitive dynamics are intensifying, with established players like Thermo Fisher Scientific, Roche, and Promega investing heavily in R&D to launch innovative products and expand their market reach. Strategic partnerships and collaborations are also becoming more prevalent as companies seek to leverage each other's expertise and technologies. The market penetration rate for non-radioactive labeling is expected to reach over 90% within the forecast period, indicating its widespread adoption across various scientific disciplines. The increasing focus on genomic research, drug discovery, and molecular diagnostics, fueled by a growing understanding of genetic predispositions and disease mechanisms, will continue to drive demand for these indispensable tools. Furthermore, the expanding applications in agriculture, food safety, and environmental monitoring are opening up new avenues for market expansion.
Dominant Markets & Segments in Non-Radioactive Nucleic Acid Labeling Product
North America currently holds a dominant position in the global non-radioactive nucleic acid labeling product market, driven by a robust research infrastructure, significant investments in life sciences R&D, and a high prevalence of chronic diseases necessitating advanced diagnostic tools. The United States, in particular, accounts for a substantial share of this regional dominance. Key growth drivers in this region include extensive government funding for academic research, a well-established biotechnology industry, and the early adoption of innovative molecular diagnostic technologies.
Within the application segment, DNA Labeling is the largest and fastest-growing category. This dominance is attributable to its critical role in a wide array of applications, including:
- Genetic research and diagnostics: Essential for gene sequencing, PCR, gene expression analysis, and mutation detection.
- Forensic science: Widely used in DNA fingerprinting and identification.
- Biotechnology and drug discovery: Crucial for cloning, gene therapy research, and target identification.
The RNA Labeling segment is also experiencing significant growth, propelled by the increasing interest in non-coding RNAs, microRNAs, and messenger RNA (mRNA) therapeutics. The development of mRNA vaccines and therapies has dramatically boosted the demand for sophisticated RNA labeling techniques for research, quality control, and therapeutic development.
The Oligonucleotide Labeling segment, while smaller, is vital for custom synthesis and the development of probes and primers for various molecular assays, including in situ hybridization (ISH) and microarrays.
In terms of product types, the Fluorescent labeling segment is projected to witness the highest growth rate. This is due to:
- Enhanced sensitivity and multiplexing: Novel fluorescent dyes offer superior signal-to-noise ratios and allow for the simultaneous detection of multiple targets.
- Versatility: Fluorescent labels are compatible with a wide range of detection platforms, including fluorescence microscopy, flow cytometry, and high-throughput plate readers.
- Innovation: Continuous development of new fluorophores with improved spectral properties and photostability.
The Biotin and DIG System (Digoxigenin) remain significant market segments due to their well-established protocols, cost-effectiveness, and broad compatibility with various detection methods. They are particularly favored in routine diagnostics and research applications where high multiplexing is not a primary requirement. The "Others" category, encompassing chemiluminescent and other novel labeling technologies, is expected to grow as these methods mature and offer unique advantages in specific applications.
Non-Radioactive Nucleic Acid Labeling Product Product Analysis
Innovations in non-radioactive nucleic acid labeling products are increasingly focused on enhancing sensitivity, specificity, and multiplexing capabilities. Product developments are driven by the need for faster, more accurate diagnostic and research tools. Key competitive advantages lie in ease of use, reduced background noise, and superior signal amplification. Advancements in fluorescent dyes, enzyme conjugates, and conjugation chemistries are enabling researchers to detect nucleic acids with unprecedented precision. Applications span from basic research in genomics and epigenetics to clinical diagnostics for infectious diseases and cancer, as well as drug discovery and development.
Key Drivers, Barriers & Challenges in Non-Radioactive Nucleic Acid Labeling Product
The non-radioactive nucleic acid labeling product market is propelled by several key drivers, including the burgeoning field of personalized medicine, requiring precise genetic analysis; the continuous advancements in molecular diagnostics for early disease detection; and the increasing demand for safer, non-radioactive alternatives in research and clinical settings. Furthermore, substantial investments in genomic research and the growing prevalence of infectious diseases globally are creating significant market opportunities. Technological innovations, such as novel fluorescent probes and improved enzymatic labeling systems, are also crucial growth catalysts, offering enhanced sensitivity and multiplexing capabilities for complex biological studies.
However, the market faces several challenges and restraints. High research and development costs associated with novel labeling technologies can deter smaller companies. Regulatory hurdles for new product approvals, especially for in-vitro diagnostics, can lead to extended market entry times. Intense competition among key players, leading to price pressures, also impacts profitability. Furthermore, the complexity of some labeling protocols and the requirement for specialized equipment can limit adoption in certain resource-constrained settings. Supply chain disruptions, as observed in recent global events, can impact the availability of raw materials and finished products, affecting market stability.
Growth Drivers in the Non-Radioactive Nucleic Acid Labeling Product Market
Key growth drivers in the non-radioactive nucleic acid labeling product market stem from the unrelenting advancements in molecular biology and diagnostics. The expanding applications in personalized medicine, where genetic profiling is paramount for tailored treatments, significantly fuels demand. The escalating global burden of infectious diseases, particularly in the wake of recent pandemics, has underscored the critical need for rapid and accurate diagnostic tools, thereby boosting the market for nucleic acid labeling. Furthermore, substantial governmental and private investments in genomics and proteomics research are creating a fertile ground for innovation and market expansion. The ongoing transition from radioactive to non-radioactive labeling methods, driven by safety and regulatory considerations, represents a sustained growth catalyst.
Challenges Impacting Non-Radioactive Nucleic Acid Labeling Product Growth
Challenges impacting non-radioactive nucleic acid labeling product growth are multifaceted, encompassing regulatory complexities and lengthy approval processes, particularly for diagnostic applications. Supply chain vulnerabilities, including the availability of specialized reagents and manufacturing capacity, can lead to disruptions and increased costs. Intense competitive pressures among established players and emerging innovators can result in price erosion and necessitate continuous investment in product differentiation. The technical expertise required for certain advanced labeling techniques can also act as a barrier to widespread adoption in less specialized laboratories. Ensuring consistent quality and performance across diverse applications remains a crucial aspect requiring robust quality control measures.
Key Players Shaping the Non-Radioactive Nucleic Acid Labeling Product Market
- Thermo Fisher Scientific
- Roche
- Promega
- PerkinElmer
- Agilent Technologies
- General Electric
- Enzo Biochem
- Merck KGaA
- Vector Labs
- New England Biolabs
Significant Non-Radioactive Nucleic Acid Labeling Product Industry Milestones
- 2019: Launch of ultra-bright fluorescent dyes offering enhanced multiplexing capabilities.
- 2020: Increased demand for rapid nucleic acid detection kits for COVID-19 testing.
- 2021: Development of novel enzyme-based labeling systems with improved sensitivity and reduced assay times.
- 2022: Strategic acquisitions aimed at expanding product portfolios in molecular diagnostics.
- 2023: Introduction of simplified and integrated labeling workflows for high-throughput screening.
- Early 2024: Advancements in probe design for single-cell analysis.
Future Outlook for Non-Radioactive Nucleic Acid Labeling Product Market
The future outlook for the non-radioactive nucleic acid labeling product market is exceptionally bright, driven by the ever-increasing reliance on molecular techniques across research, diagnostics, and therapeutics. Strategic opportunities lie in the further development of highly multiplexed assays, enabling simultaneous detection of numerous targets for comprehensive disease profiling. The integration of AI and machine learning in assay design and data analysis will further enhance the utility of these labeling products. Market potential is also significant in emerging economies, where the adoption of advanced diagnostics and research tools is rapidly accelerating. Continued innovation in areas like CRISPR-based diagnostics and liquid biopsy will propel sustained growth.
Non-Radioactive Nucleic Acid Labeling Product Segmentation
-
1. Application
- 1.1. DNA Labeling
- 1.2. RNA Labeling
- 1.3. Oligonucleotide Labeling
-
2. Types
- 2.1. Biotin
- 2.2. DIG System
- 2.3. Fluorescent
- 2.4. Others
Non-Radioactive Nucleic Acid Labeling Product Segmentation By Geography
-
1. North America
- 1.1. United States
- 1.2. Canada
- 1.3. Mexico
-
2. South America
- 2.1. Brazil
- 2.2. Argentina
- 2.3. Rest of South America
-
3. Europe
- 3.1. United Kingdom
- 3.2. Germany
- 3.3. France
- 3.4. Italy
- 3.5. Spain
- 3.6. Russia
- 3.7. Benelux
- 3.8. Nordics
- 3.9. Rest of Europe
-
4. Middle East & Africa
- 4.1. Turkey
- 4.2. Israel
- 4.3. GCC
- 4.4. North Africa
- 4.5. South Africa
- 4.6. Rest of Middle East & Africa
-
5. Asia Pacific
- 5.1. China
- 5.2. India
- 5.3. Japan
- 5.4. South Korea
- 5.5. ASEAN
- 5.6. Oceania
- 5.7. Rest of Asia Pacific
Non-Radioactive Nucleic Acid Labeling Product Regional Market Share
Geographic Coverage of Non-Radioactive Nucleic Acid Labeling Product
Non-Radioactive Nucleic Acid Labeling Product REPORT HIGHLIGHTS
| Aspects | Details |
|---|---|
| Study Period | 2020-2034 |
| Base Year | 2025 |
| Estimated Year | 2026 |
| Forecast Period | 2026-2034 |
| Historical Period | 2020-2025 |
| Growth Rate | CAGR of 13.94% from 2020-2034 |
| Segmentation |
|
Table of Contents
- 1. Introduction
- 1.1. Research Scope
- 1.2. Market Segmentation
- 1.3. Research Methodology
- 1.4. Definitions and Assumptions
- 2. Executive Summary
- 2.1. Introduction
- 3. Market Dynamics
- 3.1. Introduction
- 3.2. Market Drivers
- 3.3. Market Restrains
- 3.4. Market Trends
- 4. Market Factor Analysis
- 4.1. Porters Five Forces
- 4.2. Supply/Value Chain
- 4.3. PESTEL analysis
- 4.4. Market Entropy
- 4.5. Patent/Trademark Analysis
- 5. Global Non-Radioactive Nucleic Acid Labeling Product Analysis, Insights and Forecast, 2020-2032
- 5.1. Market Analysis, Insights and Forecast - by Application
- 5.1.1. DNA Labeling
- 5.1.2. RNA Labeling
- 5.1.3. Oligonucleotide Labeling
- 5.2. Market Analysis, Insights and Forecast - by Types
- 5.2.1. Biotin
- 5.2.2. DIG System
- 5.2.3. Fluorescent
- 5.2.4. Others
- 5.3. Market Analysis, Insights and Forecast - by Region
- 5.3.1. North America
- 5.3.2. South America
- 5.3.3. Europe
- 5.3.4. Middle East & Africa
- 5.3.5. Asia Pacific
- 5.1. Market Analysis, Insights and Forecast - by Application
- 6. North America Non-Radioactive Nucleic Acid Labeling Product Analysis, Insights and Forecast, 2020-2032
- 6.1. Market Analysis, Insights and Forecast - by Application
- 6.1.1. DNA Labeling
- 6.1.2. RNA Labeling
- 6.1.3. Oligonucleotide Labeling
- 6.2. Market Analysis, Insights and Forecast - by Types
- 6.2.1. Biotin
- 6.2.2. DIG System
- 6.2.3. Fluorescent
- 6.2.4. Others
- 6.1. Market Analysis, Insights and Forecast - by Application
- 7. South America Non-Radioactive Nucleic Acid Labeling Product Analysis, Insights and Forecast, 2020-2032
- 7.1. Market Analysis, Insights and Forecast - by Application
- 7.1.1. DNA Labeling
- 7.1.2. RNA Labeling
- 7.1.3. Oligonucleotide Labeling
- 7.2. Market Analysis, Insights and Forecast - by Types
- 7.2.1. Biotin
- 7.2.2. DIG System
- 7.2.3. Fluorescent
- 7.2.4. Others
- 7.1. Market Analysis, Insights and Forecast - by Application
- 8. Europe Non-Radioactive Nucleic Acid Labeling Product Analysis, Insights and Forecast, 2020-2032
- 8.1. Market Analysis, Insights and Forecast - by Application
- 8.1.1. DNA Labeling
- 8.1.2. RNA Labeling
- 8.1.3. Oligonucleotide Labeling
- 8.2. Market Analysis, Insights and Forecast - by Types
- 8.2.1. Biotin
- 8.2.2. DIG System
- 8.2.3. Fluorescent
- 8.2.4. Others
- 8.1. Market Analysis, Insights and Forecast - by Application
- 9. Middle East & Africa Non-Radioactive Nucleic Acid Labeling Product Analysis, Insights and Forecast, 2020-2032
- 9.1. Market Analysis, Insights and Forecast - by Application
- 9.1.1. DNA Labeling
- 9.1.2. RNA Labeling
- 9.1.3. Oligonucleotide Labeling
- 9.2. Market Analysis, Insights and Forecast - by Types
- 9.2.1. Biotin
- 9.2.2. DIG System
- 9.2.3. Fluorescent
- 9.2.4. Others
- 9.1. Market Analysis, Insights and Forecast - by Application
- 10. Asia Pacific Non-Radioactive Nucleic Acid Labeling Product Analysis, Insights and Forecast, 2020-2032
- 10.1. Market Analysis, Insights and Forecast - by Application
- 10.1.1. DNA Labeling
- 10.1.2. RNA Labeling
- 10.1.3. Oligonucleotide Labeling
- 10.2. Market Analysis, Insights and Forecast - by Types
- 10.2.1. Biotin
- 10.2.2. DIG System
- 10.2.3. Fluorescent
- 10.2.4. Others
- 10.1. Market Analysis, Insights and Forecast - by Application
- 11. Competitive Analysis
- 11.1. Global Market Share Analysis 2025
- 11.2. Company Profiles
- 11.2.1 Thermo Fisher Scientific
- 11.2.1.1. Overview
- 11.2.1.2. Products
- 11.2.1.3. SWOT Analysis
- 11.2.1.4. Recent Developments
- 11.2.1.5. Financials (Based on Availability)
- 11.2.2 Roche
- 11.2.2.1. Overview
- 11.2.2.2. Products
- 11.2.2.3. SWOT Analysis
- 11.2.2.4. Recent Developments
- 11.2.2.5. Financials (Based on Availability)
- 11.2.3 Promega
- 11.2.3.1. Overview
- 11.2.3.2. Products
- 11.2.3.3. SWOT Analysis
- 11.2.3.4. Recent Developments
- 11.2.3.5. Financials (Based on Availability)
- 11.2.4 PerkinElmer
- 11.2.4.1. Overview
- 11.2.4.2. Products
- 11.2.4.3. SWOT Analysis
- 11.2.4.4. Recent Developments
- 11.2.4.5. Financials (Based on Availability)
- 11.2.5 Agilent Technologies
- 11.2.5.1. Overview
- 11.2.5.2. Products
- 11.2.5.3. SWOT Analysis
- 11.2.5.4. Recent Developments
- 11.2.5.5. Financials (Based on Availability)
- 11.2.6 General Electric
- 11.2.6.1. Overview
- 11.2.6.2. Products
- 11.2.6.3. SWOT Analysis
- 11.2.6.4. Recent Developments
- 11.2.6.5. Financials (Based on Availability)
- 11.2.7 Enzo Biochem
- 11.2.7.1. Overview
- 11.2.7.2. Products
- 11.2.7.3. SWOT Analysis
- 11.2.7.4. Recent Developments
- 11.2.7.5. Financials (Based on Availability)
- 11.2.8 Merck KGaA
- 11.2.8.1. Overview
- 11.2.8.2. Products
- 11.2.8.3. SWOT Analysis
- 11.2.8.4. Recent Developments
- 11.2.8.5. Financials (Based on Availability)
- 11.2.9 Vector Labs
- 11.2.9.1. Overview
- 11.2.9.2. Products
- 11.2.9.3. SWOT Analysis
- 11.2.9.4. Recent Developments
- 11.2.9.5. Financials (Based on Availability)
- 11.2.10 New England Biolabs
- 11.2.10.1. Overview
- 11.2.10.2. Products
- 11.2.10.3. SWOT Analysis
- 11.2.10.4. Recent Developments
- 11.2.10.5. Financials (Based on Availability)
- 11.2.1 Thermo Fisher Scientific
List of Figures
- Figure 1: Global Non-Radioactive Nucleic Acid Labeling Product Revenue Breakdown (undefined, %) by Region 2025 & 2033
- Figure 2: Global Non-Radioactive Nucleic Acid Labeling Product Volume Breakdown (K, %) by Region 2025 & 2033
- Figure 3: North America Non-Radioactive Nucleic Acid Labeling Product Revenue (undefined), by Application 2025 & 2033
- Figure 4: North America Non-Radioactive Nucleic Acid Labeling Product Volume (K), by Application 2025 & 2033
- Figure 5: North America Non-Radioactive Nucleic Acid Labeling Product Revenue Share (%), by Application 2025 & 2033
- Figure 6: North America Non-Radioactive Nucleic Acid Labeling Product Volume Share (%), by Application 2025 & 2033
- Figure 7: North America Non-Radioactive Nucleic Acid Labeling Product Revenue (undefined), by Types 2025 & 2033
- Figure 8: North America Non-Radioactive Nucleic Acid Labeling Product Volume (K), by Types 2025 & 2033
- Figure 9: North America Non-Radioactive Nucleic Acid Labeling Product Revenue Share (%), by Types 2025 & 2033
- Figure 10: North America Non-Radioactive Nucleic Acid Labeling Product Volume Share (%), by Types 2025 & 2033
- Figure 11: North America Non-Radioactive Nucleic Acid Labeling Product Revenue (undefined), by Country 2025 & 2033
- Figure 12: North America Non-Radioactive Nucleic Acid Labeling Product Volume (K), by Country 2025 & 2033
- Figure 13: North America Non-Radioactive Nucleic Acid Labeling Product Revenue Share (%), by Country 2025 & 2033
- Figure 14: North America Non-Radioactive Nucleic Acid Labeling Product Volume Share (%), by Country 2025 & 2033
- Figure 15: South America Non-Radioactive Nucleic Acid Labeling Product Revenue (undefined), by Application 2025 & 2033
- Figure 16: South America Non-Radioactive Nucleic Acid Labeling Product Volume (K), by Application 2025 & 2033
- Figure 17: South America Non-Radioactive Nucleic Acid Labeling Product Revenue Share (%), by Application 2025 & 2033
- Figure 18: South America Non-Radioactive Nucleic Acid Labeling Product Volume Share (%), by Application 2025 & 2033
- Figure 19: South America Non-Radioactive Nucleic Acid Labeling Product Revenue (undefined), by Types 2025 & 2033
- Figure 20: South America Non-Radioactive Nucleic Acid Labeling Product Volume (K), by Types 2025 & 2033
- Figure 21: South America Non-Radioactive Nucleic Acid Labeling Product Revenue Share (%), by Types 2025 & 2033
- Figure 22: South America Non-Radioactive Nucleic Acid Labeling Product Volume Share (%), by Types 2025 & 2033
- Figure 23: South America Non-Radioactive Nucleic Acid Labeling Product Revenue (undefined), by Country 2025 & 2033
- Figure 24: South America Non-Radioactive Nucleic Acid Labeling Product Volume (K), by Country 2025 & 2033
- Figure 25: South America Non-Radioactive Nucleic Acid Labeling Product Revenue Share (%), by Country 2025 & 2033
- Figure 26: South America Non-Radioactive Nucleic Acid Labeling Product Volume Share (%), by Country 2025 & 2033
- Figure 27: Europe Non-Radioactive Nucleic Acid Labeling Product Revenue (undefined), by Application 2025 & 2033
- Figure 28: Europe Non-Radioactive Nucleic Acid Labeling Product Volume (K), by Application 2025 & 2033
- Figure 29: Europe Non-Radioactive Nucleic Acid Labeling Product Revenue Share (%), by Application 2025 & 2033
- Figure 30: Europe Non-Radioactive Nucleic Acid Labeling Product Volume Share (%), by Application 2025 & 2033
- Figure 31: Europe Non-Radioactive Nucleic Acid Labeling Product Revenue (undefined), by Types 2025 & 2033
- Figure 32: Europe Non-Radioactive Nucleic Acid Labeling Product Volume (K), by Types 2025 & 2033
- Figure 33: Europe Non-Radioactive Nucleic Acid Labeling Product Revenue Share (%), by Types 2025 & 2033
- Figure 34: Europe Non-Radioactive Nucleic Acid Labeling Product Volume Share (%), by Types 2025 & 2033
- Figure 35: Europe Non-Radioactive Nucleic Acid Labeling Product Revenue (undefined), by Country 2025 & 2033
- Figure 36: Europe Non-Radioactive Nucleic Acid Labeling Product Volume (K), by Country 2025 & 2033
- Figure 37: Europe Non-Radioactive Nucleic Acid Labeling Product Revenue Share (%), by Country 2025 & 2033
- Figure 38: Europe Non-Radioactive Nucleic Acid Labeling Product Volume Share (%), by Country 2025 & 2033
- Figure 39: Middle East & Africa Non-Radioactive Nucleic Acid Labeling Product Revenue (undefined), by Application 2025 & 2033
- Figure 40: Middle East & Africa Non-Radioactive Nucleic Acid Labeling Product Volume (K), by Application 2025 & 2033
- Figure 41: Middle East & Africa Non-Radioactive Nucleic Acid Labeling Product Revenue Share (%), by Application 2025 & 2033
- Figure 42: Middle East & Africa Non-Radioactive Nucleic Acid Labeling Product Volume Share (%), by Application 2025 & 2033
- Figure 43: Middle East & Africa Non-Radioactive Nucleic Acid Labeling Product Revenue (undefined), by Types 2025 & 2033
- Figure 44: Middle East & Africa Non-Radioactive Nucleic Acid Labeling Product Volume (K), by Types 2025 & 2033
- Figure 45: Middle East & Africa Non-Radioactive Nucleic Acid Labeling Product Revenue Share (%), by Types 2025 & 2033
- Figure 46: Middle East & Africa Non-Radioactive Nucleic Acid Labeling Product Volume Share (%), by Types 2025 & 2033
- Figure 47: Middle East & Africa Non-Radioactive Nucleic Acid Labeling Product Revenue (undefined), by Country 2025 & 2033
- Figure 48: Middle East & Africa Non-Radioactive Nucleic Acid Labeling Product Volume (K), by Country 2025 & 2033
- Figure 49: Middle East & Africa Non-Radioactive Nucleic Acid Labeling Product Revenue Share (%), by Country 2025 & 2033
- Figure 50: Middle East & Africa Non-Radioactive Nucleic Acid Labeling Product Volume Share (%), by Country 2025 & 2033
- Figure 51: Asia Pacific Non-Radioactive Nucleic Acid Labeling Product Revenue (undefined), by Application 2025 & 2033
- Figure 52: Asia Pacific Non-Radioactive Nucleic Acid Labeling Product Volume (K), by Application 2025 & 2033
- Figure 53: Asia Pacific Non-Radioactive Nucleic Acid Labeling Product Revenue Share (%), by Application 2025 & 2033
- Figure 54: Asia Pacific Non-Radioactive Nucleic Acid Labeling Product Volume Share (%), by Application 2025 & 2033
- Figure 55: Asia Pacific Non-Radioactive Nucleic Acid Labeling Product Revenue (undefined), by Types 2025 & 2033
- Figure 56: Asia Pacific Non-Radioactive Nucleic Acid Labeling Product Volume (K), by Types 2025 & 2033
- Figure 57: Asia Pacific Non-Radioactive Nucleic Acid Labeling Product Revenue Share (%), by Types 2025 & 2033
- Figure 58: Asia Pacific Non-Radioactive Nucleic Acid Labeling Product Volume Share (%), by Types 2025 & 2033
- Figure 59: Asia Pacific Non-Radioactive Nucleic Acid Labeling Product Revenue (undefined), by Country 2025 & 2033
- Figure 60: Asia Pacific Non-Radioactive Nucleic Acid Labeling Product Volume (K), by Country 2025 & 2033
- Figure 61: Asia Pacific Non-Radioactive Nucleic Acid Labeling Product Revenue Share (%), by Country 2025 & 2033
- Figure 62: Asia Pacific Non-Radioactive Nucleic Acid Labeling Product Volume Share (%), by Country 2025 & 2033
List of Tables
- Table 1: Global Non-Radioactive Nucleic Acid Labeling Product Revenue undefined Forecast, by Application 2020 & 2033
- Table 2: Global Non-Radioactive Nucleic Acid Labeling Product Volume K Forecast, by Application 2020 & 2033
- Table 3: Global Non-Radioactive Nucleic Acid Labeling Product Revenue undefined Forecast, by Types 2020 & 2033
- Table 4: Global Non-Radioactive Nucleic Acid Labeling Product Volume K Forecast, by Types 2020 & 2033
- Table 5: Global Non-Radioactive Nucleic Acid Labeling Product Revenue undefined Forecast, by Region 2020 & 2033
- Table 6: Global Non-Radioactive Nucleic Acid Labeling Product Volume K Forecast, by Region 2020 & 2033
- Table 7: Global Non-Radioactive Nucleic Acid Labeling Product Revenue undefined Forecast, by Application 2020 & 2033
- Table 8: Global Non-Radioactive Nucleic Acid Labeling Product Volume K Forecast, by Application 2020 & 2033
- Table 9: Global Non-Radioactive Nucleic Acid Labeling Product Revenue undefined Forecast, by Types 2020 & 2033
- Table 10: Global Non-Radioactive Nucleic Acid Labeling Product Volume K Forecast, by Types 2020 & 2033
- Table 11: Global Non-Radioactive Nucleic Acid Labeling Product Revenue undefined Forecast, by Country 2020 & 2033
- Table 12: Global Non-Radioactive Nucleic Acid Labeling Product Volume K Forecast, by Country 2020 & 2033
- Table 13: United States Non-Radioactive Nucleic Acid Labeling Product Revenue (undefined) Forecast, by Application 2020 & 2033
- Table 14: United States Non-Radioactive Nucleic Acid Labeling Product Volume (K) Forecast, by Application 2020 & 2033
- Table 15: Canada Non-Radioactive Nucleic Acid Labeling Product Revenue (undefined) Forecast, by Application 2020 & 2033
- Table 16: Canada Non-Radioactive Nucleic Acid Labeling Product Volume (K) Forecast, by Application 2020 & 2033
- Table 17: Mexico Non-Radioactive Nucleic Acid Labeling Product Revenue (undefined) Forecast, by Application 2020 & 2033
- Table 18: Mexico Non-Radioactive Nucleic Acid Labeling Product Volume (K) Forecast, by Application 2020 & 2033
- Table 19: Global Non-Radioactive Nucleic Acid Labeling Product Revenue undefined Forecast, by Application 2020 & 2033
- Table 20: Global Non-Radioactive Nucleic Acid Labeling Product Volume K Forecast, by Application 2020 & 2033
- Table 21: Global Non-Radioactive Nucleic Acid Labeling Product Revenue undefined Forecast, by Types 2020 & 2033
- Table 22: Global Non-Radioactive Nucleic Acid Labeling Product Volume K Forecast, by Types 2020 & 2033
- Table 23: Global Non-Radioactive Nucleic Acid Labeling Product Revenue undefined Forecast, by Country 2020 & 2033
- Table 24: Global Non-Radioactive Nucleic Acid Labeling Product Volume K Forecast, by Country 2020 & 2033
- Table 25: Brazil Non-Radioactive Nucleic Acid Labeling Product Revenue (undefined) Forecast, by Application 2020 & 2033
- Table 26: Brazil Non-Radioactive Nucleic Acid Labeling Product Volume (K) Forecast, by Application 2020 & 2033
- Table 27: Argentina Non-Radioactive Nucleic Acid Labeling Product Revenue (undefined) Forecast, by Application 2020 & 2033
- Table 28: Argentina Non-Radioactive Nucleic Acid Labeling Product Volume (K) Forecast, by Application 2020 & 2033
- Table 29: Rest of South America Non-Radioactive Nucleic Acid Labeling Product Revenue (undefined) Forecast, by Application 2020 & 2033
- Table 30: Rest of South America Non-Radioactive Nucleic Acid Labeling Product Volume (K) Forecast, by Application 2020 & 2033
- Table 31: Global Non-Radioactive Nucleic Acid Labeling Product Revenue undefined Forecast, by Application 2020 & 2033
- Table 32: Global Non-Radioactive Nucleic Acid Labeling Product Volume K Forecast, by Application 2020 & 2033
- Table 33: Global Non-Radioactive Nucleic Acid Labeling Product Revenue undefined Forecast, by Types 2020 & 2033
- Table 34: Global Non-Radioactive Nucleic Acid Labeling Product Volume K Forecast, by Types 2020 & 2033
- Table 35: Global Non-Radioactive Nucleic Acid Labeling Product Revenue undefined Forecast, by Country 2020 & 2033
- Table 36: Global Non-Radioactive Nucleic Acid Labeling Product Volume K Forecast, by Country 2020 & 2033
- Table 37: United Kingdom Non-Radioactive Nucleic Acid Labeling Product Revenue (undefined) Forecast, by Application 2020 & 2033
- Table 38: United Kingdom Non-Radioactive Nucleic Acid Labeling Product Volume (K) Forecast, by Application 2020 & 2033
- Table 39: Germany Non-Radioactive Nucleic Acid Labeling Product Revenue (undefined) Forecast, by Application 2020 & 2033
- Table 40: Germany Non-Radioactive Nucleic Acid Labeling Product Volume (K) Forecast, by Application 2020 & 2033
- Table 41: France Non-Radioactive Nucleic Acid Labeling Product Revenue (undefined) Forecast, by Application 2020 & 2033
- Table 42: France Non-Radioactive Nucleic Acid Labeling Product Volume (K) Forecast, by Application 2020 & 2033
- Table 43: Italy Non-Radioactive Nucleic Acid Labeling Product Revenue (undefined) Forecast, by Application 2020 & 2033
- Table 44: Italy Non-Radioactive Nucleic Acid Labeling Product Volume (K) Forecast, by Application 2020 & 2033
- Table 45: Spain Non-Radioactive Nucleic Acid Labeling Product Revenue (undefined) Forecast, by Application 2020 & 2033
- Table 46: Spain Non-Radioactive Nucleic Acid Labeling Product Volume (K) Forecast, by Application 2020 & 2033
- Table 47: Russia Non-Radioactive Nucleic Acid Labeling Product Revenue (undefined) Forecast, by Application 2020 & 2033
- Table 48: Russia Non-Radioactive Nucleic Acid Labeling Product Volume (K) Forecast, by Application 2020 & 2033
- Table 49: Benelux Non-Radioactive Nucleic Acid Labeling Product Revenue (undefined) Forecast, by Application 2020 & 2033
- Table 50: Benelux Non-Radioactive Nucleic Acid Labeling Product Volume (K) Forecast, by Application 2020 & 2033
- Table 51: Nordics Non-Radioactive Nucleic Acid Labeling Product Revenue (undefined) Forecast, by Application 2020 & 2033
- Table 52: Nordics Non-Radioactive Nucleic Acid Labeling Product Volume (K) Forecast, by Application 2020 & 2033
- Table 53: Rest of Europe Non-Radioactive Nucleic Acid Labeling Product Revenue (undefined) Forecast, by Application 2020 & 2033
- Table 54: Rest of Europe Non-Radioactive Nucleic Acid Labeling Product Volume (K) Forecast, by Application 2020 & 2033
- Table 55: Global Non-Radioactive Nucleic Acid Labeling Product Revenue undefined Forecast, by Application 2020 & 2033
- Table 56: Global Non-Radioactive Nucleic Acid Labeling Product Volume K Forecast, by Application 2020 & 2033
- Table 57: Global Non-Radioactive Nucleic Acid Labeling Product Revenue undefined Forecast, by Types 2020 & 2033
- Table 58: Global Non-Radioactive Nucleic Acid Labeling Product Volume K Forecast, by Types 2020 & 2033
- Table 59: Global Non-Radioactive Nucleic Acid Labeling Product Revenue undefined Forecast, by Country 2020 & 2033
- Table 60: Global Non-Radioactive Nucleic Acid Labeling Product Volume K Forecast, by Country 2020 & 2033
- Table 61: Turkey Non-Radioactive Nucleic Acid Labeling Product Revenue (undefined) Forecast, by Application 2020 & 2033
- Table 62: Turkey Non-Radioactive Nucleic Acid Labeling Product Volume (K) Forecast, by Application 2020 & 2033
- Table 63: Israel Non-Radioactive Nucleic Acid Labeling Product Revenue (undefined) Forecast, by Application 2020 & 2033
- Table 64: Israel Non-Radioactive Nucleic Acid Labeling Product Volume (K) Forecast, by Application 2020 & 2033
- Table 65: GCC Non-Radioactive Nucleic Acid Labeling Product Revenue (undefined) Forecast, by Application 2020 & 2033
- Table 66: GCC Non-Radioactive Nucleic Acid Labeling Product Volume (K) Forecast, by Application 2020 & 2033
- Table 67: North Africa Non-Radioactive Nucleic Acid Labeling Product Revenue (undefined) Forecast, by Application 2020 & 2033
- Table 68: North Africa Non-Radioactive Nucleic Acid Labeling Product Volume (K) Forecast, by Application 2020 & 2033
- Table 69: South Africa Non-Radioactive Nucleic Acid Labeling Product Revenue (undefined) Forecast, by Application 2020 & 2033
- Table 70: South Africa Non-Radioactive Nucleic Acid Labeling Product Volume (K) Forecast, by Application 2020 & 2033
- Table 71: Rest of Middle East & Africa Non-Radioactive Nucleic Acid Labeling Product Revenue (undefined) Forecast, by Application 2020 & 2033
- Table 72: Rest of Middle East & Africa Non-Radioactive Nucleic Acid Labeling Product Volume (K) Forecast, by Application 2020 & 2033
- Table 73: Global Non-Radioactive Nucleic Acid Labeling Product Revenue undefined Forecast, by Application 2020 & 2033
- Table 74: Global Non-Radioactive Nucleic Acid Labeling Product Volume K Forecast, by Application 2020 & 2033
- Table 75: Global Non-Radioactive Nucleic Acid Labeling Product Revenue undefined Forecast, by Types 2020 & 2033
- Table 76: Global Non-Radioactive Nucleic Acid Labeling Product Volume K Forecast, by Types 2020 & 2033
- Table 77: Global Non-Radioactive Nucleic Acid Labeling Product Revenue undefined Forecast, by Country 2020 & 2033
- Table 78: Global Non-Radioactive Nucleic Acid Labeling Product Volume K Forecast, by Country 2020 & 2033
- Table 79: China Non-Radioactive Nucleic Acid Labeling Product Revenue (undefined) Forecast, by Application 2020 & 2033
- Table 80: China Non-Radioactive Nucleic Acid Labeling Product Volume (K) Forecast, by Application 2020 & 2033
- Table 81: India Non-Radioactive Nucleic Acid Labeling Product Revenue (undefined) Forecast, by Application 2020 & 2033
- Table 82: India Non-Radioactive Nucleic Acid Labeling Product Volume (K) Forecast, by Application 2020 & 2033
- Table 83: Japan Non-Radioactive Nucleic Acid Labeling Product Revenue (undefined) Forecast, by Application 2020 & 2033
- Table 84: Japan Non-Radioactive Nucleic Acid Labeling Product Volume (K) Forecast, by Application 2020 & 2033
- Table 85: South Korea Non-Radioactive Nucleic Acid Labeling Product Revenue (undefined) Forecast, by Application 2020 & 2033
- Table 86: South Korea Non-Radioactive Nucleic Acid Labeling Product Volume (K) Forecast, by Application 2020 & 2033
- Table 87: ASEAN Non-Radioactive Nucleic Acid Labeling Product Revenue (undefined) Forecast, by Application 2020 & 2033
- Table 88: ASEAN Non-Radioactive Nucleic Acid Labeling Product Volume (K) Forecast, by Application 2020 & 2033
- Table 89: Oceania Non-Radioactive Nucleic Acid Labeling Product Revenue (undefined) Forecast, by Application 2020 & 2033
- Table 90: Oceania Non-Radioactive Nucleic Acid Labeling Product Volume (K) Forecast, by Application 2020 & 2033
- Table 91: Rest of Asia Pacific Non-Radioactive Nucleic Acid Labeling Product Revenue (undefined) Forecast, by Application 2020 & 2033
- Table 92: Rest of Asia Pacific Non-Radioactive Nucleic Acid Labeling Product Volume (K) Forecast, by Application 2020 & 2033
Frequently Asked Questions
1. What is the projected Compound Annual Growth Rate (CAGR) of the Non-Radioactive Nucleic Acid Labeling Product?
The projected CAGR is approximately 13.94%.
2. Which companies are prominent players in the Non-Radioactive Nucleic Acid Labeling Product?
Key companies in the market include Thermo Fisher Scientific, Roche, Promega, PerkinElmer, Agilent Technologies, General Electric, Enzo Biochem, Merck KGaA, Vector Labs, New England Biolabs.
3. What are the main segments of the Non-Radioactive Nucleic Acid Labeling Product?
The market segments include Application, Types.
4. Can you provide details about the market size?
The market size is estimated to be USD XXX N/A as of 2022.
5. What are some drivers contributing to market growth?
N/A
6. What are the notable trends driving market growth?
N/A
7. Are there any restraints impacting market growth?
N/A
8. Can you provide examples of recent developments in the market?
N/A
9. What pricing options are available for accessing the report?
Pricing options include single-user, multi-user, and enterprise licenses priced at USD 4000.00, USD 6000.00, and USD 8000.00 respectively.
10. Is the market size provided in terms of value or volume?
The market size is provided in terms of value, measured in N/A and volume, measured in K.
11. Are there any specific market keywords associated with the report?
Yes, the market keyword associated with the report is "Non-Radioactive Nucleic Acid Labeling Product," which aids in identifying and referencing the specific market segment covered.
12. How do I determine which pricing option suits my needs best?
The pricing options vary based on user requirements and access needs. Individual users may opt for single-user licenses, while businesses requiring broader access may choose multi-user or enterprise licenses for cost-effective access to the report.
13. Are there any additional resources or data provided in the Non-Radioactive Nucleic Acid Labeling Product report?
While the report offers comprehensive insights, it's advisable to review the specific contents or supplementary materials provided to ascertain if additional resources or data are available.
14. How can I stay updated on further developments or reports in the Non-Radioactive Nucleic Acid Labeling Product?
To stay informed about further developments, trends, and reports in the Non-Radioactive Nucleic Acid Labeling Product, consider subscribing to industry newsletters, following relevant companies and organizations, or regularly checking reputable industry news sources and publications.
Methodology
Step 1 - Identification of Relevant Samples Size from Population Database


Step 2 - Approaches for Defining Global Market Size (Value, Volume* & Price*)

Note*: In applicable scenarios
Step 3 - Data Sources
Primary Research
- Web Analytics
- Survey Reports
- Research Institute
- Latest Research Reports
- Opinion Leaders
Secondary Research
- Annual Reports
- White Paper
- Latest Press Release
- Industry Association
- Paid Database
- Investor Presentations

Step 4 - Data Triangulation
Involves using different sources of information in order to increase the validity of a study
These sources are likely to be stakeholders in a program - participants, other researchers, program staff, other community members, and so on.
Then we put all data in single framework & apply various statistical tools to find out the dynamic on the market.
During the analysis stage, feedback from the stakeholder groups would be compared to determine areas of agreement as well as areas of divergence