

Key Insights
The nutrigenomics market, focused on gene-nutrient interactions, is experiencing robust expansion, driven by the increasing prevalence of chronic diseases and growing consumer demand for personalized nutrition. The market is projected to achieve a Compound Annual Growth Rate (CAGR) of 10%, reaching a market size of $1.34 billion by 2024. Advancements in genomic sequencing technologies and a deeper understanding of genetic variations influencing dietary responses are fueling this growth. Key application areas include cardiovascular disease management, obesity treatment, and cancer research, with significant potential in other therapeutic and preventative health sectors. Leading companies are actively investing in R&D, promoting innovation in personalized nutrition products and services. Despite regulatory challenges and testing costs, increasing affordability of genomic testing and consumer desire for tailored health solutions are expected to drive market penetration.
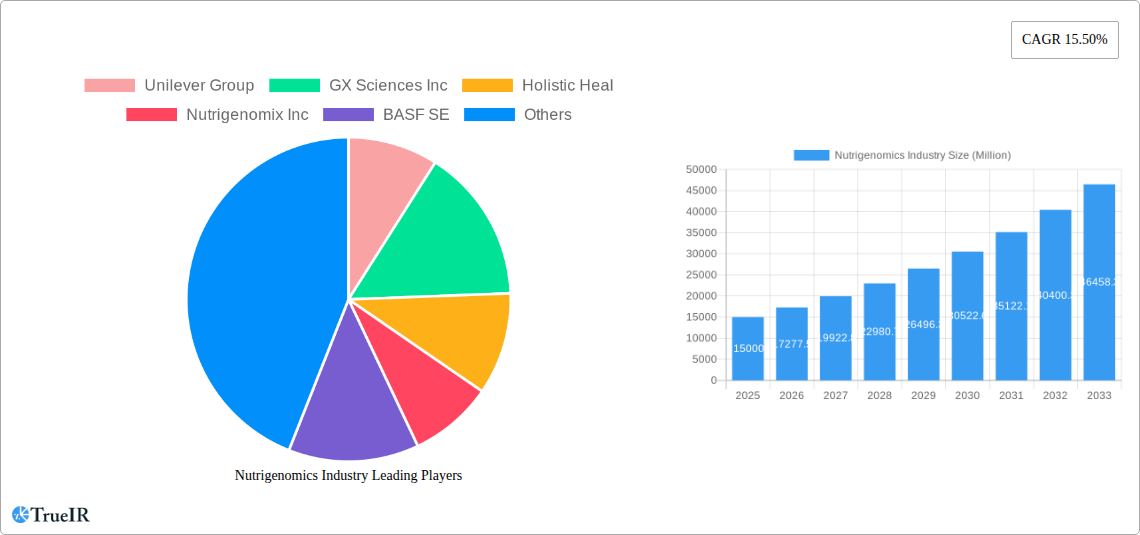
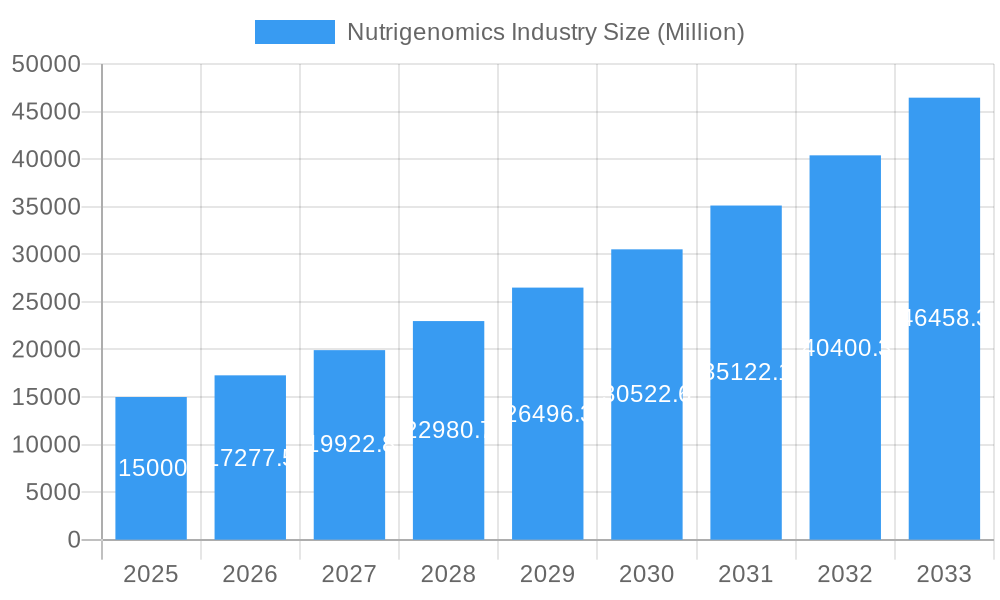
Nutrigenomics Industry Market Size (In Billion)
North America currently leads the market, supported by advanced healthcare infrastructure and high consumer adoption. However, the Asia-Pacific region, particularly China and India, presents rapid growth potential due to large populations and rising disposable incomes, driven by increased awareness of preventative healthcare and personalized medicine.
Nutrigenomics Industry Company Market Share
Market segmentation indicates strong growth across all application areas, with cardiovascular disease and obesity management currently dominating due to high prevalence. Future growth will be accelerated by research into nutrigenomics for autoimmune disorders and metabolic syndrome. The competitive landscape features a mix of multinational corporations and specialized niche players. Strategic partnerships and acquisitions are prevalent, reflecting the market's dynamic nature and ongoing consolidation.
The forecast period of 2024-2033 presents substantial opportunities for innovation and market penetration, led by the continuous development of personalized nutrition solutions tailored to individual genetic profiles. Further expansion is anticipated through more accessible and affordable genomic testing methodologies, broadening the consumer base.
Nutrigenomics Industry Analysis: Market Size, Growth, and Forecast (2024-2033)
This comprehensive report analyzes the nutrigenomics industry, providing critical insights for stakeholders in this evolving market. With a projected market size of $1.34 billion by 2033, the industry is experiencing significant growth fueled by technological advancements, increased consumer awareness, and expanding health applications. This report covers the period 2024-2033, with a focus on the forecast period using 2024 as the base year.
Nutrigenomics Industry Market Structure & Competitive Landscape
The Nutrigenomics market exhibits a moderately concentrated structure, with several key players holding significant market share. However, the landscape is dynamic, characterized by ongoing innovation, strategic mergers and acquisitions (M&A), and evolving regulatory landscapes. The concentration ratio (CR4) for the top four players is estimated at xx%, indicating a competitive yet not overly dominated market. Innovation is a crucial driver, with companies investing heavily in R&D to develop advanced diagnostic tools and personalized nutrition solutions. Regulatory changes, particularly concerning data privacy and labeling, are impacting market dynamics. Product substitution is a significant factor, with companies continually seeking to improve their offerings. End-user segmentation includes healthcare professionals, consumers, and research institutions. The M&A activity has been significant in recent years, with an estimated xx number of deals concluded in the historical period (2019-2024), mainly driven by strategic expansion and technology acquisition. This trend is expected to continue.
- High R&D Expenditure: Significant investments in research and development are driving innovation in diagnostics and personalized nutrition solutions.
- Consolidation Through M&A: The industry is experiencing strategic mergers and acquisitions (M&A) activity, leading to market consolidation.
- Stringent Regulatory Landscape: Government regulations concerning data privacy and labeling are influencing market dynamics.
- Increased Competition: The market features both established players and emerging companies, leading to intense competition.
Nutrigenomics Industry Market Trends & Opportunities
The global Nutrigenomics market is experiencing robust growth, with a projected Compound Annual Growth Rate (CAGR) of xx% during the forecast period (2025-2033). This expansion is driven by several key factors: rising prevalence of chronic diseases like cardiovascular diseases and obesity, increasing consumer awareness of personalized nutrition, and advancements in genomics and biotechnology. Market penetration rates are steadily increasing, particularly in developed economies. Technological advancements, including next-generation sequencing and bioinformatics, are enabling the development of more precise and effective nutrigenomic solutions. Changing consumer preferences towards proactive health management and personalized wellness are also fueling market growth. The competitive landscape is characterized by intense rivalry among established players and emerging companies, leading to continuous innovation and product differentiation.
Dominant Markets & Segments in Nutrigenomics Industry
The North American market currently holds a dominant position in the Nutrigenomics industry, driven by factors such as robust healthcare infrastructure, high consumer spending on wellness, and the presence of major players. However, Asia-Pacific is projected to experience the fastest growth in the coming years.
- Cardiovascular Diseases: This segment is a major driver of market growth due to the high prevalence of cardiovascular diseases and the potential of nutrigenomics to personalize treatment and prevention strategies.
- Obesity: The increasing rates of obesity globally are fueling demand for effective weight management solutions, creating substantial opportunities for nutrigenomic interventions.
- Cancer Research: Nutrigenomics plays a crucial role in cancer research, providing insights into individual responses to treatment and enabling personalized approaches to cancer management.
- Other Applications: This includes applications in diabetes management, mental health, and athletic performance optimization.
Growth Drivers:
- Advanced technologies: Next-generation sequencing, bioinformatics, and AI are revolutionizing data analysis and treatment personalization.
- Increased consumer awareness: The growing understanding of personalized nutrition is boosting demand.
- Favorable government policies: Government initiatives supporting personalized medicine and research are accelerating growth.
Nutrigenomics Industry Product Analysis
The Nutrigenomics industry offers a diverse range of products, including genetic tests, personalized dietary plans, and nutraceutical supplements. These products leverage advancements in genomics and bioinformatics to provide tailored recommendations for nutrition and lifestyle modifications. Key competitive advantages include proprietary testing platforms, comprehensive data analytics capabilities, and strong partnerships with healthcare providers. The market is witnessing a shift towards integrated solutions that combine genetic testing with personalized coaching and support.
Key Drivers, Barriers & Challenges in Nutrigenomics Industry
Key Drivers:
- Technological advancements: Next-generation sequencing and bioinformatics are enabling the development of more accurate and personalized solutions.
- Increased consumer awareness: Consumers are becoming more informed about personalized nutrition and the benefits of nutrigenomics.
- Favorable regulatory environment: Government support for personalized medicine is accelerating market growth.
Challenges:
- High cost of testing: The cost of genetic testing can be prohibitive for some consumers, limiting market penetration.
- Data privacy and security: Concerns about the privacy and security of genetic data are a significant barrier.
- Lack of clinical evidence: For some applications, the scientific evidence supporting nutrigenomic interventions remains limited.
- Competition: Intense competition among established players and new entrants poses a challenge.
Growth Drivers in the Nutrigenomics Industry Market
The Nutrigenomics market is propelled by several key growth factors, including rapid advancements in genomic technologies, a growing awareness among consumers regarding personalized health management, and the rising prevalence of chronic diseases. Furthermore, supportive government policies and increased research funding are significantly contributing to this growth.
Challenges Impacting Nutrigenomics Industry Growth
The Nutrigenomics industry faces significant challenges, including high testing costs, complex regulatory environments, and data privacy concerns. The lack of sufficient clinical evidence for some applications also hinders market adoption. Supply chain disruptions and intense competition from established players and emerging companies further exacerbate these challenges.
Key Players Shaping the Nutrigenomics Industry Market
- Unilever Group
- GX Sciences Inc
- Holistic Heal
- Nutrigenomix Inc
- BASF SE
- Metagenics Inc
- Xcode Life Sciences Private Limited
- DSM
- Danone
- Genova Diagnostics
- Cell-Logic
- GeneSmart
Significant Nutrigenomics Industry Milestones
- September 2022: Pharmagreen Biotech Inc. launched its first formulated nutraceutical product, leveraging fifteen plant and mushroom ingredients, signifying expansion in the nutraceutical segment of the nutrigenomics market.
- January 2022: Epigeneres Biotech secured USD 6 million in Series B funding, showcasing investor confidence in the development and commercialization of molecular medicines and nutrigenomic formulations for cancer and age-related diseases.
Future Outlook for Nutrigenomics Industry Market
The Nutrigenomics industry is poised for substantial growth, driven by continued technological innovation, increasing consumer demand for personalized healthcare, and expanding applications across diverse health sectors. Strategic partnerships, acquisitions, and the development of integrated solutions will be key to success in this rapidly evolving market. The market presents significant opportunities for companies to capitalize on advancements in genomics and data analytics to develop highly effective and personalized healthcare solutions.
Nutrigenomics Industry Segmentation
-
1. Application
- 1.1. Cardiovascular Diseases
- 1.2. Obesity
- 1.3. Cancer Research
- 1.4. Other Applications
Nutrigenomics Industry Segmentation By Geography
-
1. North America
- 1.1. United States
- 1.2. Canada
- 1.3. Mexico
-
2. Europe
- 2.1. Germany
- 2.2. United Kingdom
- 2.3. France
- 2.4. Italy
- 2.5. Spain
- 2.6. Rest of Europe
-
3. Asia Pacific
- 3.1. China
- 3.2. Japan
- 3.3. India
- 3.4. Australia
- 3.5. South Korea
- 3.6. Rest of Asia Pacific
-
4. Middle East and Africa
- 4.1. GCC
- 4.2. South Africa
- 4.3. Rest of Middle East and Africa
-
5. South America
- 5.1. Brazil
- 5.2. Argentina
- 5.3. Rest of South America
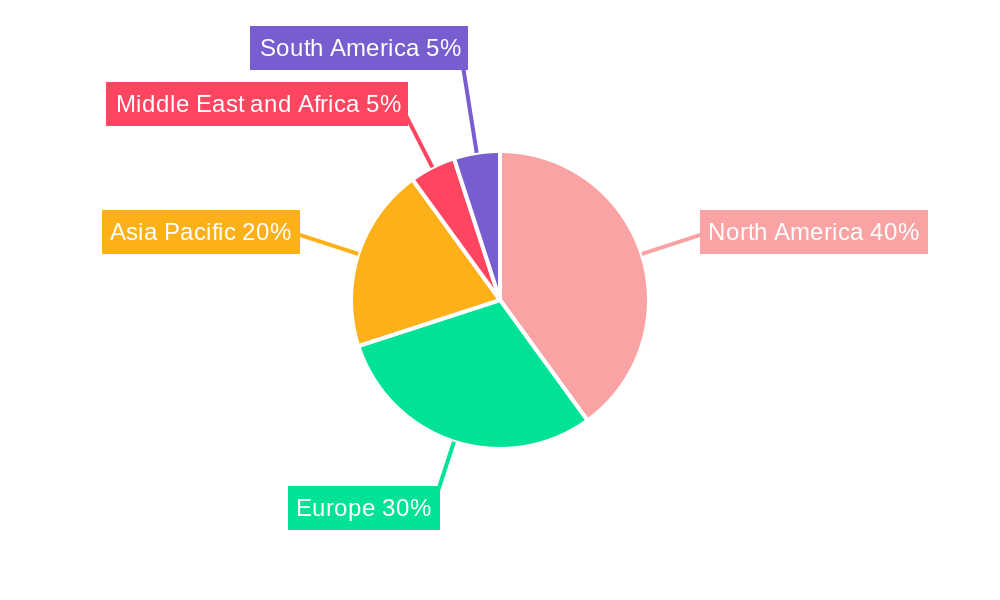
Nutrigenomics Industry Regional Market Share
Geographic Coverage of Nutrigenomics Industry
Nutrigenomics Industry REPORT HIGHLIGHTS
| Aspects | Details |
|---|---|
| Study Period | 2020-2034 |
| Base Year | 2025 |
| Estimated Year | 2026 |
| Forecast Period | 2026-2034 |
| Historical Period | 2020-2025 |
| Growth Rate | CAGR of 10% from 2020-2034 |
| Segmentation |
|
Table of Contents
- 1. Introduction
- 1.1. Research Scope
- 1.2. Market Segmentation
- 1.3. Research Objective
- 1.4. Definitions and Assumptions
- 2. Executive Summary
- 2.1. Market Snapshot
- 3. Market Dynamics
- 3.1. Market Drivers
- 3.2. Market Restrains
- 3.3. Market Trends
- 3.4. Market Opportunities
- 4. Market Factor Analysis
- 4.1. Porters Five Forces
- 4.1.1. Bargaining Power of Suppliers
- 4.1.2. Bargaining Power of Buyers
- 4.1.3. Threat of New Entrants
- 4.1.4. Threat of Substitutes
- 4.1.5. Competitive Rivalry
- 4.2. PESTEL analysis
- 4.3. BCG Analysis
- 4.3.1. Stars (High Growth, High Market Share)
- 4.3.2. Cash Cows (Low Growth, High Market Share)
- 4.3.3. Question Mark (High Growth, Low Market Share)
- 4.3.4. Dogs (Low Growth, Low Market Share)
- 4.4. Ansoff Matrix Analysis
- 4.5. Supply Chain Analysis
- 4.6. Regulatory Landscape
- 4.7. Current Market Potential and Opportunity Assessment (TAM–SAM–SOM Framework)
- 4.8. TIR Analyst Note
- 4.1. Porters Five Forces
- 5. Market Analysis, Insights and Forecast 2021-2033
- 5.1. Market Analysis, Insights and Forecast - by Application
- 5.1.1. Cardiovascular Diseases
- 5.1.2. Obesity
- 5.1.3. Cancer Research
- 5.1.4. Other Applications
- 5.2. Market Analysis, Insights and Forecast - by Region
- 5.2.1. North America
- 5.2.2. Europe
- 5.2.3. Asia Pacific
- 5.2.4. Middle East and Africa
- 5.2.5. South America
- 5.1. Market Analysis, Insights and Forecast - by Application
- 6. Global Nutrigenomics Industry Analysis, Insights and Forecast, 2021-2033
- 6.1. Market Analysis, Insights and Forecast - by Application
- 6.1.1. Cardiovascular Diseases
- 6.1.2. Obesity
- 6.1.3. Cancer Research
- 6.1.4. Other Applications
- 6.1. Market Analysis, Insights and Forecast - by Application
- 7. North America Nutrigenomics Industry Analysis, Insights and Forecast, 2020-2032
- 7.1. Market Analysis, Insights and Forecast - by Application
- 7.1.1. Cardiovascular Diseases
- 7.1.2. Obesity
- 7.1.3. Cancer Research
- 7.1.4. Other Applications
- 7.1. Market Analysis, Insights and Forecast - by Application
- 8. Europe Nutrigenomics Industry Analysis, Insights and Forecast, 2020-2032
- 8.1. Market Analysis, Insights and Forecast - by Application
- 8.1.1. Cardiovascular Diseases
- 8.1.2. Obesity
- 8.1.3. Cancer Research
- 8.1.4. Other Applications
- 8.1. Market Analysis, Insights and Forecast - by Application
- 9. Asia Pacific Nutrigenomics Industry Analysis, Insights and Forecast, 2020-2032
- 9.1. Market Analysis, Insights and Forecast - by Application
- 9.1.1. Cardiovascular Diseases
- 9.1.2. Obesity
- 9.1.3. Cancer Research
- 9.1.4. Other Applications
- 9.1. Market Analysis, Insights and Forecast - by Application
- 10. Middle East and Africa Nutrigenomics Industry Analysis, Insights and Forecast, 2020-2032
- 10.1. Market Analysis, Insights and Forecast - by Application
- 10.1.1. Cardiovascular Diseases
- 10.1.2. Obesity
- 10.1.3. Cancer Research
- 10.1.4. Other Applications
- 10.1. Market Analysis, Insights and Forecast - by Application
- 11. South America Nutrigenomics Industry Analysis, Insights and Forecast, 2020-2032
- 11.1. Market Analysis, Insights and Forecast - by Application
- 11.1.1. Cardiovascular Diseases
- 11.1.2. Obesity
- 11.1.3. Cancer Research
- 11.1.4. Other Applications
- 11.1. Market Analysis, Insights and Forecast - by Application
- 12. Competitive Analysis
- 12.1. Company Profiles
- 12.1.1 Unilever Group
- 12.1.1.1. Company Overview
- 12.1.1.2. Products
- 12.1.1.3. Company Financials
- 12.1.1.4. SWOT Analysis
- 12.1.2 GX Sciences Inc
- 12.1.2.1. Company Overview
- 12.1.2.2. Products
- 12.1.2.3. Company Financials
- 12.1.2.4. SWOT Analysis
- 12.1.3 Holistic Heal
- 12.1.3.1. Company Overview
- 12.1.3.2. Products
- 12.1.3.3. Company Financials
- 12.1.3.4. SWOT Analysis
- 12.1.4 Nutrigenomix Inc
- 12.1.4.1. Company Overview
- 12.1.4.2. Products
- 12.1.4.3. Company Financials
- 12.1.4.4. SWOT Analysis
- 12.1.5 BASF SE
- 12.1.5.1. Company Overview
- 12.1.5.2. Products
- 12.1.5.3. Company Financials
- 12.1.5.4. SWOT Analysis
- 12.1.6 Metagenics Inc
- 12.1.6.1. Company Overview
- 12.1.6.2. Products
- 12.1.6.3. Company Financials
- 12.1.6.4. SWOT Analysis
- 12.1.7 Xcode Life Sciences Private Limited
- 12.1.7.1. Company Overview
- 12.1.7.2. Products
- 12.1.7.3. Company Financials
- 12.1.7.4. SWOT Analysis
- 12.1.8 DSM
- 12.1.8.1. Company Overview
- 12.1.8.2. Products
- 12.1.8.3. Company Financials
- 12.1.8.4. SWOT Analysis
- 12.1.9 Danone
- 12.1.9.1. Company Overview
- 12.1.9.2. Products
- 12.1.9.3. Company Financials
- 12.1.9.4. SWOT Analysis
- 12.1.10 Genova Diagnostics
- 12.1.10.1. Company Overview
- 12.1.10.2. Products
- 12.1.10.3. Company Financials
- 12.1.10.4. SWOT Analysis
- 12.1.11 Cell-Logic
- 12.1.11.1. Company Overview
- 12.1.11.2. Products
- 12.1.11.3. Company Financials
- 12.1.11.4. SWOT Analysis
- 12.1.12 GeneSmart
- 12.1.12.1. Company Overview
- 12.1.12.2. Products
- 12.1.12.3. Company Financials
- 12.1.12.4. SWOT Analysis
- 12.1.1 Unilever Group
- 12.2. Market Entropy
- 12.2.1 Company's Key Areas Served
- 12.2.2 Recent Developments
- 12.3. Company Market Share Analysis 2025
- 12.3.1 Top 5 Companies Market Share Analysis
- 12.3.2 Top 3 Companies Market Share Analysis
- 12.4. List of Potential Customers
- 13. Research Methodology
List of Figures
- Figure 1: Global Nutrigenomics Industry Revenue Breakdown (billion, %) by Region 2025 & 2033
- Figure 2: North America Nutrigenomics Industry Revenue (billion), by Application 2025 & 2033
- Figure 3: North America Nutrigenomics Industry Revenue Share (%), by Application 2025 & 2033
- Figure 4: North America Nutrigenomics Industry Revenue (billion), by Country 2025 & 2033
- Figure 5: North America Nutrigenomics Industry Revenue Share (%), by Country 2025 & 2033
- Figure 6: Europe Nutrigenomics Industry Revenue (billion), by Application 2025 & 2033
- Figure 7: Europe Nutrigenomics Industry Revenue Share (%), by Application 2025 & 2033
- Figure 8: Europe Nutrigenomics Industry Revenue (billion), by Country 2025 & 2033
- Figure 9: Europe Nutrigenomics Industry Revenue Share (%), by Country 2025 & 2033
- Figure 10: Asia Pacific Nutrigenomics Industry Revenue (billion), by Application 2025 & 2033
- Figure 11: Asia Pacific Nutrigenomics Industry Revenue Share (%), by Application 2025 & 2033
- Figure 12: Asia Pacific Nutrigenomics Industry Revenue (billion), by Country 2025 & 2033
- Figure 13: Asia Pacific Nutrigenomics Industry Revenue Share (%), by Country 2025 & 2033
- Figure 14: Middle East and Africa Nutrigenomics Industry Revenue (billion), by Application 2025 & 2033
- Figure 15: Middle East and Africa Nutrigenomics Industry Revenue Share (%), by Application 2025 & 2033
- Figure 16: Middle East and Africa Nutrigenomics Industry Revenue (billion), by Country 2025 & 2033
- Figure 17: Middle East and Africa Nutrigenomics Industry Revenue Share (%), by Country 2025 & 2033
- Figure 18: South America Nutrigenomics Industry Revenue (billion), by Application 2025 & 2033
- Figure 19: South America Nutrigenomics Industry Revenue Share (%), by Application 2025 & 2033
- Figure 20: South America Nutrigenomics Industry Revenue (billion), by Country 2025 & 2033
- Figure 21: South America Nutrigenomics Industry Revenue Share (%), by Country 2025 & 2033
List of Tables
- Table 1: Global Nutrigenomics Industry Revenue billion Forecast, by Application 2020 & 2033
- Table 2: Global Nutrigenomics Industry Revenue billion Forecast, by Region 2020 & 2033
- Table 3: Global Nutrigenomics Industry Revenue billion Forecast, by Application 2020 & 2033
- Table 4: Global Nutrigenomics Industry Revenue billion Forecast, by Country 2020 & 2033
- Table 5: United States Nutrigenomics Industry Revenue (billion) Forecast, by Application 2020 & 2033
- Table 6: Canada Nutrigenomics Industry Revenue (billion) Forecast, by Application 2020 & 2033
- Table 7: Mexico Nutrigenomics Industry Revenue (billion) Forecast, by Application 2020 & 2033
- Table 8: Global Nutrigenomics Industry Revenue billion Forecast, by Application 2020 & 2033
- Table 9: Global Nutrigenomics Industry Revenue billion Forecast, by Country 2020 & 2033
- Table 10: Germany Nutrigenomics Industry Revenue (billion) Forecast, by Application 2020 & 2033
- Table 11: United Kingdom Nutrigenomics Industry Revenue (billion) Forecast, by Application 2020 & 2033
- Table 12: France Nutrigenomics Industry Revenue (billion) Forecast, by Application 2020 & 2033
- Table 13: Italy Nutrigenomics Industry Revenue (billion) Forecast, by Application 2020 & 2033
- Table 14: Spain Nutrigenomics Industry Revenue (billion) Forecast, by Application 2020 & 2033
- Table 15: Rest of Europe Nutrigenomics Industry Revenue (billion) Forecast, by Application 2020 & 2033
- Table 16: Global Nutrigenomics Industry Revenue billion Forecast, by Application 2020 & 2033
- Table 17: Global Nutrigenomics Industry Revenue billion Forecast, by Country 2020 & 2033
- Table 18: China Nutrigenomics Industry Revenue (billion) Forecast, by Application 2020 & 2033
- Table 19: Japan Nutrigenomics Industry Revenue (billion) Forecast, by Application 2020 & 2033
- Table 20: India Nutrigenomics Industry Revenue (billion) Forecast, by Application 2020 & 2033
- Table 21: Australia Nutrigenomics Industry Revenue (billion) Forecast, by Application 2020 & 2033
- Table 22: South Korea Nutrigenomics Industry Revenue (billion) Forecast, by Application 2020 & 2033
- Table 23: Rest of Asia Pacific Nutrigenomics Industry Revenue (billion) Forecast, by Application 2020 & 2033
- Table 24: Global Nutrigenomics Industry Revenue billion Forecast, by Application 2020 & 2033
- Table 25: Global Nutrigenomics Industry Revenue billion Forecast, by Country 2020 & 2033
- Table 26: GCC Nutrigenomics Industry Revenue (billion) Forecast, by Application 2020 & 2033
- Table 27: South Africa Nutrigenomics Industry Revenue (billion) Forecast, by Application 2020 & 2033
- Table 28: Rest of Middle East and Africa Nutrigenomics Industry Revenue (billion) Forecast, by Application 2020 & 2033
- Table 29: Global Nutrigenomics Industry Revenue billion Forecast, by Application 2020 & 2033
- Table 30: Global Nutrigenomics Industry Revenue billion Forecast, by Country 2020 & 2033
- Table 31: Brazil Nutrigenomics Industry Revenue (billion) Forecast, by Application 2020 & 2033
- Table 32: Argentina Nutrigenomics Industry Revenue (billion) Forecast, by Application 2020 & 2033
- Table 33: Rest of South America Nutrigenomics Industry Revenue (billion) Forecast, by Application 2020 & 2033
Frequently Asked Questions
1. What is the projected Compound Annual Growth Rate (CAGR) of the Nutrigenomics Industry?
The projected CAGR is approximately 10%.
2. Which companies are prominent players in the Nutrigenomics Industry?
Key companies in the market include Unilever Group, GX Sciences Inc, Holistic Heal, Nutrigenomix Inc, BASF SE, Metagenics Inc, Xcode Life Sciences Private Limited, DSM, Danone, Genova Diagnostics, Cell-Logic, GeneSmart.
3. What are the main segments of the Nutrigenomics Industry?
The market segments include Application.
4. Can you provide details about the market size?
The market size is estimated to be USD 1.34 billion as of 2022.
5. What are some drivers contributing to market growth?
Increasing Prevalence of Obesity; Increasing Popularity for Personalised Diet; Intense Research for Cancer Prevention and Cure.
6. What are the notable trends driving market growth?
Obesity Segment is Anticipated to Witness Growth Over the Forecast Period.
7. Are there any restraints impacting market growth?
Lack of Regulatory Approvals; Lack of Proven Results for Nutrigenomics Study Support.
8. Can you provide examples of recent developments in the market?
September 2022: Pharmagreen Biotech Inc. has developed its first formulated nutraceutical product and is in the process of organizing the retail sales distribution channels for its new product. This nutraceutical product utilizes a combination of fifteen ingredients from medicinal plants and mushrooms.
9. What pricing options are available for accessing the report?
Pricing options include single-user, multi-user, and enterprise licenses priced at USD 4750, USD 5250, and USD 8750 respectively.
10. Is the market size provided in terms of value or volume?
The market size is provided in terms of value, measured in billion.
11. Are there any specific market keywords associated with the report?
Yes, the market keyword associated with the report is "Nutrigenomics Industry," which aids in identifying and referencing the specific market segment covered.
12. How do I determine which pricing option suits my needs best?
The pricing options vary based on user requirements and access needs. Individual users may opt for single-user licenses, while businesses requiring broader access may choose multi-user or enterprise licenses for cost-effective access to the report.
13. Are there any additional resources or data provided in the Nutrigenomics Industry report?
While the report offers comprehensive insights, it's advisable to review the specific contents or supplementary materials provided to ascertain if additional resources or data are available.
14. How can I stay updated on further developments or reports in the Nutrigenomics Industry?
To stay informed about further developments, trends, and reports in the Nutrigenomics Industry, consider subscribing to industry newsletters, following relevant companies and organizations, or regularly checking reputable industry news sources and publications.
Methodology
Step 1 - Identification of Relevant Samples Size from Population Database


Step 2 - Approaches for Defining Global Market Size (Value, Volume* & Price*)

Note*: In applicable scenarios
Step 3 - Data Sources
Primary Research
- Web Analytics
- Survey Reports
- Research Institute
- Latest Research Reports
- Opinion Leaders
Secondary Research
- Annual Reports
- White Paper
- Latest Press Release
- Industry Association
- Paid Database
- Investor Presentations

Step 4 - Data Triangulation
Involves using different sources of information in order to increase the validity of a study
These sources are likely to be stakeholders in a program - participants, other researchers, program staff, other community members, and so on.
Then we put all data in single framework & apply various statistical tools to find out the dynamic on the market.
During the analysis stage, feedback from the stakeholder groups would be compared to determine areas of agreement as well as areas of divergence