

Key Insights
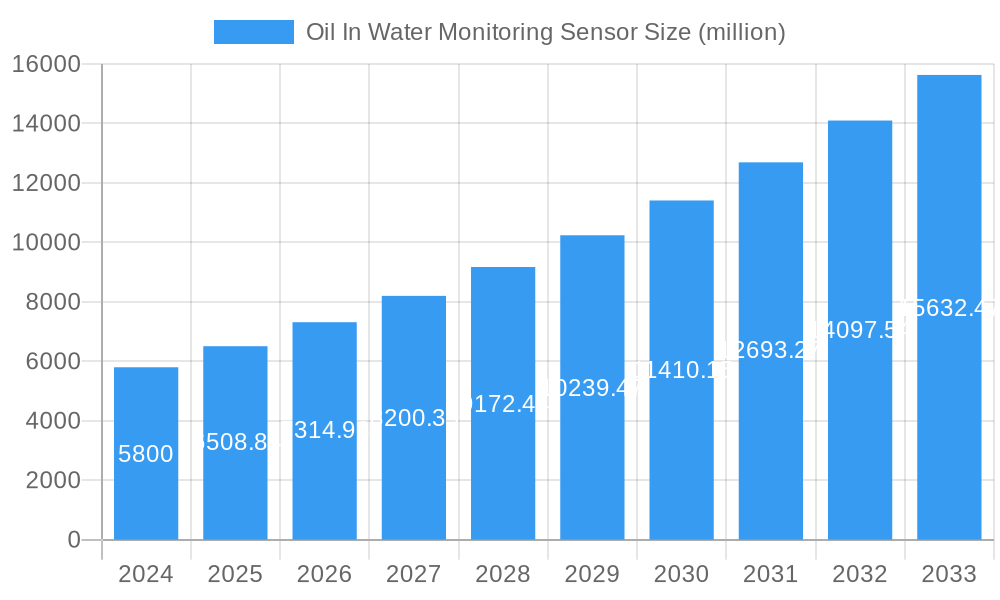
The global Oil in Water Monitoring Sensor market is experiencing robust growth, projected to reach approximately USD 5.8 billion in 2024, and is anticipated to expand at a Compound Annual Growth Rate (CAGR) of 12.3% during the forecast period of 2025-2033. This substantial market size and high growth trajectory are driven by an increasing global emphasis on environmental protection and stringent regulatory mandates across various industries. Key drivers include the escalating need for effective wastewater management in sectors like sewage treatment, where the detection and quantification of oil contamination are critical for public health and ecosystem preservation. The petroleum and chemical industries, by their very nature, face continuous challenges in managing oily wastewater, necessitating advanced monitoring solutions to prevent environmental damage and comply with discharge standards. Furthermore, the growing demand for clean water resources and the expansion of aquaculture operations, which are sensitive to water quality, are also contributing significantly to market expansion.
Oil In Water Monitoring Sensor Market Size (In Billion)
The market is characterized by diverse applications, with sewage treatment and the petroleum & chemical industries emerging as dominant segments due to the scale of their operations and the environmental risks associated with oil contamination. The development and adoption of sophisticated sensor technologies, including optical, electrochemical, and infrared sensors, are further fueling market growth by offering enhanced accuracy, real-time monitoring capabilities, and cost-effectiveness. While the market demonstrates a promising outlook, certain factors could influence its trajectory. Potential restraints might include the high initial investment cost for advanced sensor systems in smaller enterprises and the need for specialized technical expertise for installation and maintenance. However, the continuous innovation in sensor technology, coupled with increasing awareness of the long-term economic and environmental benefits of effective oil in water monitoring, is expected to outweigh these challenges, ensuring sustained market expansion and a positive future for this vital segment of environmental monitoring technology.
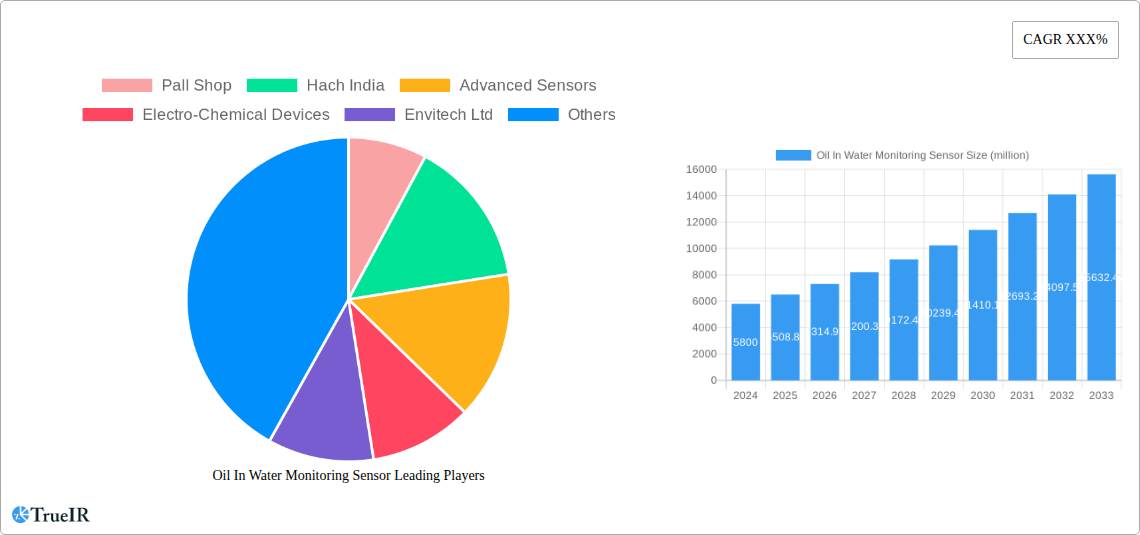
Oil In Water Monitoring Sensor Company Market Share
Oil In Water Monitoring Sensor Market Structure & Competitive Landscape
The oil in water monitoring sensor market exhibits a moderate level of concentration, with a blend of established global players and emerging regional specialists. Key innovation drivers include advancements in sensor miniaturization, real-time data transmission capabilities, and the development of more robust and accurate sensing technologies resistant to interference. Regulatory impacts are significant, with stringent environmental standards for wastewater discharge and industrial effluent driving demand for sophisticated monitoring solutions. Product substitutes, while present in the form of manual sampling and laboratory analysis, are increasingly being displaced by continuous online monitoring systems due to their efficiency and cost-effectiveness over time. End-user segmentation highlights the critical role of the Petroleum and Chemical Industry and Sewage Treatment applications, which represent a substantial portion of market share. Merger and acquisition (M&A) trends are indicative of market consolidation, with approximately 5 billion in M&A activities recorded over the historical period, driven by companies seeking to expand their product portfolios, geographic reach, and technological expertise. The market's competitive landscape is characterized by a dynamic interplay between product performance, price, and after-sales support, with companies like Pall Shop, Hach India, and Advanced Sensors vying for market leadership through strategic product development and partnerships.
Oil In Water Monitoring Sensor Market Trends & Opportunities
The global oil in water monitoring sensor market is poised for substantial growth, projected to expand at a Compound Annual Growth Rate (CAGR) of approximately 7.5 billion from 2025 to 2033. This expansion is fueled by a confluence of escalating environmental regulations, increasing industrialization, and a heightened awareness of water resource protection. The market size, estimated at xx billion in the base year of 2025, is expected to reach a significant xx billion by 2033, driven by the indispensable need for accurate and continuous monitoring of oil contamination in various aquatic environments. Technological shifts are central to this growth trajectory. The transition from traditional, labor-intensive sampling methods to advanced, real-time online monitoring systems is a dominant trend. Optical sensor technologies are gaining traction due to their non-intrusive nature and high sensitivity, while electrochemical and infrared sensors offer robust performance in diverse industrial settings. Ultrasonic sensors are also emerging as a viable option for specific applications. Consumer preferences are increasingly leaning towards integrated solutions that offer not only reliable data but also seamless data management and reporting capabilities, often facilitated by IoT connectivity. This demand for smart monitoring solutions presents a significant opportunity for sensor manufacturers to embed advanced analytics and predictive maintenance features into their offerings. Competitive dynamics are intensifying, with companies investing heavily in research and development to introduce next-generation sensors that offer improved accuracy, lower detection limits, and enhanced durability in harsh operating conditions. The market penetration rates for advanced oil in water monitoring sensors are expected to rise significantly across all key application segments, particularly in the oil and gas, petrochemical, and municipal wastewater treatment sectors. The growing emphasis on sustainable practices and the circular economy further bolsters the demand for effective water management technologies, creating a fertile ground for innovation and market expansion. The increasing stringency of regulations globally, mandating precise monitoring of oil discharge limits, acts as a constant catalyst for market adoption. Furthermore, the expanding applications in aquaculture and oceanographic research, albeit nascent, represent future growth avenues.
Dominant Markets & Segments in Oil In Water Monitoring Sensor
The Petroleum and Chemical Industry segment stands as a dominant force in the oil in water monitoring sensor market, driven by the inherently oil-intensive nature of its operations and stringent regulatory frameworks governing effluent discharge. This sector's demand for precise monitoring is paramount to prevent environmental damage and ensure compliance, making it a consistent revenue generator. Within this segment, key growth drivers include the expansion of refining capacities and petrochemical complexes, particularly in emerging economies, and the increasing adoption of advanced process control technologies that rely on real-time sensor data for optimization and safety.
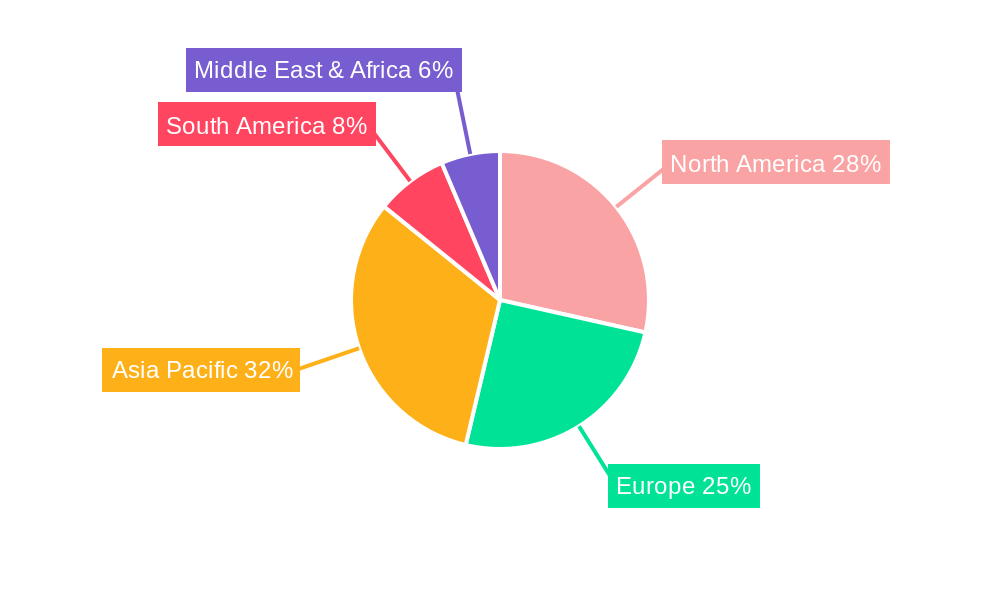
Regionally, Asia Pacific is emerging as a leading market for oil in water monitoring sensors. This dominance is attributed to rapid industrialization, coupled with a growing emphasis on environmental protection and stricter enforcement of water quality standards. Countries like China and India are witnessing significant investments in industrial infrastructure, including refineries, chemical plants, and wastewater treatment facilities, all of which require robust oil in water monitoring solutions. Government initiatives promoting sustainable development and pollution control further bolster market growth in this region.
Among sensor types, Optical Sensors are experiencing robust growth and are poised to capture a significant market share. Their non-intrusive nature, high sensitivity, and ability to detect a wide range of oil types make them exceptionally well-suited for diverse applications. Advancements in fluorescence-based and light-scattering technologies are enhancing their accuracy and reliability. This technological evolution, coupled with their cost-effectiveness in continuous monitoring scenarios, positions optical sensors as a preferred choice for many end-users.
The Sewage Treatment application is another critical segment exhibiting strong growth. As urban populations expand and wastewater management becomes a global priority, the need to monitor and control oil and grease content in municipal sewage before discharge is intensifying. Infrastructure development projects focused on upgrading wastewater treatment plants and the implementation of stricter environmental discharge limits are key growth drivers in this segment. The ability of oil in water sensors to provide continuous data aids in optimizing treatment processes and ensuring compliance with regulatory mandates.
Oil In Water Monitoring Sensor Product Analysis
Product innovations in the oil in water monitoring sensor market are characterized by enhanced sensitivity, miniaturization, and integration capabilities. Manufacturers are focusing on developing sensors capable of detecting a wider spectrum of oil types with lower detection limits, crucial for meeting increasingly stringent environmental regulations. For instance, advanced optical sensors utilizing fluorescence spectroscopy offer superior performance in identifying hydrocarbon traces. The competitive advantage lies in offering robust, field-deployable solutions that provide real-time, accurate data with minimal maintenance requirements, catering to diverse applications from industrial effluent monitoring to environmental protection in aquatic ecosystems.
Key Drivers, Barriers & Challenges in Oil In Water Monitoring Sensor
The oil in water monitoring sensor market is propelled by several key drivers. Technological advancements in sensor accuracy and miniaturization, coupled with the growing demand for real-time data acquisition and IoT integration, are significant growth catalysts. Strict environmental regulations worldwide, mandating precise monitoring of oil discharge in industrial and municipal wastewater, are a primary impetus. Furthermore, the increasing focus on water resource management and conservation, especially in oil-dependent economies, drives the adoption of effective monitoring solutions.
However, the market faces considerable challenges and restraints. High initial investment costs for advanced monitoring systems can be a barrier for smaller industries. Complex installation and maintenance requirements for certain sensor technologies, particularly in harsh industrial environments, pose a challenge. Interference from other substances in water samples can affect sensor accuracy, necessitating robust calibration and signal processing. Regulatory inconsistencies across different regions and a lack of standardized testing protocols can create market fragmentation and hinder widespread adoption. Supply chain disruptions and the availability of skilled personnel for calibration and maintenance also present potential restraints.
Growth Drivers in the Oil In Water Monitoring Sensor Market
The growth of the oil in water monitoring sensor market is primarily driven by an increasing global emphasis on environmental sustainability and stringent regulatory mandates for water quality. Technological innovation plays a pivotal role, with continuous advancements in sensor accuracy, miniaturization, and real-time data transmission capabilities enhancing the efficacy and appeal of these monitoring solutions. The expansion of industries such as petroleum, chemicals, and manufacturing, particularly in emerging economies, inherently increases the need for effective oil contamination control. Furthermore, a growing awareness of the ecological and economic impact of water pollution is fostering greater demand for proactive monitoring and management strategies.
Challenges Impacting Oil In Water Monitoring Sensor Growth
Despite the promising growth outlook, several challenges impede the expansion of the oil in water monitoring sensor market. The high initial cost associated with sophisticated sensor systems can be a significant barrier, particularly for small and medium-sized enterprises or in regions with limited financial resources. Furthermore, the complexity of installation, calibration, and ongoing maintenance for certain advanced technologies requires specialized technical expertise, which may not always be readily available. Interference from other water constituents, such as suspended solids or dissolved organic matter, can compromise sensor accuracy, necessitating robust signal processing and intelligent algorithms. Regulatory landscapes can also be fragmented, with varying standards and enforcement levels across different geographies, creating complexities for manufacturers and end-users alike.
Key Players Shaping the Oil In Water Monitoring Sensor Market
- Pall Shop
- Hach India
- Advanced Sensors
- Electro-Chemical Devices
- Envitech Ltd
- Pyxis Lab
- Brix Engg
- GO-Systemelektronik GmbH
- Apure Instruments
- KONGSBERG
Significant Oil In Water Monitoring Sensor Industry Milestones
- 2019: Introduction of novel fluorescence-based optical sensors offering improved sensitivity for hydrocarbon detection.
- 2020: Increased regulatory scrutiny on industrial wastewater discharge, driving demand for continuous monitoring solutions.
- 2021: Launch of miniaturized, IoT-enabled sensors facilitating remote data access and analysis.
- 2022: Consolidation within the market with key acquisitions aimed at expanding product portfolios and market reach.
- 2023: Development of AI-powered algorithms for enhanced data interpretation and predictive maintenance in monitoring systems.
- 2024: Growing adoption of ultrasonic sensors in specific industrial applications for their non-intrusive capabilities.
Future Outlook for Oil In Water Monitoring Sensor Market
The future outlook for the oil in water monitoring sensor market is exceptionally positive, underpinned by an accelerating global drive towards sustainable water management and stricter environmental compliance. Continued technological innovation, particularly in areas like artificial intelligence for data analytics and machine learning for predictive maintenance, will further enhance sensor capabilities and user experience. The expansion of smart city initiatives and the increasing integration of IoT technologies will fuel the demand for connected monitoring systems. Strategic opportunities lie in developing cost-effective solutions for underserved markets and expanding applications into emerging sectors like offshore renewable energy installations. The market is set to witness sustained growth, driven by the indispensable need to protect vital aquatic resources from oil contamination.
Oil In Water Monitoring Sensor Segmentation
-
1. Application
- 1.1. Sewage Treatment
- 1.2. Petroleum and Chemical Industry
- 1.3. Aquaculture
- 1.4. Ocean
- 1.5. Others
-
2. Type
- 2.1. Optical Sensor
- 2.2. Electrochemical Sensor
- 2.3. Infrared Sensor
- 2.4. Ultrasonic Sensor
- 2.5. Capillary Adsorption Sensor
Oil In Water Monitoring Sensor Segmentation By Geography
-
1. North America
- 1.1. United States
- 1.2. Canada
- 1.3. Mexico
-
2. South America
- 2.1. Brazil
- 2.2. Argentina
- 2.3. Rest of South America
-
3. Europe
- 3.1. United Kingdom
- 3.2. Germany
- 3.3. France
- 3.4. Italy
- 3.5. Spain
- 3.6. Russia
- 3.7. Benelux
- 3.8. Nordics
- 3.9. Rest of Europe
-
4. Middle East & Africa
- 4.1. Turkey
- 4.2. Israel
- 4.3. GCC
- 4.4. North Africa
- 4.5. South Africa
- 4.6. Rest of Middle East & Africa
-
5. Asia Pacific
- 5.1. China
- 5.2. India
- 5.3. Japan
- 5.4. South Korea
- 5.5. ASEAN
- 5.6. Oceania
- 5.7. Rest of Asia Pacific
Oil In Water Monitoring Sensor Regional Market Share
Geographic Coverage of Oil In Water Monitoring Sensor
Oil In Water Monitoring Sensor REPORT HIGHLIGHTS
| Aspects | Details |
|---|---|
| Study Period | 2020-2034 |
| Base Year | 2025 |
| Estimated Year | 2026 |
| Forecast Period | 2026-2034 |
| Historical Period | 2020-2025 |
| Growth Rate | CAGR of 12.3% from 2020-2034 |
| Segmentation |
|
Table of Contents
- 1. Introduction
- 1.1. Research Scope
- 1.2. Market Segmentation
- 1.3. Research Methodology
- 1.4. Definitions and Assumptions
- 2. Executive Summary
- 2.1. Introduction
- 3. Market Dynamics
- 3.1. Introduction
- 3.2. Market Drivers
- 3.3. Market Restrains
- 3.4. Market Trends
- 4. Market Factor Analysis
- 4.1. Porters Five Forces
- 4.2. Supply/Value Chain
- 4.3. PESTEL analysis
- 4.4. Market Entropy
- 4.5. Patent/Trademark Analysis
- 5. Global Oil In Water Monitoring Sensor Analysis, Insights and Forecast, 2020-2032
- 5.1. Market Analysis, Insights and Forecast - by Application
- 5.1.1. Sewage Treatment
- 5.1.2. Petroleum and Chemical Industry
- 5.1.3. Aquaculture
- 5.1.4. Ocean
- 5.1.5. Others
- 5.2. Market Analysis, Insights and Forecast - by Type
- 5.2.1. Optical Sensor
- 5.2.2. Electrochemical Sensor
- 5.2.3. Infrared Sensor
- 5.2.4. Ultrasonic Sensor
- 5.2.5. Capillary Adsorption Sensor
- 5.3. Market Analysis, Insights and Forecast - by Region
- 5.3.1. North America
- 5.3.2. South America
- 5.3.3. Europe
- 5.3.4. Middle East & Africa
- 5.3.5. Asia Pacific
- 5.1. Market Analysis, Insights and Forecast - by Application
- 6. North America Oil In Water Monitoring Sensor Analysis, Insights and Forecast, 2020-2032
- 6.1. Market Analysis, Insights and Forecast - by Application
- 6.1.1. Sewage Treatment
- 6.1.2. Petroleum and Chemical Industry
- 6.1.3. Aquaculture
- 6.1.4. Ocean
- 6.1.5. Others
- 6.2. Market Analysis, Insights and Forecast - by Type
- 6.2.1. Optical Sensor
- 6.2.2. Electrochemical Sensor
- 6.2.3. Infrared Sensor
- 6.2.4. Ultrasonic Sensor
- 6.2.5. Capillary Adsorption Sensor
- 6.1. Market Analysis, Insights and Forecast - by Application
- 7. South America Oil In Water Monitoring Sensor Analysis, Insights and Forecast, 2020-2032
- 7.1. Market Analysis, Insights and Forecast - by Application
- 7.1.1. Sewage Treatment
- 7.1.2. Petroleum and Chemical Industry
- 7.1.3. Aquaculture
- 7.1.4. Ocean
- 7.1.5. Others
- 7.2. Market Analysis, Insights and Forecast - by Type
- 7.2.1. Optical Sensor
- 7.2.2. Electrochemical Sensor
- 7.2.3. Infrared Sensor
- 7.2.4. Ultrasonic Sensor
- 7.2.5. Capillary Adsorption Sensor
- 7.1. Market Analysis, Insights and Forecast - by Application
- 8. Europe Oil In Water Monitoring Sensor Analysis, Insights and Forecast, 2020-2032
- 8.1. Market Analysis, Insights and Forecast - by Application
- 8.1.1. Sewage Treatment
- 8.1.2. Petroleum and Chemical Industry
- 8.1.3. Aquaculture
- 8.1.4. Ocean
- 8.1.5. Others
- 8.2. Market Analysis, Insights and Forecast - by Type
- 8.2.1. Optical Sensor
- 8.2.2. Electrochemical Sensor
- 8.2.3. Infrared Sensor
- 8.2.4. Ultrasonic Sensor
- 8.2.5. Capillary Adsorption Sensor
- 8.1. Market Analysis, Insights and Forecast - by Application
- 9. Middle East & Africa Oil In Water Monitoring Sensor Analysis, Insights and Forecast, 2020-2032
- 9.1. Market Analysis, Insights and Forecast - by Application
- 9.1.1. Sewage Treatment
- 9.1.2. Petroleum and Chemical Industry
- 9.1.3. Aquaculture
- 9.1.4. Ocean
- 9.1.5. Others
- 9.2. Market Analysis, Insights and Forecast - by Type
- 9.2.1. Optical Sensor
- 9.2.2. Electrochemical Sensor
- 9.2.3. Infrared Sensor
- 9.2.4. Ultrasonic Sensor
- 9.2.5. Capillary Adsorption Sensor
- 9.1. Market Analysis, Insights and Forecast - by Application
- 10. Asia Pacific Oil In Water Monitoring Sensor Analysis, Insights and Forecast, 2020-2032
- 10.1. Market Analysis, Insights and Forecast - by Application
- 10.1.1. Sewage Treatment
- 10.1.2. Petroleum and Chemical Industry
- 10.1.3. Aquaculture
- 10.1.4. Ocean
- 10.1.5. Others
- 10.2. Market Analysis, Insights and Forecast - by Type
- 10.2.1. Optical Sensor
- 10.2.2. Electrochemical Sensor
- 10.2.3. Infrared Sensor
- 10.2.4. Ultrasonic Sensor
- 10.2.5. Capillary Adsorption Sensor
- 10.1. Market Analysis, Insights and Forecast - by Application
- 11. Competitive Analysis
- 11.1. Global Market Share Analysis 2025
- 11.2. Company Profiles
- 11.2.1 Pall Shop
- 11.2.1.1. Overview
- 11.2.1.2. Products
- 11.2.1.3. SWOT Analysis
- 11.2.1.4. Recent Developments
- 11.2.1.5. Financials (Based on Availability)
- 11.2.2 Hach India
- 11.2.2.1. Overview
- 11.2.2.2. Products
- 11.2.2.3. SWOT Analysis
- 11.2.2.4. Recent Developments
- 11.2.2.5. Financials (Based on Availability)
- 11.2.3 Advanced Sensors
- 11.2.3.1. Overview
- 11.2.3.2. Products
- 11.2.3.3. SWOT Analysis
- 11.2.3.4. Recent Developments
- 11.2.3.5. Financials (Based on Availability)
- 11.2.4 Electro-Chemical Devices
- 11.2.4.1. Overview
- 11.2.4.2. Products
- 11.2.4.3. SWOT Analysis
- 11.2.4.4. Recent Developments
- 11.2.4.5. Financials (Based on Availability)
- 11.2.5 Envitech Ltd
- 11.2.5.1. Overview
- 11.2.5.2. Products
- 11.2.5.3. SWOT Analysis
- 11.2.5.4. Recent Developments
- 11.2.5.5. Financials (Based on Availability)
- 11.2.6 Pyxis Lab
- 11.2.6.1. Overview
- 11.2.6.2. Products
- 11.2.6.3. SWOT Analysis
- 11.2.6.4. Recent Developments
- 11.2.6.5. Financials (Based on Availability)
- 11.2.7 Brix Engg
- 11.2.7.1. Overview
- 11.2.7.2. Products
- 11.2.7.3. SWOT Analysis
- 11.2.7.4. Recent Developments
- 11.2.7.5. Financials (Based on Availability)
- 11.2.8 GO-Systemelektronik GmbH
- 11.2.8.1. Overview
- 11.2.8.2. Products
- 11.2.8.3. SWOT Analysis
- 11.2.8.4. Recent Developments
- 11.2.8.5. Financials (Based on Availability)
- 11.2.9 Apure Instruments
- 11.2.9.1. Overview
- 11.2.9.2. Products
- 11.2.9.3. SWOT Analysis
- 11.2.9.4. Recent Developments
- 11.2.9.5. Financials (Based on Availability)
- 11.2.10 KONGSBERG
- 11.2.10.1. Overview
- 11.2.10.2. Products
- 11.2.10.3. SWOT Analysis
- 11.2.10.4. Recent Developments
- 11.2.10.5. Financials (Based on Availability)
- 11.2.1 Pall Shop
List of Figures
- Figure 1: Global Oil In Water Monitoring Sensor Revenue Breakdown (undefined, %) by Region 2025 & 2033
- Figure 2: North America Oil In Water Monitoring Sensor Revenue (undefined), by Application 2025 & 2033
- Figure 3: North America Oil In Water Monitoring Sensor Revenue Share (%), by Application 2025 & 2033
- Figure 4: North America Oil In Water Monitoring Sensor Revenue (undefined), by Type 2025 & 2033
- Figure 5: North America Oil In Water Monitoring Sensor Revenue Share (%), by Type 2025 & 2033
- Figure 6: North America Oil In Water Monitoring Sensor Revenue (undefined), by Country 2025 & 2033
- Figure 7: North America Oil In Water Monitoring Sensor Revenue Share (%), by Country 2025 & 2033
- Figure 8: South America Oil In Water Monitoring Sensor Revenue (undefined), by Application 2025 & 2033
- Figure 9: South America Oil In Water Monitoring Sensor Revenue Share (%), by Application 2025 & 2033
- Figure 10: South America Oil In Water Monitoring Sensor Revenue (undefined), by Type 2025 & 2033
- Figure 11: South America Oil In Water Monitoring Sensor Revenue Share (%), by Type 2025 & 2033
- Figure 12: South America Oil In Water Monitoring Sensor Revenue (undefined), by Country 2025 & 2033
- Figure 13: South America Oil In Water Monitoring Sensor Revenue Share (%), by Country 2025 & 2033
- Figure 14: Europe Oil In Water Monitoring Sensor Revenue (undefined), by Application 2025 & 2033
- Figure 15: Europe Oil In Water Monitoring Sensor Revenue Share (%), by Application 2025 & 2033
- Figure 16: Europe Oil In Water Monitoring Sensor Revenue (undefined), by Type 2025 & 2033
- Figure 17: Europe Oil In Water Monitoring Sensor Revenue Share (%), by Type 2025 & 2033
- Figure 18: Europe Oil In Water Monitoring Sensor Revenue (undefined), by Country 2025 & 2033
- Figure 19: Europe Oil In Water Monitoring Sensor Revenue Share (%), by Country 2025 & 2033
- Figure 20: Middle East & Africa Oil In Water Monitoring Sensor Revenue (undefined), by Application 2025 & 2033
- Figure 21: Middle East & Africa Oil In Water Monitoring Sensor Revenue Share (%), by Application 2025 & 2033
- Figure 22: Middle East & Africa Oil In Water Monitoring Sensor Revenue (undefined), by Type 2025 & 2033
- Figure 23: Middle East & Africa Oil In Water Monitoring Sensor Revenue Share (%), by Type 2025 & 2033
- Figure 24: Middle East & Africa Oil In Water Monitoring Sensor Revenue (undefined), by Country 2025 & 2033
- Figure 25: Middle East & Africa Oil In Water Monitoring Sensor Revenue Share (%), by Country 2025 & 2033
- Figure 26: Asia Pacific Oil In Water Monitoring Sensor Revenue (undefined), by Application 2025 & 2033
- Figure 27: Asia Pacific Oil In Water Monitoring Sensor Revenue Share (%), by Application 2025 & 2033
- Figure 28: Asia Pacific Oil In Water Monitoring Sensor Revenue (undefined), by Type 2025 & 2033
- Figure 29: Asia Pacific Oil In Water Monitoring Sensor Revenue Share (%), by Type 2025 & 2033
- Figure 30: Asia Pacific Oil In Water Monitoring Sensor Revenue (undefined), by Country 2025 & 2033
- Figure 31: Asia Pacific Oil In Water Monitoring Sensor Revenue Share (%), by Country 2025 & 2033
List of Tables
- Table 1: Global Oil In Water Monitoring Sensor Revenue undefined Forecast, by Application 2020 & 2033
- Table 2: Global Oil In Water Monitoring Sensor Revenue undefined Forecast, by Type 2020 & 2033
- Table 3: Global Oil In Water Monitoring Sensor Revenue undefined Forecast, by Region 2020 & 2033
- Table 4: Global Oil In Water Monitoring Sensor Revenue undefined Forecast, by Application 2020 & 2033
- Table 5: Global Oil In Water Monitoring Sensor Revenue undefined Forecast, by Type 2020 & 2033
- Table 6: Global Oil In Water Monitoring Sensor Revenue undefined Forecast, by Country 2020 & 2033
- Table 7: United States Oil In Water Monitoring Sensor Revenue (undefined) Forecast, by Application 2020 & 2033
- Table 8: Canada Oil In Water Monitoring Sensor Revenue (undefined) Forecast, by Application 2020 & 2033
- Table 9: Mexico Oil In Water Monitoring Sensor Revenue (undefined) Forecast, by Application 2020 & 2033
- Table 10: Global Oil In Water Monitoring Sensor Revenue undefined Forecast, by Application 2020 & 2033
- Table 11: Global Oil In Water Monitoring Sensor Revenue undefined Forecast, by Type 2020 & 2033
- Table 12: Global Oil In Water Monitoring Sensor Revenue undefined Forecast, by Country 2020 & 2033
- Table 13: Brazil Oil In Water Monitoring Sensor Revenue (undefined) Forecast, by Application 2020 & 2033
- Table 14: Argentina Oil In Water Monitoring Sensor Revenue (undefined) Forecast, by Application 2020 & 2033
- Table 15: Rest of South America Oil In Water Monitoring Sensor Revenue (undefined) Forecast, by Application 2020 & 2033
- Table 16: Global Oil In Water Monitoring Sensor Revenue undefined Forecast, by Application 2020 & 2033
- Table 17: Global Oil In Water Monitoring Sensor Revenue undefined Forecast, by Type 2020 & 2033
- Table 18: Global Oil In Water Monitoring Sensor Revenue undefined Forecast, by Country 2020 & 2033
- Table 19: United Kingdom Oil In Water Monitoring Sensor Revenue (undefined) Forecast, by Application 2020 & 2033
- Table 20: Germany Oil In Water Monitoring Sensor Revenue (undefined) Forecast, by Application 2020 & 2033
- Table 21: France Oil In Water Monitoring Sensor Revenue (undefined) Forecast, by Application 2020 & 2033
- Table 22: Italy Oil In Water Monitoring Sensor Revenue (undefined) Forecast, by Application 2020 & 2033
- Table 23: Spain Oil In Water Monitoring Sensor Revenue (undefined) Forecast, by Application 2020 & 2033
- Table 24: Russia Oil In Water Monitoring Sensor Revenue (undefined) Forecast, by Application 2020 & 2033
- Table 25: Benelux Oil In Water Monitoring Sensor Revenue (undefined) Forecast, by Application 2020 & 2033
- Table 26: Nordics Oil In Water Monitoring Sensor Revenue (undefined) Forecast, by Application 2020 & 2033
- Table 27: Rest of Europe Oil In Water Monitoring Sensor Revenue (undefined) Forecast, by Application 2020 & 2033
- Table 28: Global Oil In Water Monitoring Sensor Revenue undefined Forecast, by Application 2020 & 2033
- Table 29: Global Oil In Water Monitoring Sensor Revenue undefined Forecast, by Type 2020 & 2033
- Table 30: Global Oil In Water Monitoring Sensor Revenue undefined Forecast, by Country 2020 & 2033
- Table 31: Turkey Oil In Water Monitoring Sensor Revenue (undefined) Forecast, by Application 2020 & 2033
- Table 32: Israel Oil In Water Monitoring Sensor Revenue (undefined) Forecast, by Application 2020 & 2033
- Table 33: GCC Oil In Water Monitoring Sensor Revenue (undefined) Forecast, by Application 2020 & 2033
- Table 34: North Africa Oil In Water Monitoring Sensor Revenue (undefined) Forecast, by Application 2020 & 2033
- Table 35: South Africa Oil In Water Monitoring Sensor Revenue (undefined) Forecast, by Application 2020 & 2033
- Table 36: Rest of Middle East & Africa Oil In Water Monitoring Sensor Revenue (undefined) Forecast, by Application 2020 & 2033
- Table 37: Global Oil In Water Monitoring Sensor Revenue undefined Forecast, by Application 2020 & 2033
- Table 38: Global Oil In Water Monitoring Sensor Revenue undefined Forecast, by Type 2020 & 2033
- Table 39: Global Oil In Water Monitoring Sensor Revenue undefined Forecast, by Country 2020 & 2033
- Table 40: China Oil In Water Monitoring Sensor Revenue (undefined) Forecast, by Application 2020 & 2033
- Table 41: India Oil In Water Monitoring Sensor Revenue (undefined) Forecast, by Application 2020 & 2033
- Table 42: Japan Oil In Water Monitoring Sensor Revenue (undefined) Forecast, by Application 2020 & 2033
- Table 43: South Korea Oil In Water Monitoring Sensor Revenue (undefined) Forecast, by Application 2020 & 2033
- Table 44: ASEAN Oil In Water Monitoring Sensor Revenue (undefined) Forecast, by Application 2020 & 2033
- Table 45: Oceania Oil In Water Monitoring Sensor Revenue (undefined) Forecast, by Application 2020 & 2033
- Table 46: Rest of Asia Pacific Oil In Water Monitoring Sensor Revenue (undefined) Forecast, by Application 2020 & 2033
Frequently Asked Questions
1. What is the projected Compound Annual Growth Rate (CAGR) of the Oil In Water Monitoring Sensor?
The projected CAGR is approximately 12.3%.
2. Which companies are prominent players in the Oil In Water Monitoring Sensor?
Key companies in the market include Pall Shop, Hach India, Advanced Sensors, Electro-Chemical Devices, Envitech Ltd, Pyxis Lab, Brix Engg, GO-Systemelektronik GmbH, Apure Instruments, KONGSBERG.
3. What are the main segments of the Oil In Water Monitoring Sensor?
The market segments include Application, Type.
4. Can you provide details about the market size?
The market size is estimated to be USD XXX N/A as of 2022.
5. What are some drivers contributing to market growth?
N/A
6. What are the notable trends driving market growth?
N/A
7. Are there any restraints impacting market growth?
N/A
8. Can you provide examples of recent developments in the market?
N/A
9. What pricing options are available for accessing the report?
Pricing options include single-user, multi-user, and enterprise licenses priced at USD 2900.00, USD 4350.00, and USD 5800.00 respectively.
10. Is the market size provided in terms of value or volume?
The market size is provided in terms of value, measured in N/A.
11. Are there any specific market keywords associated with the report?
Yes, the market keyword associated with the report is "Oil In Water Monitoring Sensor," which aids in identifying and referencing the specific market segment covered.
12. How do I determine which pricing option suits my needs best?
The pricing options vary based on user requirements and access needs. Individual users may opt for single-user licenses, while businesses requiring broader access may choose multi-user or enterprise licenses for cost-effective access to the report.
13. Are there any additional resources or data provided in the Oil In Water Monitoring Sensor report?
While the report offers comprehensive insights, it's advisable to review the specific contents or supplementary materials provided to ascertain if additional resources or data are available.
14. How can I stay updated on further developments or reports in the Oil In Water Monitoring Sensor?
To stay informed about further developments, trends, and reports in the Oil In Water Monitoring Sensor, consider subscribing to industry newsletters, following relevant companies and organizations, or regularly checking reputable industry news sources and publications.
Methodology
Step 1 - Identification of Relevant Samples Size from Population Database


Step 2 - Approaches for Defining Global Market Size (Value, Volume* & Price*)

Note*: In applicable scenarios
Step 3 - Data Sources
Primary Research
- Web Analytics
- Survey Reports
- Research Institute
- Latest Research Reports
- Opinion Leaders
Secondary Research
- Annual Reports
- White Paper
- Latest Press Release
- Industry Association
- Paid Database
- Investor Presentations

Step 4 - Data Triangulation
Involves using different sources of information in order to increase the validity of a study
These sources are likely to be stakeholders in a program - participants, other researchers, program staff, other community members, and so on.
Then we put all data in single framework & apply various statistical tools to find out the dynamic on the market.
During the analysis stage, feedback from the stakeholder groups would be compared to determine areas of agreement as well as areas of divergence