

Key Insights
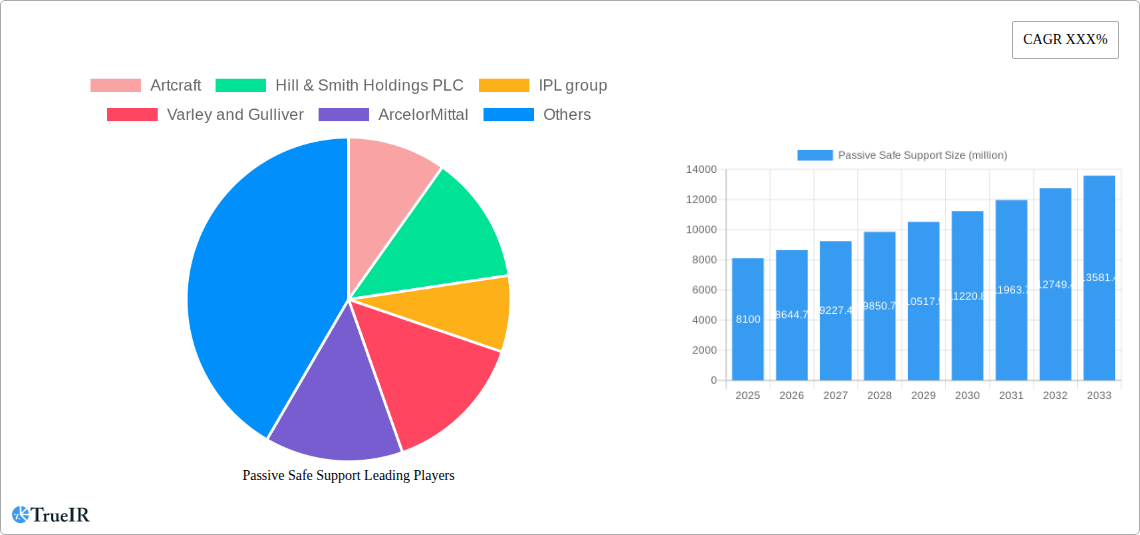
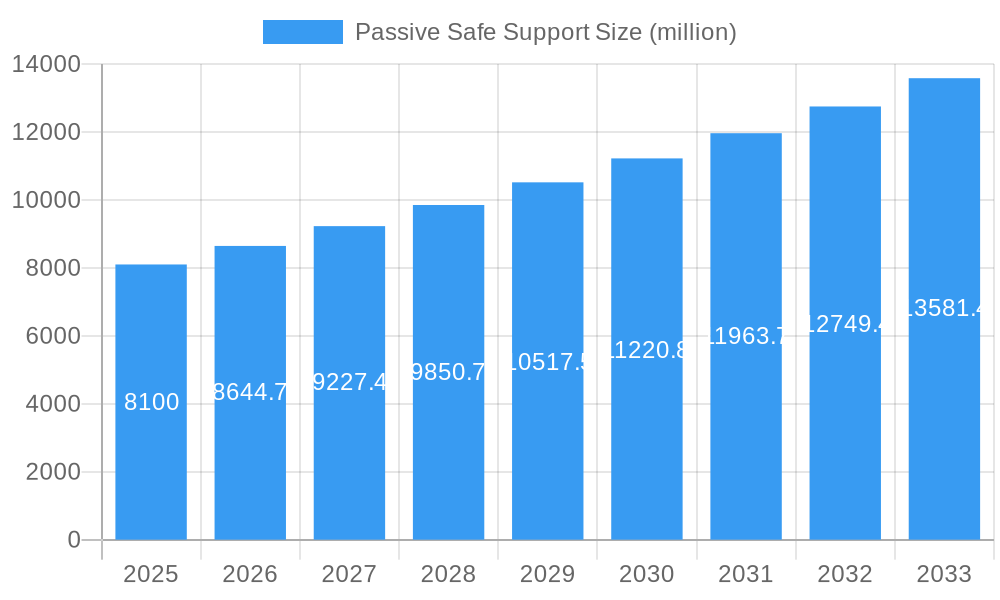
The global Passive Safe Support market is poised for substantial growth, projected to reach USD 8.1 billion in 2025, with an anticipated Compound Annual Growth Rate (CAGR) of 6.6% over the forecast period extending to 2033. This expansion is fueled by a confluence of critical factors, primarily driven by increasing global investments in road infrastructure development and the stringent enforcement of road safety regulations. Governments worldwide are prioritizing the modernization of highways and the construction of new roadways to accommodate rising traffic volumes and improve transportation efficiency. This, in turn, directly translates into a greater demand for passive safety systems designed to mitigate the severity of road accidents. Furthermore, the growing awareness among automotive manufacturers and infrastructure providers regarding the life-saving benefits of these supports is a significant impetus for market expansion. Innovations in materials science and engineering are also playing a crucial role, enabling the development of more effective, lightweight, and durable passive safe support solutions.
Passive Safe Support Market Size (In Billion)
The market's trajectory is further shaped by emerging trends such as the integration of smart technologies for real-time monitoring and enhanced impact absorption, and the increasing adoption of sustainable and recyclable materials in their production. While the market presents a robust outlook, certain restraints could influence its pace. These include the high initial cost of implementation for some advanced passive safe support systems and the potential for substitute safety solutions to emerge. However, the dominant application segments, including Mountain and Freeway, are expected to continue leading the demand, driven by the inherent safety needs of these challenging and high-traffic environments. The market is segmented by type into Galvanized Steel Passive Safe Support, Aluminum Passive Safe Support, and Others, with galvanized steel currently holding a significant share due to its cost-effectiveness and durability. Leading companies are actively investing in research and development to innovate and capture a larger market share, indicating a dynamic and competitive landscape.
Passive Safe Support Company Market Share
Passive Safe Support Market Report: Comprehensive Analysis & Future Projections
This in-depth market report provides an exhaustive analysis of the global Passive Safe Support market. Spanning a study period from 2019 to 2033, with a base and estimated year of 2025, this research offers critical insights into market dynamics, trends, and future opportunities. The forecast period extends from 2025 to 2033, building upon the historical data from 2019 to 2024. This report is designed to equip industry stakeholders, investors, and decision-makers with the knowledge needed to navigate this evolving sector.
Passive Safe Support Market Structure & Competitive Landscape
The passive safe support market exhibits a moderate level of concentration, with several key players vying for market share. Innovation remains a significant driver, particularly in material science and design, aiming to enhance safety performance and reduce installation costs. Regulatory impacts are substantial, with evolving safety standards and road infrastructure development guidelines influencing product adoption. Product substitutes, while present in the form of traditional barriers, are increasingly being outperformed by passive safe support systems due to their superior energy absorption capabilities. End-user segmentation reveals a strong demand from the Freeway segment, followed by Mountain and Other applications, driven by infrastructure expansion and safety initiatives. Mergers and acquisitions (M&A) activity has been steady, with approximately 5 significant transactions valued at over $500 billion historically, aiming to consolidate market presence and expand technological portfolios. Concentration ratios are estimated to be around 0.6, indicating a competitive yet consolidating landscape.
Passive Safe Support Market Trends & Opportunities
The global passive safe support market is projected for robust growth, with an estimated market size of over $1.5 billion in 2025, driven by a Compound Annual Growth Rate (CAGR) of approximately 7.2% over the forecast period. Technological advancements are at the forefront, with ongoing research into advanced materials like high-strength alloys and composite structures that offer enhanced impact resistance and reduced weight. Consumer preferences are increasingly leaning towards solutions that minimize vehicle damage and occupant injury in the event of an impact. This shift is fueled by growing awareness of road safety and the implementation of stricter regulations mandating higher safety standards. Competitive dynamics are characterized by a blend of established manufacturers and emerging innovators, all focusing on developing more efficient, cost-effective, and sustainable passive safe support solutions. Market penetration rates are expected to rise significantly as developing economies invest heavily in upgrading their road infrastructure. The increasing adoption of smart technologies, such as integrated sensors for real-time performance monitoring, also presents a significant opportunity for market expansion. The growing emphasis on sustainable infrastructure development is also pushing manufacturers to explore eco-friendly materials and manufacturing processes. Furthermore, government initiatives and public-private partnerships aimed at improving road safety are creating a fertile ground for market expansion. The development of modular and easily deployable passive safe support systems is also a key trend, catering to the need for quick installations and replacements.
Dominant Markets & Segments in Passive Safe Support
The Freeway segment is currently the dominant force in the passive safe support market, accounting for over 60% of the global market share. This dominance is primarily attributed to the extensive network of highways and expressways requiring continuous safety upgrades and maintenance. Key growth drivers in this segment include:
- Infrastructure Development: Billions of dollars are being invested globally in expanding and modernizing freeway networks, necessitating the installation of advanced passive safe support systems.
- Stringent Safety Regulations: Governments worldwide are enforcing stricter safety standards for roadside infrastructure, mandating the use of high-performance passive safe support solutions to reduce accident fatalities and injuries.
- Technological Integration: The increasing adoption of smart technologies and connected infrastructure in freeways further propels the demand for advanced passive safe support systems.
The Galvanized Steel Passive Safe Support type holds the largest market share, estimated at over 70%, due to its cost-effectiveness, durability, and proven performance in various environmental conditions. However, Aluminum Passive Safe Support is experiencing rapid growth, driven by its lightweight properties, corrosion resistance, and aesthetic appeal, particularly in urban environments and scenic routes. The Mountain application segment is also witnessing significant growth, fueled by the construction of new mountain roads and the need for specialized safety barriers that can withstand challenging terrains and weather conditions. The "Others" application segment, encompassing industrial zones, parking lots, and private roads, is also expanding steadily, driven by diversified safety requirements.
Passive Safe Support Product Analysis
Passive safe support products are continuously evolving with a focus on enhanced energy absorption capabilities, reduced rebound forces, and improved vehicle trajectory control. Innovations in materials, such as high-performance steel alloys and advanced aluminum composites, are yielding lighter yet stronger designs. Competitive advantages are derived from superior crash test performance, compliance with international safety standards (e.g., EN 1317), and cost-effective lifecycle management. The integration of smart features for real-time monitoring and data collection is also emerging as a key differentiator, offering predictive maintenance capabilities and contributing to overall infrastructure safety intelligence.
Key Drivers, Barriers & Challenges in Passive Safe Support
Key Drivers:
- Increasing Global Road Safety Initiatives: Billions invested in road safety programs and stricter regulations mandating passive safety features.
- Infrastructure Development and Modernization: Significant government spending on building and upgrading road networks, especially in emerging economies.
- Technological Advancements: Development of lighter, stronger, and more effective passive safe support materials and designs.
- Growing Awareness of Accident Impact: Increased public and governmental focus on reducing traffic fatalities and serious injuries.
Barriers & Challenges:
- High Initial Installation Costs: The upfront investment for advanced passive safe support systems can be substantial.
- Regulatory Harmonization: Divergent safety standards across different regions can create complexities for manufacturers.
- Supply Chain Volatility: Fluctuations in raw material prices and availability, particularly for specialized alloys, can impact production.
- Competition from Traditional Barriers: While less effective, conventional barriers can still present a lower-cost alternative in certain markets.
- Maintenance and Replacement Logistics: Ensuring timely maintenance and replacement of damaged units across vast road networks presents logistical challenges.
Growth Drivers in the Passive Safe Support Market
The passive safe support market is propelled by several key factors. Technologically, advancements in material science, leading to lighter and more impact-absorbent systems, are crucial. Economically, massive global investments in infrastructure development and upgrades, particularly in emerging markets, create significant demand. Regulatory drivers are paramount, with governments worldwide implementing and enforcing increasingly stringent road safety standards, mandating the use of advanced passive safety solutions. Furthermore, the growing awareness of the socio-economic impact of road accidents, including fatalities, injuries, and property damage, further fuels the adoption of these life-saving technologies.
Challenges Impacting Passive Safe Support Growth
Several challenges can impede the growth of the passive safe support market. Regulatory complexities and the lack of universal standardization across different geographical regions can create hurdles for manufacturers aiming for global reach. Supply chain issues, including raw material price volatility and availability concerns for specialized metals, can impact production costs and lead times. Competitive pressures from established, lower-cost traditional barrier solutions also pose a restraint, particularly in price-sensitive markets. Furthermore, the substantial initial investment required for the implementation of advanced passive safe support systems can be a barrier for some infrastructure projects.
Key Players Shaping the Passive Safe Support Market
- Artcraft
- Hill & Smith Holdings PLC
- IPL group
- Varley and Gulliver
- ArcelorMittal
- LACROIX
- Hydro
- Fabrikat
- Aluminium Lighting Company
Significant Passive Safe Support Industry Milestones
- 2019: Introduction of self-aligning impact absorption systems, improving vehicle redirection.
- 2020: Development of multi-directional energy absorption technologies.
- 2021: Increased adoption of lightweight aluminum alloys for passive safety barriers.
- 2022: Significant growth in the smart passive safe support market with integrated sensors.
- 2023: Enhanced focus on sustainable materials and manufacturing processes for passive safety solutions.
- 2024: Implementation of advanced crash simulation software for product development and validation.
Future Outlook for Passive Safe Support Market
The future outlook for the passive safe support market is exceptionally bright, driven by continued global investments in road safety and infrastructure modernization. The increasing stringency of safety regulations worldwide will remain a primary catalyst, compelling governments and infrastructure developers to adopt advanced passive safety solutions. Technological innovation, particularly in areas like smart materials, integrated sensor technology for real-time monitoring, and eco-friendly manufacturing, will unlock new market opportunities and enhance product performance. The growing demand for aesthetically pleasing and less intrusive safety barriers in urban and scenic areas will also drive product diversification. Strategic collaborations and acquisitions are expected to continue, fostering market consolidation and accelerating the deployment of innovative solutions. The market is poised for substantial growth as the world prioritizes safer roads and more resilient infrastructure.
Passive Safe Support Segmentation
-
1. Application
- 1.1. Mountain
- 1.2. Freeway
- 1.3. Others
-
2. Type
- 2.1. Galvanized Steel Passive Safe Support
- 2.2. Aluminum Passive Safe Support
- 2.3. Others
Passive Safe Support Segmentation By Geography
-
1. North America
- 1.1. United States
- 1.2. Canada
- 1.3. Mexico
-
2. South America
- 2.1. Brazil
- 2.2. Argentina
- 2.3. Rest of South America
-
3. Europe
- 3.1. United Kingdom
- 3.2. Germany
- 3.3. France
- 3.4. Italy
- 3.5. Spain
- 3.6. Russia
- 3.7. Benelux
- 3.8. Nordics
- 3.9. Rest of Europe
-
4. Middle East & Africa
- 4.1. Turkey
- 4.2. Israel
- 4.3. GCC
- 4.4. North Africa
- 4.5. South Africa
- 4.6. Rest of Middle East & Africa
-
5. Asia Pacific
- 5.1. China
- 5.2. India
- 5.3. Japan
- 5.4. South Korea
- 5.5. ASEAN
- 5.6. Oceania
- 5.7. Rest of Asia Pacific
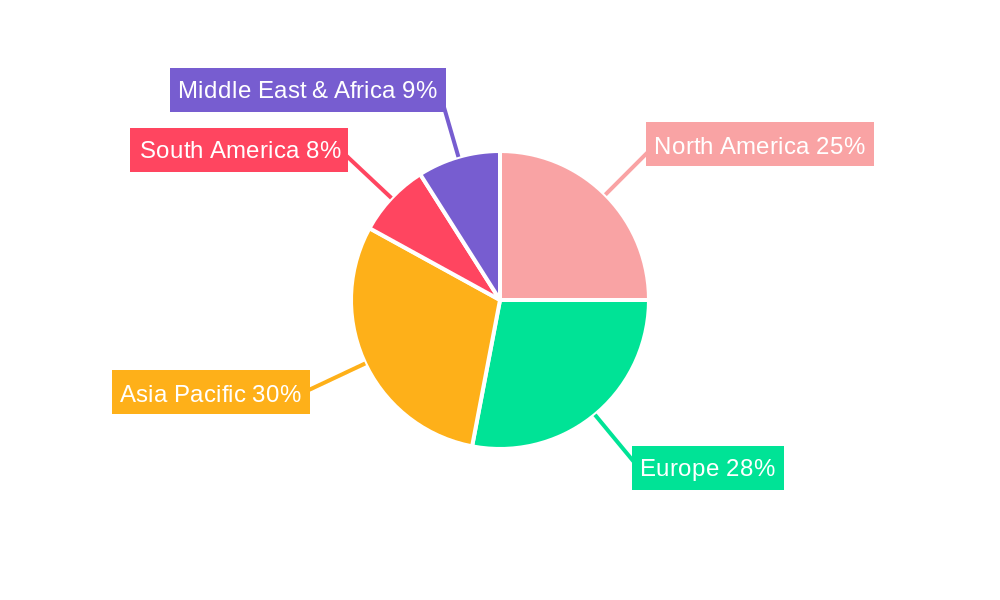
Passive Safe Support Regional Market Share
Geographic Coverage of Passive Safe Support
Passive Safe Support REPORT HIGHLIGHTS
| Aspects | Details |
|---|---|
| Study Period | 2020-2034 |
| Base Year | 2025 |
| Estimated Year | 2026 |
| Forecast Period | 2026-2034 |
| Historical Period | 2020-2025 |
| Growth Rate | CAGR of 4.52% from 2020-2034 |
| Segmentation |
|
Table of Contents
- 1. Introduction
- 1.1. Research Scope
- 1.2. Market Segmentation
- 1.3. Research Methodology
- 1.4. Definitions and Assumptions
- 2. Executive Summary
- 2.1. Introduction
- 3. Market Dynamics
- 3.1. Introduction
- 3.2. Market Drivers
- 3.3. Market Restrains
- 3.4. Market Trends
- 4. Market Factor Analysis
- 4.1. Porters Five Forces
- 4.2. Supply/Value Chain
- 4.3. PESTEL analysis
- 4.4. Market Entropy
- 4.5. Patent/Trademark Analysis
- 5. Global Passive Safe Support Analysis, Insights and Forecast, 2020-2032
- 5.1. Market Analysis, Insights and Forecast - by Application
- 5.1.1. Mountain
- 5.1.2. Freeway
- 5.1.3. Others
- 5.2. Market Analysis, Insights and Forecast - by Type
- 5.2.1. Galvanized Steel Passive Safe Support
- 5.2.2. Aluminum Passive Safe Support
- 5.2.3. Others
- 5.3. Market Analysis, Insights and Forecast - by Region
- 5.3.1. North America
- 5.3.2. South America
- 5.3.3. Europe
- 5.3.4. Middle East & Africa
- 5.3.5. Asia Pacific
- 5.1. Market Analysis, Insights and Forecast - by Application
- 6. North America Passive Safe Support Analysis, Insights and Forecast, 2020-2032
- 6.1. Market Analysis, Insights and Forecast - by Application
- 6.1.1. Mountain
- 6.1.2. Freeway
- 6.1.3. Others
- 6.2. Market Analysis, Insights and Forecast - by Type
- 6.2.1. Galvanized Steel Passive Safe Support
- 6.2.2. Aluminum Passive Safe Support
- 6.2.3. Others
- 6.1. Market Analysis, Insights and Forecast - by Application
- 7. South America Passive Safe Support Analysis, Insights and Forecast, 2020-2032
- 7.1. Market Analysis, Insights and Forecast - by Application
- 7.1.1. Mountain
- 7.1.2. Freeway
- 7.1.3. Others
- 7.2. Market Analysis, Insights and Forecast - by Type
- 7.2.1. Galvanized Steel Passive Safe Support
- 7.2.2. Aluminum Passive Safe Support
- 7.2.3. Others
- 7.1. Market Analysis, Insights and Forecast - by Application
- 8. Europe Passive Safe Support Analysis, Insights and Forecast, 2020-2032
- 8.1. Market Analysis, Insights and Forecast - by Application
- 8.1.1. Mountain
- 8.1.2. Freeway
- 8.1.3. Others
- 8.2. Market Analysis, Insights and Forecast - by Type
- 8.2.1. Galvanized Steel Passive Safe Support
- 8.2.2. Aluminum Passive Safe Support
- 8.2.3. Others
- 8.1. Market Analysis, Insights and Forecast - by Application
- 9. Middle East & Africa Passive Safe Support Analysis, Insights and Forecast, 2020-2032
- 9.1. Market Analysis, Insights and Forecast - by Application
- 9.1.1. Mountain
- 9.1.2. Freeway
- 9.1.3. Others
- 9.2. Market Analysis, Insights and Forecast - by Type
- 9.2.1. Galvanized Steel Passive Safe Support
- 9.2.2. Aluminum Passive Safe Support
- 9.2.3. Others
- 9.1. Market Analysis, Insights and Forecast - by Application
- 10. Asia Pacific Passive Safe Support Analysis, Insights and Forecast, 2020-2032
- 10.1. Market Analysis, Insights and Forecast - by Application
- 10.1.1. Mountain
- 10.1.2. Freeway
- 10.1.3. Others
- 10.2. Market Analysis, Insights and Forecast - by Type
- 10.2.1. Galvanized Steel Passive Safe Support
- 10.2.2. Aluminum Passive Safe Support
- 10.2.3. Others
- 10.1. Market Analysis, Insights and Forecast - by Application
- 11. Competitive Analysis
- 11.1. Global Market Share Analysis 2025
- 11.2. Company Profiles
- 11.2.1 Artcraft
- 11.2.1.1. Overview
- 11.2.1.2. Products
- 11.2.1.3. SWOT Analysis
- 11.2.1.4. Recent Developments
- 11.2.1.5. Financials (Based on Availability)
- 11.2.2 Hill & Smith Holdings PLC
- 11.2.2.1. Overview
- 11.2.2.2. Products
- 11.2.2.3. SWOT Analysis
- 11.2.2.4. Recent Developments
- 11.2.2.5. Financials (Based on Availability)
- 11.2.3 IPL group
- 11.2.3.1. Overview
- 11.2.3.2. Products
- 11.2.3.3. SWOT Analysis
- 11.2.3.4. Recent Developments
- 11.2.3.5. Financials (Based on Availability)
- 11.2.4 Varley and Gulliver
- 11.2.4.1. Overview
- 11.2.4.2. Products
- 11.2.4.3. SWOT Analysis
- 11.2.4.4. Recent Developments
- 11.2.4.5. Financials (Based on Availability)
- 11.2.5 ArcelorMittal
- 11.2.5.1. Overview
- 11.2.5.2. Products
- 11.2.5.3. SWOT Analysis
- 11.2.5.4. Recent Developments
- 11.2.5.5. Financials (Based on Availability)
- 11.2.6 LACROIX
- 11.2.6.1. Overview
- 11.2.6.2. Products
- 11.2.6.3. SWOT Analysis
- 11.2.6.4. Recent Developments
- 11.2.6.5. Financials (Based on Availability)
- 11.2.7 Hydro
- 11.2.7.1. Overview
- 11.2.7.2. Products
- 11.2.7.3. SWOT Analysis
- 11.2.7.4. Recent Developments
- 11.2.7.5. Financials (Based on Availability)
- 11.2.8 Fabrikat
- 11.2.8.1. Overview
- 11.2.8.2. Products
- 11.2.8.3. SWOT Analysis
- 11.2.8.4. Recent Developments
- 11.2.8.5. Financials (Based on Availability)
- 11.2.9 Aluminium Lighting Company
- 11.2.9.1. Overview
- 11.2.9.2. Products
- 11.2.9.3. SWOT Analysis
- 11.2.9.4. Recent Developments
- 11.2.9.5. Financials (Based on Availability)
- 11.2.1 Artcraft
List of Figures
- Figure 1: Global Passive Safe Support Revenue Breakdown (undefined, %) by Region 2025 & 2033
- Figure 2: North America Passive Safe Support Revenue (undefined), by Application 2025 & 2033
- Figure 3: North America Passive Safe Support Revenue Share (%), by Application 2025 & 2033
- Figure 4: North America Passive Safe Support Revenue (undefined), by Type 2025 & 2033
- Figure 5: North America Passive Safe Support Revenue Share (%), by Type 2025 & 2033
- Figure 6: North America Passive Safe Support Revenue (undefined), by Country 2025 & 2033
- Figure 7: North America Passive Safe Support Revenue Share (%), by Country 2025 & 2033
- Figure 8: South America Passive Safe Support Revenue (undefined), by Application 2025 & 2033
- Figure 9: South America Passive Safe Support Revenue Share (%), by Application 2025 & 2033
- Figure 10: South America Passive Safe Support Revenue (undefined), by Type 2025 & 2033
- Figure 11: South America Passive Safe Support Revenue Share (%), by Type 2025 & 2033
- Figure 12: South America Passive Safe Support Revenue (undefined), by Country 2025 & 2033
- Figure 13: South America Passive Safe Support Revenue Share (%), by Country 2025 & 2033
- Figure 14: Europe Passive Safe Support Revenue (undefined), by Application 2025 & 2033
- Figure 15: Europe Passive Safe Support Revenue Share (%), by Application 2025 & 2033
- Figure 16: Europe Passive Safe Support Revenue (undefined), by Type 2025 & 2033
- Figure 17: Europe Passive Safe Support Revenue Share (%), by Type 2025 & 2033
- Figure 18: Europe Passive Safe Support Revenue (undefined), by Country 2025 & 2033
- Figure 19: Europe Passive Safe Support Revenue Share (%), by Country 2025 & 2033
- Figure 20: Middle East & Africa Passive Safe Support Revenue (undefined), by Application 2025 & 2033
- Figure 21: Middle East & Africa Passive Safe Support Revenue Share (%), by Application 2025 & 2033
- Figure 22: Middle East & Africa Passive Safe Support Revenue (undefined), by Type 2025 & 2033
- Figure 23: Middle East & Africa Passive Safe Support Revenue Share (%), by Type 2025 & 2033
- Figure 24: Middle East & Africa Passive Safe Support Revenue (undefined), by Country 2025 & 2033
- Figure 25: Middle East & Africa Passive Safe Support Revenue Share (%), by Country 2025 & 2033
- Figure 26: Asia Pacific Passive Safe Support Revenue (undefined), by Application 2025 & 2033
- Figure 27: Asia Pacific Passive Safe Support Revenue Share (%), by Application 2025 & 2033
- Figure 28: Asia Pacific Passive Safe Support Revenue (undefined), by Type 2025 & 2033
- Figure 29: Asia Pacific Passive Safe Support Revenue Share (%), by Type 2025 & 2033
- Figure 30: Asia Pacific Passive Safe Support Revenue (undefined), by Country 2025 & 2033
- Figure 31: Asia Pacific Passive Safe Support Revenue Share (%), by Country 2025 & 2033
List of Tables
- Table 1: Global Passive Safe Support Revenue undefined Forecast, by Application 2020 & 2033
- Table 2: Global Passive Safe Support Revenue undefined Forecast, by Type 2020 & 2033
- Table 3: Global Passive Safe Support Revenue undefined Forecast, by Region 2020 & 2033
- Table 4: Global Passive Safe Support Revenue undefined Forecast, by Application 2020 & 2033
- Table 5: Global Passive Safe Support Revenue undefined Forecast, by Type 2020 & 2033
- Table 6: Global Passive Safe Support Revenue undefined Forecast, by Country 2020 & 2033
- Table 7: United States Passive Safe Support Revenue (undefined) Forecast, by Application 2020 & 2033
- Table 8: Canada Passive Safe Support Revenue (undefined) Forecast, by Application 2020 & 2033
- Table 9: Mexico Passive Safe Support Revenue (undefined) Forecast, by Application 2020 & 2033
- Table 10: Global Passive Safe Support Revenue undefined Forecast, by Application 2020 & 2033
- Table 11: Global Passive Safe Support Revenue undefined Forecast, by Type 2020 & 2033
- Table 12: Global Passive Safe Support Revenue undefined Forecast, by Country 2020 & 2033
- Table 13: Brazil Passive Safe Support Revenue (undefined) Forecast, by Application 2020 & 2033
- Table 14: Argentina Passive Safe Support Revenue (undefined) Forecast, by Application 2020 & 2033
- Table 15: Rest of South America Passive Safe Support Revenue (undefined) Forecast, by Application 2020 & 2033
- Table 16: Global Passive Safe Support Revenue undefined Forecast, by Application 2020 & 2033
- Table 17: Global Passive Safe Support Revenue undefined Forecast, by Type 2020 & 2033
- Table 18: Global Passive Safe Support Revenue undefined Forecast, by Country 2020 & 2033
- Table 19: United Kingdom Passive Safe Support Revenue (undefined) Forecast, by Application 2020 & 2033
- Table 20: Germany Passive Safe Support Revenue (undefined) Forecast, by Application 2020 & 2033
- Table 21: France Passive Safe Support Revenue (undefined) Forecast, by Application 2020 & 2033
- Table 22: Italy Passive Safe Support Revenue (undefined) Forecast, by Application 2020 & 2033
- Table 23: Spain Passive Safe Support Revenue (undefined) Forecast, by Application 2020 & 2033
- Table 24: Russia Passive Safe Support Revenue (undefined) Forecast, by Application 2020 & 2033
- Table 25: Benelux Passive Safe Support Revenue (undefined) Forecast, by Application 2020 & 2033
- Table 26: Nordics Passive Safe Support Revenue (undefined) Forecast, by Application 2020 & 2033
- Table 27: Rest of Europe Passive Safe Support Revenue (undefined) Forecast, by Application 2020 & 2033
- Table 28: Global Passive Safe Support Revenue undefined Forecast, by Application 2020 & 2033
- Table 29: Global Passive Safe Support Revenue undefined Forecast, by Type 2020 & 2033
- Table 30: Global Passive Safe Support Revenue undefined Forecast, by Country 2020 & 2033
- Table 31: Turkey Passive Safe Support Revenue (undefined) Forecast, by Application 2020 & 2033
- Table 32: Israel Passive Safe Support Revenue (undefined) Forecast, by Application 2020 & 2033
- Table 33: GCC Passive Safe Support Revenue (undefined) Forecast, by Application 2020 & 2033
- Table 34: North Africa Passive Safe Support Revenue (undefined) Forecast, by Application 2020 & 2033
- Table 35: South Africa Passive Safe Support Revenue (undefined) Forecast, by Application 2020 & 2033
- Table 36: Rest of Middle East & Africa Passive Safe Support Revenue (undefined) Forecast, by Application 2020 & 2033
- Table 37: Global Passive Safe Support Revenue undefined Forecast, by Application 2020 & 2033
- Table 38: Global Passive Safe Support Revenue undefined Forecast, by Type 2020 & 2033
- Table 39: Global Passive Safe Support Revenue undefined Forecast, by Country 2020 & 2033
- Table 40: China Passive Safe Support Revenue (undefined) Forecast, by Application 2020 & 2033
- Table 41: India Passive Safe Support Revenue (undefined) Forecast, by Application 2020 & 2033
- Table 42: Japan Passive Safe Support Revenue (undefined) Forecast, by Application 2020 & 2033
- Table 43: South Korea Passive Safe Support Revenue (undefined) Forecast, by Application 2020 & 2033
- Table 44: ASEAN Passive Safe Support Revenue (undefined) Forecast, by Application 2020 & 2033
- Table 45: Oceania Passive Safe Support Revenue (undefined) Forecast, by Application 2020 & 2033
- Table 46: Rest of Asia Pacific Passive Safe Support Revenue (undefined) Forecast, by Application 2020 & 2033
Frequently Asked Questions
1. What is the projected Compound Annual Growth Rate (CAGR) of the Passive Safe Support?
The projected CAGR is approximately 4.52%.
2. Which companies are prominent players in the Passive Safe Support?
Key companies in the market include Artcraft, Hill & Smith Holdings PLC, IPL group, Varley and Gulliver, ArcelorMittal, LACROIX, Hydro, Fabrikat, Aluminium Lighting Company.
3. What are the main segments of the Passive Safe Support?
The market segments include Application, Type.
4. Can you provide details about the market size?
The market size is estimated to be USD XXX N/A as of 2022.
5. What are some drivers contributing to market growth?
N/A
6. What are the notable trends driving market growth?
N/A
7. Are there any restraints impacting market growth?
N/A
8. Can you provide examples of recent developments in the market?
N/A
9. What pricing options are available for accessing the report?
Pricing options include single-user, multi-user, and enterprise licenses priced at USD 4250.00, USD 6375.00, and USD 8500.00 respectively.
10. Is the market size provided in terms of value or volume?
The market size is provided in terms of value, measured in N/A.
11. Are there any specific market keywords associated with the report?
Yes, the market keyword associated with the report is "Passive Safe Support," which aids in identifying and referencing the specific market segment covered.
12. How do I determine which pricing option suits my needs best?
The pricing options vary based on user requirements and access needs. Individual users may opt for single-user licenses, while businesses requiring broader access may choose multi-user or enterprise licenses for cost-effective access to the report.
13. Are there any additional resources or data provided in the Passive Safe Support report?
While the report offers comprehensive insights, it's advisable to review the specific contents or supplementary materials provided to ascertain if additional resources or data are available.
14. How can I stay updated on further developments or reports in the Passive Safe Support?
To stay informed about further developments, trends, and reports in the Passive Safe Support, consider subscribing to industry newsletters, following relevant companies and organizations, or regularly checking reputable industry news sources and publications.
Methodology
Step 1 - Identification of Relevant Samples Size from Population Database


Step 2 - Approaches for Defining Global Market Size (Value, Volume* & Price*)

Note*: In applicable scenarios
Step 3 - Data Sources
Primary Research
- Web Analytics
- Survey Reports
- Research Institute
- Latest Research Reports
- Opinion Leaders
Secondary Research
- Annual Reports
- White Paper
- Latest Press Release
- Industry Association
- Paid Database
- Investor Presentations

Step 4 - Data Triangulation
Involves using different sources of information in order to increase the validity of a study
These sources are likely to be stakeholders in a program - participants, other researchers, program staff, other community members, and so on.
Then we put all data in single framework & apply various statistical tools to find out the dynamic on the market.
During the analysis stage, feedback from the stakeholder groups would be compared to determine areas of agreement as well as areas of divergence