

Key Insights
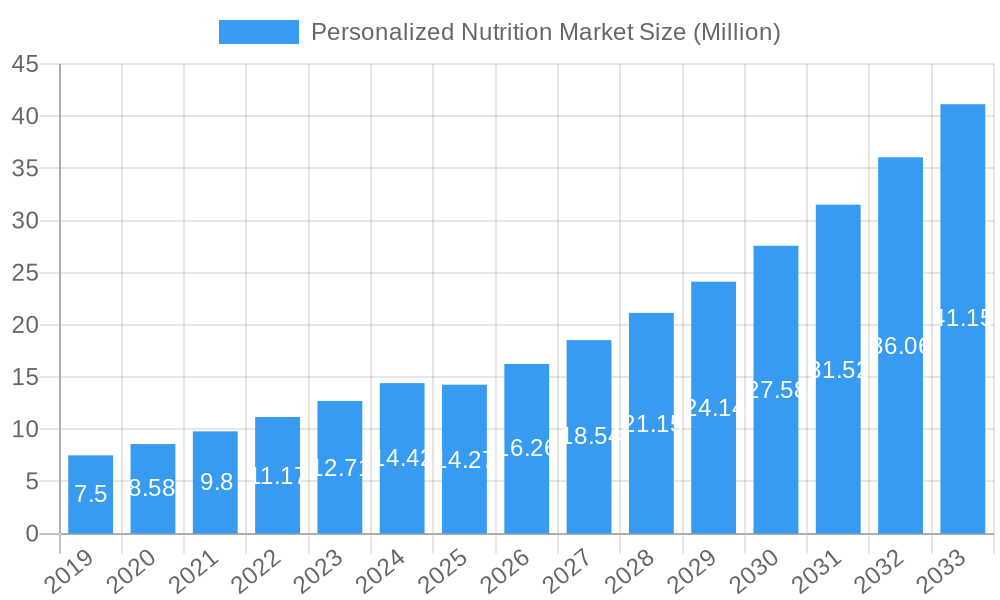
The Personalized Nutrition Market is poised for substantial expansion, projected to reach a market size of $14.27 billion by 2025. This growth is fueled by an impressive Compound Annual Growth Rate (CAGR) of 14.34% from 2019 to 2033, indicating a robust and sustained upward trajectory. Key drivers of this market include a growing consumer awareness regarding the intricate link between diet and overall well-being, coupled with the increasing prevalence of lifestyle-related diseases and a proactive approach towards preventative healthcare. The demand for tailored dietary recommendations, driven by advancements in genetic testing, microbiome analysis, and wearable technology, is fundamentally reshaping how individuals approach their nutritional intake. Furthermore, the burgeoning direct-to-consumer segment, along with the integration of personalized nutrition into wellness programs at fitness centers, highlights a significant shift towards individual empowerment in health management. The market’s evolution is also influenced by sophisticated data analytics that allow for highly individualized dietary interventions, moving beyond one-size-all approaches to address specific health goals and conditions.
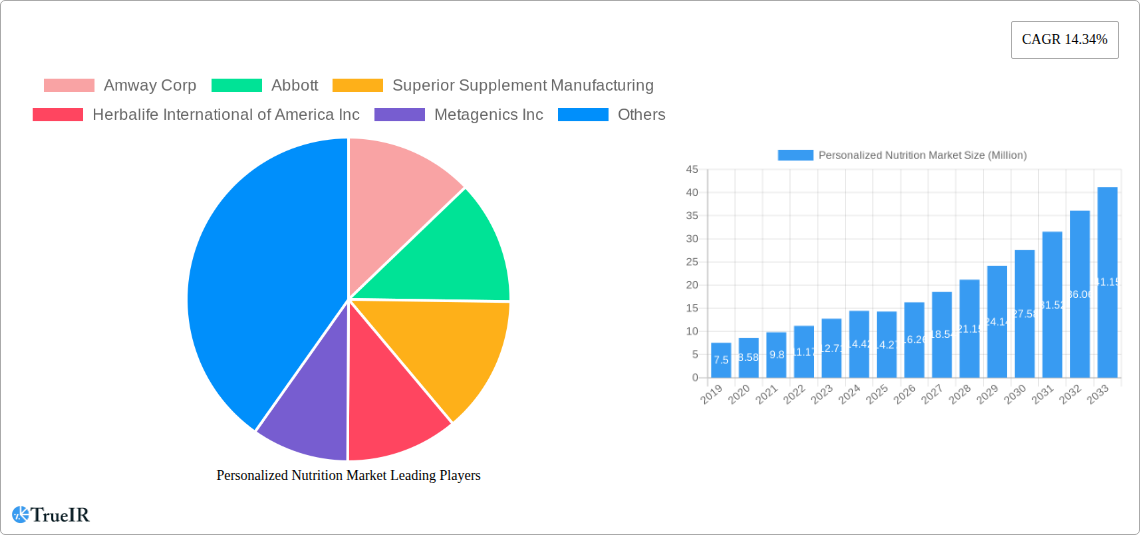
Personalized Nutrition Market Market Size (In Million)
The market is segmented into distinct categories, with Active Measurement and Standard Measurement representing key product types. In terms of application, Standard Supplements and Disease-based nutrition solutions are gaining prominence, reflecting a dual focus on general wellness and targeted therapeutic interventions. The end-user landscape is diverse, encompassing Direct-to-Consumer individuals, Wellness and Fitness Centers, Hospitals and Clinics, and Research Institutions, each contributing to the market's expansive reach. Emerging trends indicate a stronger emphasis on integrating AI and machine learning for predictive nutrition insights, the rise of subscription-based personalized nutrition services, and the increasing demand for scientifically validated and transparent product offerings. Despite the optimistic outlook, potential restraints include the high cost of some advanced diagnostic tests, regulatory hurdles in certain regions, and the need for greater consumer education to build trust in personalized dietary approaches. The competitive landscape features established players like Amway Corp, Abbott, and Herbalife, alongside innovative newcomers such as Viome Life Sciences Inc, all striving to capture a share of this dynamic and rapidly evolving market.
Personalized Nutrition Market Company Market Share
This comprehensive report delves into the dynamic Personalized Nutrition Market, forecasting its significant growth from 2019 to 2033, with a robust Base Year of 2025 and an Estimated Year also of 2025. The Forecast Period extends from 2025 to 2033, building upon the Historical Period of 2019–2024. We explore the burgeoning demand for customized dietary interventions, driven by advancements in genomics, AI, and consumer awareness of preventative health. The Personalized Nutrition Market size is poised for substantial expansion, with key players investing heavily in innovation and market penetration.
Personalized Nutrition Market Market Structure & Competitive Landscape
The Personalized Nutrition Market exhibits a moderately concentrated structure, with several key players dominating the landscape, including Amway Corp, Abbott, Superior Supplement Manufacturing, Herbalife International of America Inc, Metagenics Inc, GX Sciences LLC, Nutralliance, Divine Design Manufacturing, Archer Daniels Midland Company (ADM), and Viome Life Sciences Inc, among others. Innovation is a critical differentiator, with companies actively developing novel diagnostic tools and tailored supplement formulations. Regulatory impacts, while evolving, are beginning to shape market access and product claims, particularly concerning disease-based applications. Product substitutes, such as generic supplements and generalized dietary advice, pose a challenge, yet the increasing sophistication of personalized approaches is creating distinct market segments. The end-user segmentation reveals strong growth in the Direct-to-Consumer channel, alongside a steady uptake by Wellness and Fitness Centers. M&A trends are anticipated to intensify as larger corporations seek to acquire innovative technologies and expand their personalized nutrition portfolios, with an estimated M&A volume of over 50 Million in 2025. Concentration ratios are projected to remain relatively stable in the short term, with potential for increased consolidation in later forecast years.
Personalized Nutrition Market Market Trends & Opportunities
The Personalized Nutrition Market is experiencing an unprecedented surge in growth, driven by a confluence of technological advancements and evolving consumer expectations. The global market size is projected to reach over 10,000 Million by 2025, exhibiting a compelling CAGR of approximately 12% throughout the forecast period. This impressive expansion is fueled by a significant shift in consumer preferences towards proactive health management and a growing awareness of the limitations of one-size-fits-all dietary approaches.
Technological shifts are at the forefront of this revolution. The integration of genomics, proteomics, microbiome analysis, and advanced AI algorithms is enabling highly accurate and individualized nutritional assessments. These technologies empower consumers and healthcare professionals to understand unique biological predispositions and dietary needs, paving the way for tailored supplement recommendations, meal plans, and lifestyle interventions. The market penetration rate for personalized nutrition solutions is steadily increasing, particularly among health-conscious demographics and individuals managing chronic conditions.
Consumer demand for actionable health insights is escalating. Individuals are increasingly seeking to optimize their well-being through precise dietary strategies that address specific health goals, such as weight management, improved athletic performance, cognitive enhancement, and disease prevention. This demand is translating into a higher willingness to invest in personalized nutrition services and products.
The competitive dynamics within the Personalized Nutrition Market are intensifying. Established players are investing in research and development to enhance their diagnostic capabilities and product offerings, while a wave of innovative startups is disrupting the market with novel technologies and business models. Strategic partnerships between technology providers, supplement manufacturers, and healthcare institutions are becoming more prevalent, further accelerating market growth and innovation. The development of user-friendly platforms and accessible testing kits is crucial for expanding market reach and making personalized nutrition a mainstream approach to health and wellness. The global market value is expected to surpass 25,000 Million by 2033, underscoring the immense potential and transformative impact of personalized nutrition on the healthcare and wellness industries.
Dominant Markets & Segments in Personalized Nutrition Market
The Personalized Nutrition Market is characterized by regional dominance and specific segment leadership, driven by various factors. Globally, North America currently leads the market, with the United States at the forefront, owing to high consumer awareness, significant disposable income, and a well-established healthcare infrastructure that readily adopts innovative health solutions. The growing prevalence of lifestyle-related diseases and a strong emphasis on preventative healthcare are key growth drivers in this region.
Within the Product Type segment, Active Measurement is experiencing accelerated growth. This segment, which includes advanced diagnostic techniques like genetic testing, microbiome analysis, and blood biomarker profiling, offers deeper insights into individual physiological needs. The ability to provide highly precise recommendations based on real-time biological data makes active measurement a key differentiator and a significant revenue generator, projected to contribute over 7,000 Million by 2025. Standard Measurement, while still relevant, is gradually being complemented by these more sophisticated methods.
In terms of Application, Disease-based personalized nutrition is witnessing a substantial rise. As understanding of the intricate link between diet and chronic conditions deepens, demand for tailored interventions for diseases such as diabetes, cardiovascular disease, and autoimmune disorders is soaring. This segment is expected to reach over 6,000 Million by 2025, driven by clinical validation and increasing acceptance within medical communities. Standard Supplements, while a foundational application, is increasingly being integrated with personalized insights.
The End User segment is predominantly led by Direct-to-Consumer (DTC). This channel benefits from the increasing accessibility of at-home testing kits and online platforms that offer personalized advice and product delivery. The DTC market is estimated to be worth over 9,000 Million by 2025, fueled by convenience and a desire for self-empowerment in health management. Wellness and Fitness Centers are also significant contributors, offering integrated personalized nutrition services to their clientele, and are expected to contribute over 3,000 Million by 2025. While Hospitals and Clinics, and Research Institutions are crucial for clinical integration and scientific advancement, their immediate market share is smaller but holds immense future potential.
Personalized Nutrition Market Product Analysis
Product innovation in the Personalized Nutrition Market centers on sophisticated diagnostic tools and highly tailored supplement formulations. Advances in genetic sequencing, microbiome analysis, and AI-driven data interpretation are enabling the development of precise nutritional recommendations. These innovations empower consumers with actionable insights into their unique biological needs, leading to the creation of custom-blended vitamins, minerals, and other dietary supplements designed for optimal absorption and efficacy. Competitive advantages are derived from the accuracy of testing, the personalization of product recommendations, and the ease of integration into consumers' daily lives. The market is witnessing a shift towards holistic solutions that address individual health goals and genetic predispositions, fostering greater product differentiation and customer loyalty.
Key Drivers, Barriers & Challenges in Personalized Nutrition Market
Key Drivers, Barriers & Challenges in Personalized Nutrition Market
The Personalized Nutrition Market is propelled by several significant drivers. Technological advancements, particularly in genomics, AI, and diagnostics, are enabling more accurate and accessible personalized health insights. Growing consumer awareness and demand for preventative healthcare solutions, coupled with the increasing prevalence of chronic diseases, are further fueling market expansion. Government initiatives promoting health and wellness and the growing acceptance of personalized approaches by healthcare professionals also act as significant growth catalysts. The global market size is expected to see a substantial increase due to these factors.
However, the market also faces considerable barriers and challenges. High costs associated with advanced testing and personalized product development can limit accessibility for a broader population. Regulatory hurdles and evolving guidelines regarding health claims and data privacy present ongoing challenges. Supply chain complexities for specialized ingredients and the need for robust quality control also pose significant obstacles. Furthermore, intense competitive pressures and the need for continuous innovation to stay ahead of market trends require substantial investment and strategic agility. Consumer education remains crucial to overcome skepticism and ensure proper understanding and utilization of personalized nutrition solutions, impacting the overall market growth.
Growth Drivers in the Personalized Nutrition Market Market
Key growth drivers in the Personalized Nutrition Market are multi-faceted. Technologically, the ongoing advancements in genomic sequencing and microbiome analysis are providing unprecedented insights into individual metabolic pathways and nutrient requirements, enabling hyper-personalized recommendations. Economically, increasing disposable incomes and a growing willingness among consumers to invest in proactive health and wellness initiatives are significantly boosting demand. The market size is projected to grow substantially due to these economic factors. Policy-wise, supportive governmental regulations and public health campaigns emphasizing preventative care are creating a favorable environment. For instance, initiatives promoting early disease detection and management through tailored diets directly contribute to the expansion of this market.
Challenges Impacting Personalized Nutrition Market Growth
Challenges impacting Personalized Nutrition Market growth include regulatory complexities, with evolving frameworks for health claims and data privacy requiring constant adaptation. Supply chain issues for niche ingredients and the need for stringent quality control of personalized formulations can lead to increased operational costs and potential delays. Competitive pressures are intensifying, necessitating continuous innovation and significant investment in research and development to maintain market share. Overcoming consumer skepticism and ensuring widespread adoption requires robust educational campaigns and clear demonstrations of tangible health benefits, impacting the overall market penetration rate.
Key Players Shaping the Personalized Nutrition Market Market
Amway Corp Abbott Superior Supplement Manufacturing Herbalife International of America Inc Metagenics Inc GX Sciences LLC Nutralliance Divine Design Manufacturing Archer Daniels Midland Company (ADM) Viome Life Sciences Inc
Significant Personalized Nutrition Market Industry Milestones
- September 2024: Bioniq announced its partnership with healthcare reimbursement and HSA/FSA spending solution Truemed. This partnership signifies that Bioniq’s unique pharmaceutical-grade nutritional supplements can be medically necessary, allowing for HSA and FSA to spend on the preventative healthcare routine.
- February 2024: Riise, a Berlin-based supplement startup, introduced its personalized microgranule nutrient blends, catering to individual nutritional needs and health objectives, thus eliminating the necessity for multiple pills and capsules.
Future Outlook for Personalized Nutrition Market Market
The future outlook for the Personalized Nutrition Market is exceptionally promising, driven by a sustained surge in consumer demand for tailored health solutions and continuous technological innovation. Strategic opportunities lie in the expansion of direct-to-consumer channels, the integration of personalized nutrition within clinical settings, and the development of data-driven platforms that offer comprehensive wellness management. The market's potential is further amplified by the growing understanding of the microbiome's impact on health and the increasing use of AI in deciphering complex biological data. This dynamic evolution positions the Personalized Nutrition Market for exponential growth, projected to significantly impact global health and wellness paradigms.
Personalized Nutrition Market Segmentation
-
1. Product Type
- 1.1. Active Measurement
- 1.2. Standard Measurement
-
2. Application
- 2.1. Standard Supplements
- 2.2. Disease-based
-
3. End User
- 3.1. Direct-to-Consumer
- 3.2. Wellness and Fitness Centers
- 3.3. Hospitals and Clinics
- 3.4. Research Institutions
Personalized Nutrition Market Segmentation By Geography
-
1. North America
- 1.1. United States
- 1.2. Canada
- 1.3. Mexico
-
2. Europe
- 2.1. Germany
- 2.2. United Kingdom
- 2.3. France
- 2.4. Italy
- 2.5. Spain
- 2.6. Rest of Europe
-
3. Asia Pacific
- 3.1. China
- 3.2. Japan
- 3.3. India
- 3.4. Australia
- 3.5. South Korea
- 3.6. Rest of Asia Pacific
-
4. Middle East and Africa
- 4.1. GCC
- 4.2. South Africa
- 4.3. Rest of Middle East and Africa
-
5. South America
- 5.1. Brazil
- 5.2. Argentina
- 5.3. Rest of South America
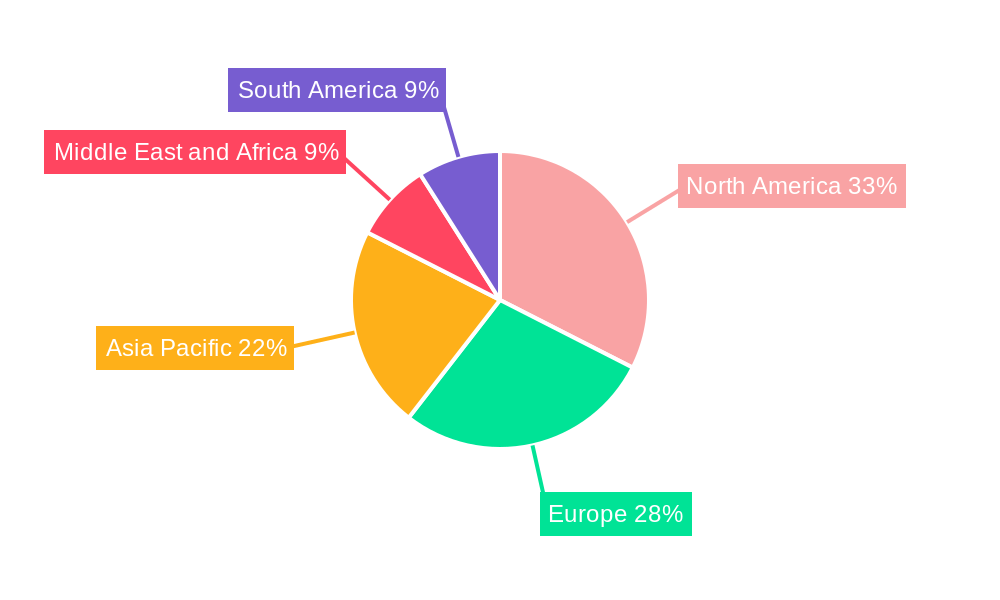
Personalized Nutrition Market Regional Market Share
Geographic Coverage of Personalized Nutrition Market
Personalized Nutrition Market REPORT HIGHLIGHTS
| Aspects | Details |
|---|---|
| Study Period | 2020-2034 |
| Base Year | 2025 |
| Estimated Year | 2026 |
| Forecast Period | 2026-2034 |
| Historical Period | 2020-2025 |
| Growth Rate | CAGR of 14.34% from 2020-2034 |
| Segmentation |
|
Table of Contents
- 1. Introduction
- 1.1. Research Scope
- 1.2. Market Segmentation
- 1.3. Research Objective
- 1.4. Definitions and Assumptions
- 2. Executive Summary
- 2.1. Market Snapshot
- 3. Market Dynamics
- 3.1. Market Drivers
- 3.2. Market Restrains
- 3.3. Market Trends
- 3.4. Market Opportunities
- 4. Market Factor Analysis
- 4.1. Porters Five Forces
- 4.1.1. Bargaining Power of Suppliers
- 4.1.2. Bargaining Power of Buyers
- 4.1.3. Threat of New Entrants
- 4.1.4. Threat of Substitutes
- 4.1.5. Competitive Rivalry
- 4.2. PESTEL analysis
- 4.3. BCG Analysis
- 4.3.1. Stars (High Growth, High Market Share)
- 4.3.2. Cash Cows (Low Growth, High Market Share)
- 4.3.3. Question Mark (High Growth, Low Market Share)
- 4.3.4. Dogs (Low Growth, Low Market Share)
- 4.4. Ansoff Matrix Analysis
- 4.5. Supply Chain Analysis
- 4.6. Regulatory Landscape
- 4.7. Current Market Potential and Opportunity Assessment (TAM–SAM–SOM Framework)
- 4.8. TIR Analyst Note
- 4.1. Porters Five Forces
- 5. Market Analysis, Insights and Forecast 2021-2033
- 5.1. Market Analysis, Insights and Forecast - by Product Type
- 5.1.1. Active Measurement
- 5.1.2. Standard Measurement
- 5.2. Market Analysis, Insights and Forecast - by Application
- 5.2.1. Standard Supplements
- 5.2.2. Disease-based
- 5.3. Market Analysis, Insights and Forecast - by End User
- 5.3.1. Direct-to-Consumer
- 5.3.2. Wellness and Fitness Centers
- 5.3.3. Hospitals and Clinics
- 5.3.4. Research Institutions
- 5.4. Market Analysis, Insights and Forecast - by Region
- 5.4.1. North America
- 5.4.2. Europe
- 5.4.3. Asia Pacific
- 5.4.4. Middle East and Africa
- 5.4.5. South America
- 5.1. Market Analysis, Insights and Forecast - by Product Type
- 6. Global Personalized Nutrition Market Analysis, Insights and Forecast, 2021-2033
- 6.1. Market Analysis, Insights and Forecast - by Product Type
- 6.1.1. Active Measurement
- 6.1.2. Standard Measurement
- 6.2. Market Analysis, Insights and Forecast - by Application
- 6.2.1. Standard Supplements
- 6.2.2. Disease-based
- 6.3. Market Analysis, Insights and Forecast - by End User
- 6.3.1. Direct-to-Consumer
- 6.3.2. Wellness and Fitness Centers
- 6.3.3. Hospitals and Clinics
- 6.3.4. Research Institutions
- 6.1. Market Analysis, Insights and Forecast - by Product Type
- 7. North America Personalized Nutrition Market Analysis, Insights and Forecast, 2020-2032
- 7.1. Market Analysis, Insights and Forecast - by Product Type
- 7.1.1. Active Measurement
- 7.1.2. Standard Measurement
- 7.2. Market Analysis, Insights and Forecast - by Application
- 7.2.1. Standard Supplements
- 7.2.2. Disease-based
- 7.3. Market Analysis, Insights and Forecast - by End User
- 7.3.1. Direct-to-Consumer
- 7.3.2. Wellness and Fitness Centers
- 7.3.3. Hospitals and Clinics
- 7.3.4. Research Institutions
- 7.1. Market Analysis, Insights and Forecast - by Product Type
- 8. Europe Personalized Nutrition Market Analysis, Insights and Forecast, 2020-2032
- 8.1. Market Analysis, Insights and Forecast - by Product Type
- 8.1.1. Active Measurement
- 8.1.2. Standard Measurement
- 8.2. Market Analysis, Insights and Forecast - by Application
- 8.2.1. Standard Supplements
- 8.2.2. Disease-based
- 8.3. Market Analysis, Insights and Forecast - by End User
- 8.3.1. Direct-to-Consumer
- 8.3.2. Wellness and Fitness Centers
- 8.3.3. Hospitals and Clinics
- 8.3.4. Research Institutions
- 8.1. Market Analysis, Insights and Forecast - by Product Type
- 9. Asia Pacific Personalized Nutrition Market Analysis, Insights and Forecast, 2020-2032
- 9.1. Market Analysis, Insights and Forecast - by Product Type
- 9.1.1. Active Measurement
- 9.1.2. Standard Measurement
- 9.2. Market Analysis, Insights and Forecast - by Application
- 9.2.1. Standard Supplements
- 9.2.2. Disease-based
- 9.3. Market Analysis, Insights and Forecast - by End User
- 9.3.1. Direct-to-Consumer
- 9.3.2. Wellness and Fitness Centers
- 9.3.3. Hospitals and Clinics
- 9.3.4. Research Institutions
- 9.1. Market Analysis, Insights and Forecast - by Product Type
- 10. Middle East and Africa Personalized Nutrition Market Analysis, Insights and Forecast, 2020-2032
- 10.1. Market Analysis, Insights and Forecast - by Product Type
- 10.1.1. Active Measurement
- 10.1.2. Standard Measurement
- 10.2. Market Analysis, Insights and Forecast - by Application
- 10.2.1. Standard Supplements
- 10.2.2. Disease-based
- 10.3. Market Analysis, Insights and Forecast - by End User
- 10.3.1. Direct-to-Consumer
- 10.3.2. Wellness and Fitness Centers
- 10.3.3. Hospitals and Clinics
- 10.3.4. Research Institutions
- 10.1. Market Analysis, Insights and Forecast - by Product Type
- 11. South America Personalized Nutrition Market Analysis, Insights and Forecast, 2020-2032
- 11.1. Market Analysis, Insights and Forecast - by Product Type
- 11.1.1. Active Measurement
- 11.1.2. Standard Measurement
- 11.2. Market Analysis, Insights and Forecast - by Application
- 11.2.1. Standard Supplements
- 11.2.2. Disease-based
- 11.3. Market Analysis, Insights and Forecast - by End User
- 11.3.1. Direct-to-Consumer
- 11.3.2. Wellness and Fitness Centers
- 11.3.3. Hospitals and Clinics
- 11.3.4. Research Institutions
- 11.1. Market Analysis, Insights and Forecast - by Product Type
- 12. Competitive Analysis
- 12.1. Company Profiles
- 12.1.1 Amway Corp
- 12.1.1.1. Company Overview
- 12.1.1.2. Products
- 12.1.1.3. Company Financials
- 12.1.1.4. SWOT Analysis
- 12.1.2 Abbott
- 12.1.2.1. Company Overview
- 12.1.2.2. Products
- 12.1.2.3. Company Financials
- 12.1.2.4. SWOT Analysis
- 12.1.3 Superior Supplement Manufacturing
- 12.1.3.1. Company Overview
- 12.1.3.2. Products
- 12.1.3.3. Company Financials
- 12.1.3.4. SWOT Analysis
- 12.1.4 Herbalife International of America Inc
- 12.1.4.1. Company Overview
- 12.1.4.2. Products
- 12.1.4.3. Company Financials
- 12.1.4.4. SWOT Analysis
- 12.1.5 Metagenics Inc
- 12.1.5.1. Company Overview
- 12.1.5.2. Products
- 12.1.5.3. Company Financials
- 12.1.5.4. SWOT Analysis
- 12.1.6 GX Sciences LLC
- 12.1.6.1. Company Overview
- 12.1.6.2. Products
- 12.1.6.3. Company Financials
- 12.1.6.4. SWOT Analysis
- 12.1.7 Nutralliance
- 12.1.7.1. Company Overview
- 12.1.7.2. Products
- 12.1.7.3. Company Financials
- 12.1.7.4. SWOT Analysis
- 12.1.8 Divine Design Manufacturing
- 12.1.8.1. Company Overview
- 12.1.8.2. Products
- 12.1.8.3. Company Financials
- 12.1.8.4. SWOT Analysis
- 12.1.9 Archer Daniels Midland Company (ADM)
- 12.1.9.1. Company Overview
- 12.1.9.2. Products
- 12.1.9.3. Company Financials
- 12.1.9.4. SWOT Analysis
- 12.1.10 Viome Life Sciences Inc *List Not Exhaustive
- 12.1.10.1. Company Overview
- 12.1.10.2. Products
- 12.1.10.3. Company Financials
- 12.1.10.4. SWOT Analysis
- 12.1.1 Amway Corp
- 12.2. Market Entropy
- 12.2.1 Company's Key Areas Served
- 12.2.2 Recent Developments
- 12.3. Company Market Share Analysis 2025
- 12.3.1 Top 5 Companies Market Share Analysis
- 12.3.2 Top 3 Companies Market Share Analysis
- 12.4. List of Potential Customers
- 13. Research Methodology
List of Figures
- Figure 1: Global Personalized Nutrition Market Revenue Breakdown (Million, %) by Region 2025 & 2033
- Figure 2: Global Personalized Nutrition Market Volume Breakdown (Billion, %) by Region 2025 & 2033
- Figure 3: North America Personalized Nutrition Market Revenue (Million), by Product Type 2025 & 2033
- Figure 4: North America Personalized Nutrition Market Volume (Billion), by Product Type 2025 & 2033
- Figure 5: North America Personalized Nutrition Market Revenue Share (%), by Product Type 2025 & 2033
- Figure 6: North America Personalized Nutrition Market Volume Share (%), by Product Type 2025 & 2033
- Figure 7: North America Personalized Nutrition Market Revenue (Million), by Application 2025 & 2033
- Figure 8: North America Personalized Nutrition Market Volume (Billion), by Application 2025 & 2033
- Figure 9: North America Personalized Nutrition Market Revenue Share (%), by Application 2025 & 2033
- Figure 10: North America Personalized Nutrition Market Volume Share (%), by Application 2025 & 2033
- Figure 11: North America Personalized Nutrition Market Revenue (Million), by End User 2025 & 2033
- Figure 12: North America Personalized Nutrition Market Volume (Billion), by End User 2025 & 2033
- Figure 13: North America Personalized Nutrition Market Revenue Share (%), by End User 2025 & 2033
- Figure 14: North America Personalized Nutrition Market Volume Share (%), by End User 2025 & 2033
- Figure 15: North America Personalized Nutrition Market Revenue (Million), by Country 2025 & 2033
- Figure 16: North America Personalized Nutrition Market Volume (Billion), by Country 2025 & 2033
- Figure 17: North America Personalized Nutrition Market Revenue Share (%), by Country 2025 & 2033
- Figure 18: North America Personalized Nutrition Market Volume Share (%), by Country 2025 & 2033
- Figure 19: Europe Personalized Nutrition Market Revenue (Million), by Product Type 2025 & 2033
- Figure 20: Europe Personalized Nutrition Market Volume (Billion), by Product Type 2025 & 2033
- Figure 21: Europe Personalized Nutrition Market Revenue Share (%), by Product Type 2025 & 2033
- Figure 22: Europe Personalized Nutrition Market Volume Share (%), by Product Type 2025 & 2033
- Figure 23: Europe Personalized Nutrition Market Revenue (Million), by Application 2025 & 2033
- Figure 24: Europe Personalized Nutrition Market Volume (Billion), by Application 2025 & 2033
- Figure 25: Europe Personalized Nutrition Market Revenue Share (%), by Application 2025 & 2033
- Figure 26: Europe Personalized Nutrition Market Volume Share (%), by Application 2025 & 2033
- Figure 27: Europe Personalized Nutrition Market Revenue (Million), by End User 2025 & 2033
- Figure 28: Europe Personalized Nutrition Market Volume (Billion), by End User 2025 & 2033
- Figure 29: Europe Personalized Nutrition Market Revenue Share (%), by End User 2025 & 2033
- Figure 30: Europe Personalized Nutrition Market Volume Share (%), by End User 2025 & 2033
- Figure 31: Europe Personalized Nutrition Market Revenue (Million), by Country 2025 & 2033
- Figure 32: Europe Personalized Nutrition Market Volume (Billion), by Country 2025 & 2033
- Figure 33: Europe Personalized Nutrition Market Revenue Share (%), by Country 2025 & 2033
- Figure 34: Europe Personalized Nutrition Market Volume Share (%), by Country 2025 & 2033
- Figure 35: Asia Pacific Personalized Nutrition Market Revenue (Million), by Product Type 2025 & 2033
- Figure 36: Asia Pacific Personalized Nutrition Market Volume (Billion), by Product Type 2025 & 2033
- Figure 37: Asia Pacific Personalized Nutrition Market Revenue Share (%), by Product Type 2025 & 2033
- Figure 38: Asia Pacific Personalized Nutrition Market Volume Share (%), by Product Type 2025 & 2033
- Figure 39: Asia Pacific Personalized Nutrition Market Revenue (Million), by Application 2025 & 2033
- Figure 40: Asia Pacific Personalized Nutrition Market Volume (Billion), by Application 2025 & 2033
- Figure 41: Asia Pacific Personalized Nutrition Market Revenue Share (%), by Application 2025 & 2033
- Figure 42: Asia Pacific Personalized Nutrition Market Volume Share (%), by Application 2025 & 2033
- Figure 43: Asia Pacific Personalized Nutrition Market Revenue (Million), by End User 2025 & 2033
- Figure 44: Asia Pacific Personalized Nutrition Market Volume (Billion), by End User 2025 & 2033
- Figure 45: Asia Pacific Personalized Nutrition Market Revenue Share (%), by End User 2025 & 2033
- Figure 46: Asia Pacific Personalized Nutrition Market Volume Share (%), by End User 2025 & 2033
- Figure 47: Asia Pacific Personalized Nutrition Market Revenue (Million), by Country 2025 & 2033
- Figure 48: Asia Pacific Personalized Nutrition Market Volume (Billion), by Country 2025 & 2033
- Figure 49: Asia Pacific Personalized Nutrition Market Revenue Share (%), by Country 2025 & 2033
- Figure 50: Asia Pacific Personalized Nutrition Market Volume Share (%), by Country 2025 & 2033
- Figure 51: Middle East and Africa Personalized Nutrition Market Revenue (Million), by Product Type 2025 & 2033
- Figure 52: Middle East and Africa Personalized Nutrition Market Volume (Billion), by Product Type 2025 & 2033
- Figure 53: Middle East and Africa Personalized Nutrition Market Revenue Share (%), by Product Type 2025 & 2033
- Figure 54: Middle East and Africa Personalized Nutrition Market Volume Share (%), by Product Type 2025 & 2033
- Figure 55: Middle East and Africa Personalized Nutrition Market Revenue (Million), by Application 2025 & 2033
- Figure 56: Middle East and Africa Personalized Nutrition Market Volume (Billion), by Application 2025 & 2033
- Figure 57: Middle East and Africa Personalized Nutrition Market Revenue Share (%), by Application 2025 & 2033
- Figure 58: Middle East and Africa Personalized Nutrition Market Volume Share (%), by Application 2025 & 2033
- Figure 59: Middle East and Africa Personalized Nutrition Market Revenue (Million), by End User 2025 & 2033
- Figure 60: Middle East and Africa Personalized Nutrition Market Volume (Billion), by End User 2025 & 2033
- Figure 61: Middle East and Africa Personalized Nutrition Market Revenue Share (%), by End User 2025 & 2033
- Figure 62: Middle East and Africa Personalized Nutrition Market Volume Share (%), by End User 2025 & 2033
- Figure 63: Middle East and Africa Personalized Nutrition Market Revenue (Million), by Country 2025 & 2033
- Figure 64: Middle East and Africa Personalized Nutrition Market Volume (Billion), by Country 2025 & 2033
- Figure 65: Middle East and Africa Personalized Nutrition Market Revenue Share (%), by Country 2025 & 2033
- Figure 66: Middle East and Africa Personalized Nutrition Market Volume Share (%), by Country 2025 & 2033
- Figure 67: South America Personalized Nutrition Market Revenue (Million), by Product Type 2025 & 2033
- Figure 68: South America Personalized Nutrition Market Volume (Billion), by Product Type 2025 & 2033
- Figure 69: South America Personalized Nutrition Market Revenue Share (%), by Product Type 2025 & 2033
- Figure 70: South America Personalized Nutrition Market Volume Share (%), by Product Type 2025 & 2033
- Figure 71: South America Personalized Nutrition Market Revenue (Million), by Application 2025 & 2033
- Figure 72: South America Personalized Nutrition Market Volume (Billion), by Application 2025 & 2033
- Figure 73: South America Personalized Nutrition Market Revenue Share (%), by Application 2025 & 2033
- Figure 74: South America Personalized Nutrition Market Volume Share (%), by Application 2025 & 2033
- Figure 75: South America Personalized Nutrition Market Revenue (Million), by End User 2025 & 2033
- Figure 76: South America Personalized Nutrition Market Volume (Billion), by End User 2025 & 2033
- Figure 77: South America Personalized Nutrition Market Revenue Share (%), by End User 2025 & 2033
- Figure 78: South America Personalized Nutrition Market Volume Share (%), by End User 2025 & 2033
- Figure 79: South America Personalized Nutrition Market Revenue (Million), by Country 2025 & 2033
- Figure 80: South America Personalized Nutrition Market Volume (Billion), by Country 2025 & 2033
- Figure 81: South America Personalized Nutrition Market Revenue Share (%), by Country 2025 & 2033
- Figure 82: South America Personalized Nutrition Market Volume Share (%), by Country 2025 & 2033
List of Tables
- Table 1: Global Personalized Nutrition Market Revenue Million Forecast, by Product Type 2020 & 2033
- Table 2: Global Personalized Nutrition Market Volume Billion Forecast, by Product Type 2020 & 2033
- Table 3: Global Personalized Nutrition Market Revenue Million Forecast, by Application 2020 & 2033
- Table 4: Global Personalized Nutrition Market Volume Billion Forecast, by Application 2020 & 2033
- Table 5: Global Personalized Nutrition Market Revenue Million Forecast, by End User 2020 & 2033
- Table 6: Global Personalized Nutrition Market Volume Billion Forecast, by End User 2020 & 2033
- Table 7: Global Personalized Nutrition Market Revenue Million Forecast, by Region 2020 & 2033
- Table 8: Global Personalized Nutrition Market Volume Billion Forecast, by Region 2020 & 2033
- Table 9: Global Personalized Nutrition Market Revenue Million Forecast, by Product Type 2020 & 2033
- Table 10: Global Personalized Nutrition Market Volume Billion Forecast, by Product Type 2020 & 2033
- Table 11: Global Personalized Nutrition Market Revenue Million Forecast, by Application 2020 & 2033
- Table 12: Global Personalized Nutrition Market Volume Billion Forecast, by Application 2020 & 2033
- Table 13: Global Personalized Nutrition Market Revenue Million Forecast, by End User 2020 & 2033
- Table 14: Global Personalized Nutrition Market Volume Billion Forecast, by End User 2020 & 2033
- Table 15: Global Personalized Nutrition Market Revenue Million Forecast, by Country 2020 & 2033
- Table 16: Global Personalized Nutrition Market Volume Billion Forecast, by Country 2020 & 2033
- Table 17: United States Personalized Nutrition Market Revenue (Million) Forecast, by Application 2020 & 2033
- Table 18: United States Personalized Nutrition Market Volume (Billion) Forecast, by Application 2020 & 2033
- Table 19: Canada Personalized Nutrition Market Revenue (Million) Forecast, by Application 2020 & 2033
- Table 20: Canada Personalized Nutrition Market Volume (Billion) Forecast, by Application 2020 & 2033
- Table 21: Mexico Personalized Nutrition Market Revenue (Million) Forecast, by Application 2020 & 2033
- Table 22: Mexico Personalized Nutrition Market Volume (Billion) Forecast, by Application 2020 & 2033
- Table 23: Global Personalized Nutrition Market Revenue Million Forecast, by Product Type 2020 & 2033
- Table 24: Global Personalized Nutrition Market Volume Billion Forecast, by Product Type 2020 & 2033
- Table 25: Global Personalized Nutrition Market Revenue Million Forecast, by Application 2020 & 2033
- Table 26: Global Personalized Nutrition Market Volume Billion Forecast, by Application 2020 & 2033
- Table 27: Global Personalized Nutrition Market Revenue Million Forecast, by End User 2020 & 2033
- Table 28: Global Personalized Nutrition Market Volume Billion Forecast, by End User 2020 & 2033
- Table 29: Global Personalized Nutrition Market Revenue Million Forecast, by Country 2020 & 2033
- Table 30: Global Personalized Nutrition Market Volume Billion Forecast, by Country 2020 & 2033
- Table 31: Germany Personalized Nutrition Market Revenue (Million) Forecast, by Application 2020 & 2033
- Table 32: Germany Personalized Nutrition Market Volume (Billion) Forecast, by Application 2020 & 2033
- Table 33: United Kingdom Personalized Nutrition Market Revenue (Million) Forecast, by Application 2020 & 2033
- Table 34: United Kingdom Personalized Nutrition Market Volume (Billion) Forecast, by Application 2020 & 2033
- Table 35: France Personalized Nutrition Market Revenue (Million) Forecast, by Application 2020 & 2033
- Table 36: France Personalized Nutrition Market Volume (Billion) Forecast, by Application 2020 & 2033
- Table 37: Italy Personalized Nutrition Market Revenue (Million) Forecast, by Application 2020 & 2033
- Table 38: Italy Personalized Nutrition Market Volume (Billion) Forecast, by Application 2020 & 2033
- Table 39: Spain Personalized Nutrition Market Revenue (Million) Forecast, by Application 2020 & 2033
- Table 40: Spain Personalized Nutrition Market Volume (Billion) Forecast, by Application 2020 & 2033
- Table 41: Rest of Europe Personalized Nutrition Market Revenue (Million) Forecast, by Application 2020 & 2033
- Table 42: Rest of Europe Personalized Nutrition Market Volume (Billion) Forecast, by Application 2020 & 2033
- Table 43: Global Personalized Nutrition Market Revenue Million Forecast, by Product Type 2020 & 2033
- Table 44: Global Personalized Nutrition Market Volume Billion Forecast, by Product Type 2020 & 2033
- Table 45: Global Personalized Nutrition Market Revenue Million Forecast, by Application 2020 & 2033
- Table 46: Global Personalized Nutrition Market Volume Billion Forecast, by Application 2020 & 2033
- Table 47: Global Personalized Nutrition Market Revenue Million Forecast, by End User 2020 & 2033
- Table 48: Global Personalized Nutrition Market Volume Billion Forecast, by End User 2020 & 2033
- Table 49: Global Personalized Nutrition Market Revenue Million Forecast, by Country 2020 & 2033
- Table 50: Global Personalized Nutrition Market Volume Billion Forecast, by Country 2020 & 2033
- Table 51: China Personalized Nutrition Market Revenue (Million) Forecast, by Application 2020 & 2033
- Table 52: China Personalized Nutrition Market Volume (Billion) Forecast, by Application 2020 & 2033
- Table 53: Japan Personalized Nutrition Market Revenue (Million) Forecast, by Application 2020 & 2033
- Table 54: Japan Personalized Nutrition Market Volume (Billion) Forecast, by Application 2020 & 2033
- Table 55: India Personalized Nutrition Market Revenue (Million) Forecast, by Application 2020 & 2033
- Table 56: India Personalized Nutrition Market Volume (Billion) Forecast, by Application 2020 & 2033
- Table 57: Australia Personalized Nutrition Market Revenue (Million) Forecast, by Application 2020 & 2033
- Table 58: Australia Personalized Nutrition Market Volume (Billion) Forecast, by Application 2020 & 2033
- Table 59: South Korea Personalized Nutrition Market Revenue (Million) Forecast, by Application 2020 & 2033
- Table 60: South Korea Personalized Nutrition Market Volume (Billion) Forecast, by Application 2020 & 2033
- Table 61: Rest of Asia Pacific Personalized Nutrition Market Revenue (Million) Forecast, by Application 2020 & 2033
- Table 62: Rest of Asia Pacific Personalized Nutrition Market Volume (Billion) Forecast, by Application 2020 & 2033
- Table 63: Global Personalized Nutrition Market Revenue Million Forecast, by Product Type 2020 & 2033
- Table 64: Global Personalized Nutrition Market Volume Billion Forecast, by Product Type 2020 & 2033
- Table 65: Global Personalized Nutrition Market Revenue Million Forecast, by Application 2020 & 2033
- Table 66: Global Personalized Nutrition Market Volume Billion Forecast, by Application 2020 & 2033
- Table 67: Global Personalized Nutrition Market Revenue Million Forecast, by End User 2020 & 2033
- Table 68: Global Personalized Nutrition Market Volume Billion Forecast, by End User 2020 & 2033
- Table 69: Global Personalized Nutrition Market Revenue Million Forecast, by Country 2020 & 2033
- Table 70: Global Personalized Nutrition Market Volume Billion Forecast, by Country 2020 & 2033
- Table 71: GCC Personalized Nutrition Market Revenue (Million) Forecast, by Application 2020 & 2033
- Table 72: GCC Personalized Nutrition Market Volume (Billion) Forecast, by Application 2020 & 2033
- Table 73: South Africa Personalized Nutrition Market Revenue (Million) Forecast, by Application 2020 & 2033
- Table 74: South Africa Personalized Nutrition Market Volume (Billion) Forecast, by Application 2020 & 2033
- Table 75: Rest of Middle East and Africa Personalized Nutrition Market Revenue (Million) Forecast, by Application 2020 & 2033
- Table 76: Rest of Middle East and Africa Personalized Nutrition Market Volume (Billion) Forecast, by Application 2020 & 2033
- Table 77: Global Personalized Nutrition Market Revenue Million Forecast, by Product Type 2020 & 2033
- Table 78: Global Personalized Nutrition Market Volume Billion Forecast, by Product Type 2020 & 2033
- Table 79: Global Personalized Nutrition Market Revenue Million Forecast, by Application 2020 & 2033
- Table 80: Global Personalized Nutrition Market Volume Billion Forecast, by Application 2020 & 2033
- Table 81: Global Personalized Nutrition Market Revenue Million Forecast, by End User 2020 & 2033
- Table 82: Global Personalized Nutrition Market Volume Billion Forecast, by End User 2020 & 2033
- Table 83: Global Personalized Nutrition Market Revenue Million Forecast, by Country 2020 & 2033
- Table 84: Global Personalized Nutrition Market Volume Billion Forecast, by Country 2020 & 2033
- Table 85: Brazil Personalized Nutrition Market Revenue (Million) Forecast, by Application 2020 & 2033
- Table 86: Brazil Personalized Nutrition Market Volume (Billion) Forecast, by Application 2020 & 2033
- Table 87: Argentina Personalized Nutrition Market Revenue (Million) Forecast, by Application 2020 & 2033
- Table 88: Argentina Personalized Nutrition Market Volume (Billion) Forecast, by Application 2020 & 2033
- Table 89: Rest of South America Personalized Nutrition Market Revenue (Million) Forecast, by Application 2020 & 2033
- Table 90: Rest of South America Personalized Nutrition Market Volume (Billion) Forecast, by Application 2020 & 2033
Frequently Asked Questions
1. What is the projected Compound Annual Growth Rate (CAGR) of the Personalized Nutrition Market?
The projected CAGR is approximately 14.34%.
2. Which companies are prominent players in the Personalized Nutrition Market?
Key companies in the market include Amway Corp, Abbott, Superior Supplement Manufacturing, Herbalife International of America Inc, Metagenics Inc, GX Sciences LLC, Nutralliance, Divine Design Manufacturing, Archer Daniels Midland Company (ADM), Viome Life Sciences Inc *List Not Exhaustive.
3. What are the main segments of the Personalized Nutrition Market?
The market segments include Product Type, Application, End User.
4. Can you provide details about the market size?
The market size is estimated to be USD 14.27 Million as of 2022.
5. What are some drivers contributing to market growth?
Shift in Consumer Preference Due to a Rise in Health Awareness; Increasing Burden of Chronic Diseases and Geriatric Population; Technological Advancements and Growing Trend of Digital Healthcare.
6. What are the notable trends driving market growth?
Disease-based Segment Expected to Hold a Significant Share Over the Forecast Period.
7. Are there any restraints impacting market growth?
Shift in Consumer Preference Due to a Rise in Health Awareness; Increasing Burden of Chronic Diseases and Geriatric Population; Technological Advancements and Growing Trend of Digital Healthcare.
8. Can you provide examples of recent developments in the market?
September 2024: Bioniq announced its partnership with healthcare reimbursement and HSA/FSA spending solution Truemed. This partnership signifies that Bioniq’s unique pharmaceutical-grade nutritional supplements can be medically necessary, allowing for HSA and FSA to spend on the preventative healthcare routine.February 2024: Riise, a Berlin-based supplement startup, introduced its personalized microgranule nutrient blends, catering to individual nutritional needs and health objectives, thus eliminating the necessity for multiple pills and capsules.
9. What pricing options are available for accessing the report?
Pricing options include single-user, multi-user, and enterprise licenses priced at USD 4750, USD 5250, and USD 8750 respectively.
10. Is the market size provided in terms of value or volume?
The market size is provided in terms of value, measured in Million and volume, measured in Billion.
11. Are there any specific market keywords associated with the report?
Yes, the market keyword associated with the report is "Personalized Nutrition Market," which aids in identifying and referencing the specific market segment covered.
12. How do I determine which pricing option suits my needs best?
The pricing options vary based on user requirements and access needs. Individual users may opt for single-user licenses, while businesses requiring broader access may choose multi-user or enterprise licenses for cost-effective access to the report.
13. Are there any additional resources or data provided in the Personalized Nutrition Market report?
While the report offers comprehensive insights, it's advisable to review the specific contents or supplementary materials provided to ascertain if additional resources or data are available.
14. How can I stay updated on further developments or reports in the Personalized Nutrition Market?
To stay informed about further developments, trends, and reports in the Personalized Nutrition Market, consider subscribing to industry newsletters, following relevant companies and organizations, or regularly checking reputable industry news sources and publications.
Methodology
Step 1 - Identification of Relevant Samples Size from Population Database


Step 2 - Approaches for Defining Global Market Size (Value, Volume* & Price*)

Note*: In applicable scenarios
Step 3 - Data Sources
Primary Research
- Web Analytics
- Survey Reports
- Research Institute
- Latest Research Reports
- Opinion Leaders
Secondary Research
- Annual Reports
- White Paper
- Latest Press Release
- Industry Association
- Paid Database
- Investor Presentations

Step 4 - Data Triangulation
Involves using different sources of information in order to increase the validity of a study
These sources are likely to be stakeholders in a program - participants, other researchers, program staff, other community members, and so on.
Then we put all data in single framework & apply various statistical tools to find out the dynamic on the market.
During the analysis stage, feedback from the stakeholder groups would be compared to determine areas of agreement as well as areas of divergence