

Key Insights
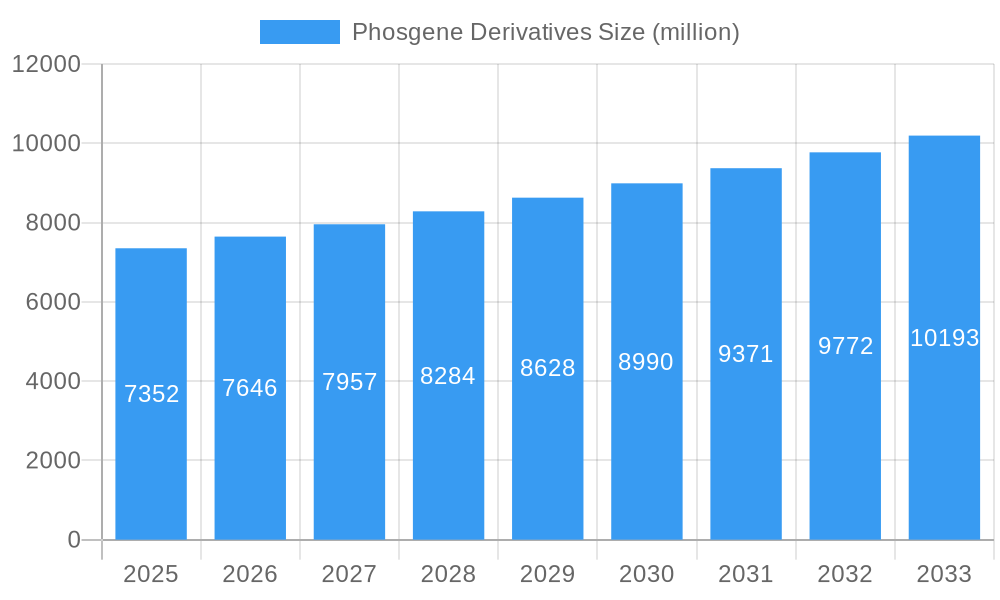
The global Phosgene Derivatives market is projected to reach a substantial size of $7352 million by 2025, exhibiting a robust Compound Annual Growth Rate (CAGR) of 4% through 2033. This growth is underpinned by the indispensable role of phosgene derivatives across a diverse range of industries, with Polyurethane production emerging as a primary driver. The widespread application of polyurethanes in construction, automotive, furniture, and coatings, due to their exceptional properties like durability, insulation, and flexibility, fuels consistent demand. Beyond polyurethanes, pharmaceutical intermediates and agrochemical intermediates represent significant application segments, driven by the continuous need for novel drug development and efficient crop protection solutions. The market's expansion is further supported by ongoing technological advancements in phosgene derivative manufacturing, leading to improved production efficiency and product purity.
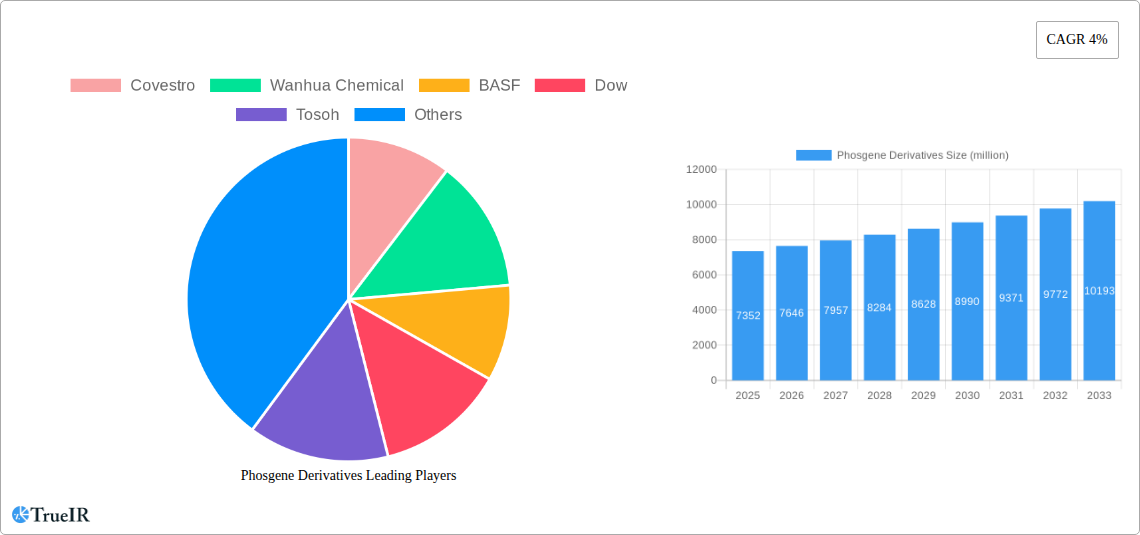
Phosgene Derivatives Market Size (In Billion)
The market dynamics for phosgene derivatives are influenced by several key factors. Key trends include a growing emphasis on sustainable production methods and the development of safer alternatives or handling processes for phosgene, a highly toxic chemical. Geographically, the Asia Pacific region, particularly China and India, is anticipated to be a dominant force, driven by rapid industrialization, a burgeoning manufacturing sector, and increasing investments in both chemical and end-use industries. Conversely, stringent environmental regulations and safety concerns associated with phosgene handling pose considerable restraints to market growth in certain regions. However, strategic collaborations among key players, ongoing research and development efforts focused on expanding applications, and the growing demand for specialized phosgene derivatives are expected to pave the way for continued market resilience and expansion.
Phosgene Derivatives Company Market Share
Phosgene Derivatives Market: Comprehensive Report 2019-2033
This in-depth report provides a comprehensive analysis of the global Phosgene Derivatives market, forecasting its trajectory from 2025 through 2033. Leveraging extensive historical data from 2019-2024 and focusing on the base year of 2025, this study delves into market structure, competitive dynamics, emerging trends, regional dominance, and product innovations within this vital chemical sector. With an estimated market size of USD 50 billion in 2025 and a projected Compound Annual Growth Rate (CAGR) of 6.5% over the forecast period, this report is an indispensable resource for industry stakeholders.
Phosgene Derivatives Market Structure & Competitive Landscape
The global Phosgene Derivatives market exhibits a moderately concentrated structure, with the top 5 players accounting for approximately 60% of the market share in 2025. Innovation drivers are primarily centered around developing safer handling technologies for phosgene and its derivatives, alongside the creation of novel applications in high-growth sectors like pharmaceuticals and advanced materials. Regulatory impacts, particularly concerning environmental safety and stringent chemical handling protocols, are significant, influencing manufacturing processes and R&D investments. The threat of product substitutes is relatively low for core applications like polyurethane production, given the unique properties of phosgene-derived isocyanates. However, ongoing research into bio-based alternatives in specific niche segments warrants attention. End-user segmentation reveals a strong reliance on the Polyurethane sector, which is projected to consume over 50% of phosgene derivatives by volume. The Pharmaceutical Intermediates segment is also experiencing robust growth, driven by advancements in drug discovery and synthesis. Mergers and acquisitions (M&A) trends are notable, with an estimated 20 M&A deals valued at over USD 2 billion occurring between 2019 and 2024, primarily aimed at consolidating market positions, acquiring advanced technologies, and expanding geographical reach.
Phosgene Derivatives Market Trends & Opportunities
The Phosgene Derivatives market is poised for substantial growth, driven by an escalating demand for its versatile applications across numerous industries. The market size, estimated at USD 50 billion in 2025, is projected to reach USD 75 billion by 2033, reflecting a robust CAGR of 6.5%. This expansion is underpinned by several key trends. Technologically, there is a significant push towards developing more sustainable and efficient phosgenation processes, including continuous flow chemistry and microreactor technologies, which offer enhanced safety and reduced environmental impact. These innovations are critical for overcoming inherent safety concerns associated with phosgene. Consumer preferences are increasingly leaning towards products with improved performance and sustainability profiles, directly influencing the demand for high-quality polyurethanes in sectors like construction, automotive, and furniture. The competitive dynamics are characterized by intense R&D efforts to differentiate product offerings and secure intellectual property. Companies are investing heavily in upstream integration and downstream application development to capture greater market share. The growing emphasis on specialty chemicals for pharmaceutical and agrochemical synthesis presents a significant opportunity. The increasing global population and rising disposable incomes are fueling demand for enhanced insulation materials, advanced coatings, and effective crop protection solutions, all of which rely on phosgene derivatives. The market penetration rate for phosgene derivatives in emerging economies is expected to witness a substantial increase as industrialization accelerates and regulatory frameworks mature. Strategic partnerships and collaborations between chemical manufacturers and end-users are becoming more prevalent, fostering innovation and accelerating product development cycles. The exploration of novel applications in areas like advanced composites and high-performance polymers also represents a promising avenue for future market expansion. Furthermore, government initiatives promoting sustainable manufacturing and the development of green chemistry principles are creating new opportunities for companies that can offer environmentally friendlier phosgene derivative solutions. The ongoing digitalization of chemical manufacturing processes is also expected to improve efficiency, reduce costs, and enhance product quality.
Dominant Markets & Segments in Phosgene Derivatives
The Polyurethane segment is the undisputed leader in the Phosgene Derivatives market, accounting for an estimated 55% of global demand in 2025. This dominance is fueled by the widespread use of isocyanates, key phosgene derivatives, in the production of flexible and rigid foams, coatings, adhesives, and elastomers. The automotive industry's continuous demand for lightweight materials and enhanced fuel efficiency, coupled with the construction sector's need for superior insulation and durable building materials, are significant growth drivers for polyurethanes. The Asia Pacific region, particularly China, is the largest and fastest-growing market for phosgene derivatives, driven by its massive manufacturing base and expanding industrial sectors. Government policies promoting domestic production and infrastructure development further bolster this dominance.
Application: Polyurethane:
- Key Growth Drivers: Growing automotive production, increasing demand for energy-efficient buildings, expansion of the furniture and bedding industries, and the rising popularity of polyurethane-based footwear.
- Market Dominance Analysis: The ubiquitous nature of polyurethane in everyday products and industrial applications solidifies its position as the primary consumer of phosgene derivatives. Innovations in polyurethane formulations to meet specific performance requirements (e.g., flame retardancy, UV resistance) further drive demand.
Application: Pharmaceutical Intermediates:
- Key Growth Drivers: An aging global population, increasing healthcare expenditure, and advancements in drug discovery and development leading to a higher demand for complex organic molecules.
- Market Dominance Analysis: Phosgene derivatives are crucial building blocks for synthesizing a wide range of active pharmaceutical ingredients (APIs) and intermediates. The stringent quality requirements and growing complexity of pharmaceutical research are creating a consistent demand for high-purity phosgene derivatives.
Type: Isocyanates:
- Key Growth Drivers: As the primary precursors for polyurethanes, isocyanates share the growth drivers of the polyurethane segment. Specific drivers include the development of specialized isocyanates for niche applications and advancements in their production efficiency.
- Market Dominance Analysis: Isocyanates, including TDI (Toluene Diisocyanate) and MDI (Methylene Diphenyl Diisocyanate), represent the largest category of phosgene derivatives by volume and value. Their essential role in polyurethane synthesis ensures their continued market leadership.
Dominant Region: Asia Pacific:
- Key Growth Drivers: Rapid industrialization, significant manufacturing output, favorable government policies supporting chemical production, and a large consumer base.
- Market Dominance Analysis: Asia Pacific's dominance is a testament to its role as the global manufacturing hub. The presence of major chemical producers and a burgeoning domestic market for end products make it the focal point of phosgene derivative consumption and production.
Phosgene Derivatives Product Analysis
The Phosgene Derivatives market is characterized by continuous product innovation, focusing on enhancing safety, performance, and sustainability. Chloroformates, for instance, are being developed with improved stability for easier handling in sensitive chemical syntheses, particularly for pharmaceuticals and agrochemicals. Isocyanates are seeing advancements in tailored formulations for specific polyurethane applications, offering improved flexibility, durability, and eco-friendliness. Acid chlorides are increasingly being optimized for high-yield synthesis routes in specialty chemical production. These product innovations are driven by stringent regulatory requirements, evolving end-user demands for advanced materials, and the pursuit of cost-effectiveness, solidifying the competitive advantage of companies investing in R&D.
Key Drivers, Barriers & Challenges in Phosgene Derivatives
The Phosgene Derivatives market is propelled by several key drivers. Technological advancements in safer phosgenation processes, such as continuous flow chemistry, are reducing operational risks. The economic growth in emerging economies fuels demand for materials like polyurethanes in construction and automotive sectors. Policy-driven initiatives promoting domestic production and R&D also contribute to market expansion. For example, the increasing emphasis on energy-efficient building materials globally is a direct driver for polyurethane demand.
Key challenges and restraints impacting growth include stringent regulatory hurdles related to phosgene's toxicity, leading to high compliance costs and the need for specialized infrastructure. Supply chain disruptions, as witnessed during global events, can impact the availability of raw materials and intermediates, leading to price volatility. Competitive pressures from alternative materials in niche applications and the high capital investment required for phosgene production facilities also pose significant barriers. For instance, fluctuating raw material prices for precursors like chlorine and carbon monoxide can significantly impact profit margins.
Growth Drivers in the Phosgene Derivatives Market
Several factors are driving the growth of the Phosgene Derivatives market. Technological innovation is paramount, with companies investing in developing safer and more efficient phosgenation processes, including microreactor technology and alternative synthesis routes. Economic expansion in developing nations, particularly in Asia and Latin America, is creating robust demand for end products like polyurethanes in construction, automotive, and consumer goods. Favorable government policies supporting domestic chemical manufacturing and promoting the use of advanced materials also act as significant growth catalysts. For instance, initiatives focused on energy efficiency in buildings directly boost the demand for polyurethane insulation.
Challenges Impacting Phosgene Derivatives Growth
Despite its growth potential, the Phosgene Derivatives market faces significant challenges. Regulatory complexities surrounding the handling and transportation of phosgene and its derivatives due to their inherent toxicity necessitate substantial investments in safety infrastructure and compliance measures. Supply chain vulnerabilities, including the availability and price volatility of key raw materials like chlorine and carbon monoxide, can disrupt production and impact cost-effectiveness. Intense competitive pressures from both established players and emerging market entrants, coupled with the threat of substitution in certain niche applications by greener alternatives, also pose challenges. The high capital expenditure required for building and maintaining phosgene production facilities is a substantial barrier to entry for new players.
Key Players Shaping the Phosgene Derivatives Market
- Covestro
- Wanhua Chemical
- BASF
- Dow
- Tosoh
- Mitsui Chemicals
- Chuo Kaseihin
- Hodogaya Chemical
- ALTIVIA
- VanDeMark
- Paushak
- Saltigo
- Atul Bioscience
- UPL
- KPX Life Science
- Guangxin Corporation
- Great Chinasoft Technology
- Hunan Haili Chemical
- Chongqing ChangFeng Chemical
- Wynca Group
- Shanghai Bayue Chemicals
Significant Phosgene Derivatives Industry Milestones
- 2019: Covestro develops a new phosgenation process with enhanced safety features.
- 2020: Wanhua Chemical expands its MDI production capacity significantly in China.
- 2021: BASF introduces a new range of specialized isocyanates for high-performance coatings.
- 2021: VanDeMark receives key regulatory approval for its advanced phosgene derivative production facility.
- 2022: Dow announces strategic partnerships to develop more sustainable polyurethane solutions.
- 2022: Mitsui Chemicals invests in R&D for novel phosgene derivatives in pharmaceutical applications.
- 2023: Paushak enhances its production capabilities for agrochemical intermediates.
- 2023: UPL explores greener synthesis routes for phosgene-based agrochemicals.
- 2024: Saltigo expands its custom synthesis offerings for pharmaceutical companies leveraging phosgene chemistry.
- 2024: Tosoh focuses on optimizing its production efficiency for key phosgene derivatives.
Future Outlook for Phosgene Derivatives Market
The future outlook for the Phosgene Derivatives market remains exceptionally positive, driven by sustained demand from core applications and emerging growth opportunities. Strategic investments in R&D for safer and more sustainable production technologies will be crucial for navigating regulatory landscapes and consumer preferences. The increasing demand for high-performance materials in the automotive, construction, and pharmaceutical sectors will continue to fuel market expansion. Opportunities lie in the development of specialty phosgene derivatives for niche applications, such as advanced polymers and complex pharmaceutical intermediates, and the adoption of digital manufacturing technologies to enhance efficiency and reduce costs. The market is expected to witness consolidation and strategic alliances as companies seek to secure supply chains and expand their global reach, further solidifying the market's robust growth trajectory.
Phosgene Derivatives Segmentation
-
1. Application
- 1.1. Polyurethane
- 1.2. Pharmaceutical Intermediates
- 1.3. Agrochemical Intermediates
- 1.4. Dyes
- 1.5. Other
-
2. Types
- 2.1. Chloroformates
- 2.2. Isocyanates
- 2.3. Acid Chlorides
- 2.4. Others
Phosgene Derivatives Segmentation By Geography
-
1. North America
- 1.1. United States
- 1.2. Canada
- 1.3. Mexico
-
2. South America
- 2.1. Brazil
- 2.2. Argentina
- 2.3. Rest of South America
-
3. Europe
- 3.1. United Kingdom
- 3.2. Germany
- 3.3. France
- 3.4. Italy
- 3.5. Spain
- 3.6. Russia
- 3.7. Benelux
- 3.8. Nordics
- 3.9. Rest of Europe
-
4. Middle East & Africa
- 4.1. Turkey
- 4.2. Israel
- 4.3. GCC
- 4.4. North Africa
- 4.5. South Africa
- 4.6. Rest of Middle East & Africa
-
5. Asia Pacific
- 5.1. China
- 5.2. India
- 5.3. Japan
- 5.4. South Korea
- 5.5. ASEAN
- 5.6. Oceania
- 5.7. Rest of Asia Pacific
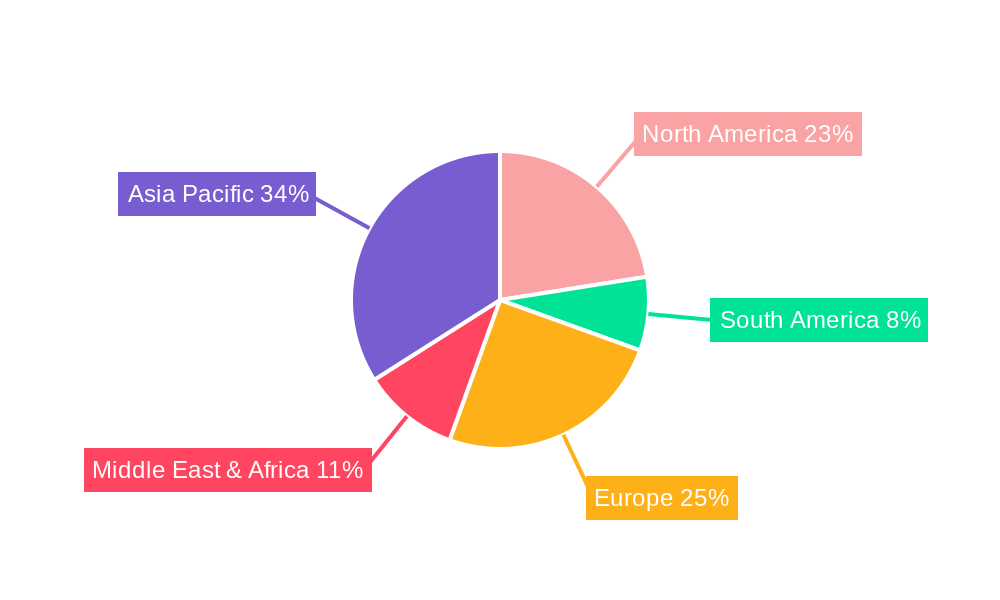
Phosgene Derivatives Regional Market Share
Geographic Coverage of Phosgene Derivatives
Phosgene Derivatives REPORT HIGHLIGHTS
| Aspects | Details |
|---|---|
| Study Period | 2020-2034 |
| Base Year | 2025 |
| Estimated Year | 2026 |
| Forecast Period | 2026-2034 |
| Historical Period | 2020-2025 |
| Growth Rate | CAGR of 4% from 2020-2034 |
| Segmentation |
|
Table of Contents
- 1. Introduction
- 1.1. Research Scope
- 1.2. Market Segmentation
- 1.3. Research Methodology
- 1.4. Definitions and Assumptions
- 2. Executive Summary
- 2.1. Introduction
- 3. Market Dynamics
- 3.1. Introduction
- 3.2. Market Drivers
- 3.3. Market Restrains
- 3.4. Market Trends
- 4. Market Factor Analysis
- 4.1. Porters Five Forces
- 4.2. Supply/Value Chain
- 4.3. PESTEL analysis
- 4.4. Market Entropy
- 4.5. Patent/Trademark Analysis
- 5. Global Phosgene Derivatives Analysis, Insights and Forecast, 2020-2032
- 5.1. Market Analysis, Insights and Forecast - by Application
- 5.1.1. Polyurethane
- 5.1.2. Pharmaceutical Intermediates
- 5.1.3. Agrochemical Intermediates
- 5.1.4. Dyes
- 5.1.5. Other
- 5.2. Market Analysis, Insights and Forecast - by Types
- 5.2.1. Chloroformates
- 5.2.2. Isocyanates
- 5.2.3. Acid Chlorides
- 5.2.4. Others
- 5.3. Market Analysis, Insights and Forecast - by Region
- 5.3.1. North America
- 5.3.2. South America
- 5.3.3. Europe
- 5.3.4. Middle East & Africa
- 5.3.5. Asia Pacific
- 5.1. Market Analysis, Insights and Forecast - by Application
- 6. North America Phosgene Derivatives Analysis, Insights and Forecast, 2020-2032
- 6.1. Market Analysis, Insights and Forecast - by Application
- 6.1.1. Polyurethane
- 6.1.2. Pharmaceutical Intermediates
- 6.1.3. Agrochemical Intermediates
- 6.1.4. Dyes
- 6.1.5. Other
- 6.2. Market Analysis, Insights and Forecast - by Types
- 6.2.1. Chloroformates
- 6.2.2. Isocyanates
- 6.2.3. Acid Chlorides
- 6.2.4. Others
- 6.1. Market Analysis, Insights and Forecast - by Application
- 7. South America Phosgene Derivatives Analysis, Insights and Forecast, 2020-2032
- 7.1. Market Analysis, Insights and Forecast - by Application
- 7.1.1. Polyurethane
- 7.1.2. Pharmaceutical Intermediates
- 7.1.3. Agrochemical Intermediates
- 7.1.4. Dyes
- 7.1.5. Other
- 7.2. Market Analysis, Insights and Forecast - by Types
- 7.2.1. Chloroformates
- 7.2.2. Isocyanates
- 7.2.3. Acid Chlorides
- 7.2.4. Others
- 7.1. Market Analysis, Insights and Forecast - by Application
- 8. Europe Phosgene Derivatives Analysis, Insights and Forecast, 2020-2032
- 8.1. Market Analysis, Insights and Forecast - by Application
- 8.1.1. Polyurethane
- 8.1.2. Pharmaceutical Intermediates
- 8.1.3. Agrochemical Intermediates
- 8.1.4. Dyes
- 8.1.5. Other
- 8.2. Market Analysis, Insights and Forecast - by Types
- 8.2.1. Chloroformates
- 8.2.2. Isocyanates
- 8.2.3. Acid Chlorides
- 8.2.4. Others
- 8.1. Market Analysis, Insights and Forecast - by Application
- 9. Middle East & Africa Phosgene Derivatives Analysis, Insights and Forecast, 2020-2032
- 9.1. Market Analysis, Insights and Forecast - by Application
- 9.1.1. Polyurethane
- 9.1.2. Pharmaceutical Intermediates
- 9.1.3. Agrochemical Intermediates
- 9.1.4. Dyes
- 9.1.5. Other
- 9.2. Market Analysis, Insights and Forecast - by Types
- 9.2.1. Chloroformates
- 9.2.2. Isocyanates
- 9.2.3. Acid Chlorides
- 9.2.4. Others
- 9.1. Market Analysis, Insights and Forecast - by Application
- 10. Asia Pacific Phosgene Derivatives Analysis, Insights and Forecast, 2020-2032
- 10.1. Market Analysis, Insights and Forecast - by Application
- 10.1.1. Polyurethane
- 10.1.2. Pharmaceutical Intermediates
- 10.1.3. Agrochemical Intermediates
- 10.1.4. Dyes
- 10.1.5. Other
- 10.2. Market Analysis, Insights and Forecast - by Types
- 10.2.1. Chloroformates
- 10.2.2. Isocyanates
- 10.2.3. Acid Chlorides
- 10.2.4. Others
- 10.1. Market Analysis, Insights and Forecast - by Application
- 11. Competitive Analysis
- 11.1. Global Market Share Analysis 2025
- 11.2. Company Profiles
- 11.2.1 Covestro
- 11.2.1.1. Overview
- 11.2.1.2. Products
- 11.2.1.3. SWOT Analysis
- 11.2.1.4. Recent Developments
- 11.2.1.5. Financials (Based on Availability)
- 11.2.2 Wanhua Chemical
- 11.2.2.1. Overview
- 11.2.2.2. Products
- 11.2.2.3. SWOT Analysis
- 11.2.2.4. Recent Developments
- 11.2.2.5. Financials (Based on Availability)
- 11.2.3 BASF
- 11.2.3.1. Overview
- 11.2.3.2. Products
- 11.2.3.3. SWOT Analysis
- 11.2.3.4. Recent Developments
- 11.2.3.5. Financials (Based on Availability)
- 11.2.4 Dow
- 11.2.4.1. Overview
- 11.2.4.2. Products
- 11.2.4.3. SWOT Analysis
- 11.2.4.4. Recent Developments
- 11.2.4.5. Financials (Based on Availability)
- 11.2.5 Tosoh
- 11.2.5.1. Overview
- 11.2.5.2. Products
- 11.2.5.3. SWOT Analysis
- 11.2.5.4. Recent Developments
- 11.2.5.5. Financials (Based on Availability)
- 11.2.6 Mitsui Chemicals
- 11.2.6.1. Overview
- 11.2.6.2. Products
- 11.2.6.3. SWOT Analysis
- 11.2.6.4. Recent Developments
- 11.2.6.5. Financials (Based on Availability)
- 11.2.7 Chuo Kaseihin
- 11.2.7.1. Overview
- 11.2.7.2. Products
- 11.2.7.3. SWOT Analysis
- 11.2.7.4. Recent Developments
- 11.2.7.5. Financials (Based on Availability)
- 11.2.8 Hodogaya Chemical
- 11.2.8.1. Overview
- 11.2.8.2. Products
- 11.2.8.3. SWOT Analysis
- 11.2.8.4. Recent Developments
- 11.2.8.5. Financials (Based on Availability)
- 11.2.9 ALTIVIA
- 11.2.9.1. Overview
- 11.2.9.2. Products
- 11.2.9.3. SWOT Analysis
- 11.2.9.4. Recent Developments
- 11.2.9.5. Financials (Based on Availability)
- 11.2.10 VanDeMark
- 11.2.10.1. Overview
- 11.2.10.2. Products
- 11.2.10.3. SWOT Analysis
- 11.2.10.4. Recent Developments
- 11.2.10.5. Financials (Based on Availability)
- 11.2.11 Paushak
- 11.2.11.1. Overview
- 11.2.11.2. Products
- 11.2.11.3. SWOT Analysis
- 11.2.11.4. Recent Developments
- 11.2.11.5. Financials (Based on Availability)
- 11.2.12 Saltigo
- 11.2.12.1. Overview
- 11.2.12.2. Products
- 11.2.12.3. SWOT Analysis
- 11.2.12.4. Recent Developments
- 11.2.12.5. Financials (Based on Availability)
- 11.2.13 Atul Bioscience
- 11.2.13.1. Overview
- 11.2.13.2. Products
- 11.2.13.3. SWOT Analysis
- 11.2.13.4. Recent Developments
- 11.2.13.5. Financials (Based on Availability)
- 11.2.14 UPL
- 11.2.14.1. Overview
- 11.2.14.2. Products
- 11.2.14.3. SWOT Analysis
- 11.2.14.4. Recent Developments
- 11.2.14.5. Financials (Based on Availability)
- 11.2.15 KPX Life Science
- 11.2.15.1. Overview
- 11.2.15.2. Products
- 11.2.15.3. SWOT Analysis
- 11.2.15.4. Recent Developments
- 11.2.15.5. Financials (Based on Availability)
- 11.2.16 Guangxin Corporation
- 11.2.16.1. Overview
- 11.2.16.2. Products
- 11.2.16.3. SWOT Analysis
- 11.2.16.4. Recent Developments
- 11.2.16.5. Financials (Based on Availability)
- 11.2.17 Great Chinasoft Technology
- 11.2.17.1. Overview
- 11.2.17.2. Products
- 11.2.17.3. SWOT Analysis
- 11.2.17.4. Recent Developments
- 11.2.17.5. Financials (Based on Availability)
- 11.2.18 Hunan Haili Chemical
- 11.2.18.1. Overview
- 11.2.18.2. Products
- 11.2.18.3. SWOT Analysis
- 11.2.18.4. Recent Developments
- 11.2.18.5. Financials (Based on Availability)
- 11.2.19 Chongqing ChangFeng Chemical
- 11.2.19.1. Overview
- 11.2.19.2. Products
- 11.2.19.3. SWOT Analysis
- 11.2.19.4. Recent Developments
- 11.2.19.5. Financials (Based on Availability)
- 11.2.20 Wynca Group
- 11.2.20.1. Overview
- 11.2.20.2. Products
- 11.2.20.3. SWOT Analysis
- 11.2.20.4. Recent Developments
- 11.2.20.5. Financials (Based on Availability)
- 11.2.21 Shanghai Bayue Chemicals
- 11.2.21.1. Overview
- 11.2.21.2. Products
- 11.2.21.3. SWOT Analysis
- 11.2.21.4. Recent Developments
- 11.2.21.5. Financials (Based on Availability)
- 11.2.1 Covestro
List of Figures
- Figure 1: Global Phosgene Derivatives Revenue Breakdown (million, %) by Region 2025 & 2033
- Figure 2: Global Phosgene Derivatives Volume Breakdown (K, %) by Region 2025 & 2033
- Figure 3: North America Phosgene Derivatives Revenue (million), by Application 2025 & 2033
- Figure 4: North America Phosgene Derivatives Volume (K), by Application 2025 & 2033
- Figure 5: North America Phosgene Derivatives Revenue Share (%), by Application 2025 & 2033
- Figure 6: North America Phosgene Derivatives Volume Share (%), by Application 2025 & 2033
- Figure 7: North America Phosgene Derivatives Revenue (million), by Types 2025 & 2033
- Figure 8: North America Phosgene Derivatives Volume (K), by Types 2025 & 2033
- Figure 9: North America Phosgene Derivatives Revenue Share (%), by Types 2025 & 2033
- Figure 10: North America Phosgene Derivatives Volume Share (%), by Types 2025 & 2033
- Figure 11: North America Phosgene Derivatives Revenue (million), by Country 2025 & 2033
- Figure 12: North America Phosgene Derivatives Volume (K), by Country 2025 & 2033
- Figure 13: North America Phosgene Derivatives Revenue Share (%), by Country 2025 & 2033
- Figure 14: North America Phosgene Derivatives Volume Share (%), by Country 2025 & 2033
- Figure 15: South America Phosgene Derivatives Revenue (million), by Application 2025 & 2033
- Figure 16: South America Phosgene Derivatives Volume (K), by Application 2025 & 2033
- Figure 17: South America Phosgene Derivatives Revenue Share (%), by Application 2025 & 2033
- Figure 18: South America Phosgene Derivatives Volume Share (%), by Application 2025 & 2033
- Figure 19: South America Phosgene Derivatives Revenue (million), by Types 2025 & 2033
- Figure 20: South America Phosgene Derivatives Volume (K), by Types 2025 & 2033
- Figure 21: South America Phosgene Derivatives Revenue Share (%), by Types 2025 & 2033
- Figure 22: South America Phosgene Derivatives Volume Share (%), by Types 2025 & 2033
- Figure 23: South America Phosgene Derivatives Revenue (million), by Country 2025 & 2033
- Figure 24: South America Phosgene Derivatives Volume (K), by Country 2025 & 2033
- Figure 25: South America Phosgene Derivatives Revenue Share (%), by Country 2025 & 2033
- Figure 26: South America Phosgene Derivatives Volume Share (%), by Country 2025 & 2033
- Figure 27: Europe Phosgene Derivatives Revenue (million), by Application 2025 & 2033
- Figure 28: Europe Phosgene Derivatives Volume (K), by Application 2025 & 2033
- Figure 29: Europe Phosgene Derivatives Revenue Share (%), by Application 2025 & 2033
- Figure 30: Europe Phosgene Derivatives Volume Share (%), by Application 2025 & 2033
- Figure 31: Europe Phosgene Derivatives Revenue (million), by Types 2025 & 2033
- Figure 32: Europe Phosgene Derivatives Volume (K), by Types 2025 & 2033
- Figure 33: Europe Phosgene Derivatives Revenue Share (%), by Types 2025 & 2033
- Figure 34: Europe Phosgene Derivatives Volume Share (%), by Types 2025 & 2033
- Figure 35: Europe Phosgene Derivatives Revenue (million), by Country 2025 & 2033
- Figure 36: Europe Phosgene Derivatives Volume (K), by Country 2025 & 2033
- Figure 37: Europe Phosgene Derivatives Revenue Share (%), by Country 2025 & 2033
- Figure 38: Europe Phosgene Derivatives Volume Share (%), by Country 2025 & 2033
- Figure 39: Middle East & Africa Phosgene Derivatives Revenue (million), by Application 2025 & 2033
- Figure 40: Middle East & Africa Phosgene Derivatives Volume (K), by Application 2025 & 2033
- Figure 41: Middle East & Africa Phosgene Derivatives Revenue Share (%), by Application 2025 & 2033
- Figure 42: Middle East & Africa Phosgene Derivatives Volume Share (%), by Application 2025 & 2033
- Figure 43: Middle East & Africa Phosgene Derivatives Revenue (million), by Types 2025 & 2033
- Figure 44: Middle East & Africa Phosgene Derivatives Volume (K), by Types 2025 & 2033
- Figure 45: Middle East & Africa Phosgene Derivatives Revenue Share (%), by Types 2025 & 2033
- Figure 46: Middle East & Africa Phosgene Derivatives Volume Share (%), by Types 2025 & 2033
- Figure 47: Middle East & Africa Phosgene Derivatives Revenue (million), by Country 2025 & 2033
- Figure 48: Middle East & Africa Phosgene Derivatives Volume (K), by Country 2025 & 2033
- Figure 49: Middle East & Africa Phosgene Derivatives Revenue Share (%), by Country 2025 & 2033
- Figure 50: Middle East & Africa Phosgene Derivatives Volume Share (%), by Country 2025 & 2033
- Figure 51: Asia Pacific Phosgene Derivatives Revenue (million), by Application 2025 & 2033
- Figure 52: Asia Pacific Phosgene Derivatives Volume (K), by Application 2025 & 2033
- Figure 53: Asia Pacific Phosgene Derivatives Revenue Share (%), by Application 2025 & 2033
- Figure 54: Asia Pacific Phosgene Derivatives Volume Share (%), by Application 2025 & 2033
- Figure 55: Asia Pacific Phosgene Derivatives Revenue (million), by Types 2025 & 2033
- Figure 56: Asia Pacific Phosgene Derivatives Volume (K), by Types 2025 & 2033
- Figure 57: Asia Pacific Phosgene Derivatives Revenue Share (%), by Types 2025 & 2033
- Figure 58: Asia Pacific Phosgene Derivatives Volume Share (%), by Types 2025 & 2033
- Figure 59: Asia Pacific Phosgene Derivatives Revenue (million), by Country 2025 & 2033
- Figure 60: Asia Pacific Phosgene Derivatives Volume (K), by Country 2025 & 2033
- Figure 61: Asia Pacific Phosgene Derivatives Revenue Share (%), by Country 2025 & 2033
- Figure 62: Asia Pacific Phosgene Derivatives Volume Share (%), by Country 2025 & 2033
List of Tables
- Table 1: Global Phosgene Derivatives Revenue million Forecast, by Application 2020 & 2033
- Table 2: Global Phosgene Derivatives Volume K Forecast, by Application 2020 & 2033
- Table 3: Global Phosgene Derivatives Revenue million Forecast, by Types 2020 & 2033
- Table 4: Global Phosgene Derivatives Volume K Forecast, by Types 2020 & 2033
- Table 5: Global Phosgene Derivatives Revenue million Forecast, by Region 2020 & 2033
- Table 6: Global Phosgene Derivatives Volume K Forecast, by Region 2020 & 2033
- Table 7: Global Phosgene Derivatives Revenue million Forecast, by Application 2020 & 2033
- Table 8: Global Phosgene Derivatives Volume K Forecast, by Application 2020 & 2033
- Table 9: Global Phosgene Derivatives Revenue million Forecast, by Types 2020 & 2033
- Table 10: Global Phosgene Derivatives Volume K Forecast, by Types 2020 & 2033
- Table 11: Global Phosgene Derivatives Revenue million Forecast, by Country 2020 & 2033
- Table 12: Global Phosgene Derivatives Volume K Forecast, by Country 2020 & 2033
- Table 13: United States Phosgene Derivatives Revenue (million) Forecast, by Application 2020 & 2033
- Table 14: United States Phosgene Derivatives Volume (K) Forecast, by Application 2020 & 2033
- Table 15: Canada Phosgene Derivatives Revenue (million) Forecast, by Application 2020 & 2033
- Table 16: Canada Phosgene Derivatives Volume (K) Forecast, by Application 2020 & 2033
- Table 17: Mexico Phosgene Derivatives Revenue (million) Forecast, by Application 2020 & 2033
- Table 18: Mexico Phosgene Derivatives Volume (K) Forecast, by Application 2020 & 2033
- Table 19: Global Phosgene Derivatives Revenue million Forecast, by Application 2020 & 2033
- Table 20: Global Phosgene Derivatives Volume K Forecast, by Application 2020 & 2033
- Table 21: Global Phosgene Derivatives Revenue million Forecast, by Types 2020 & 2033
- Table 22: Global Phosgene Derivatives Volume K Forecast, by Types 2020 & 2033
- Table 23: Global Phosgene Derivatives Revenue million Forecast, by Country 2020 & 2033
- Table 24: Global Phosgene Derivatives Volume K Forecast, by Country 2020 & 2033
- Table 25: Brazil Phosgene Derivatives Revenue (million) Forecast, by Application 2020 & 2033
- Table 26: Brazil Phosgene Derivatives Volume (K) Forecast, by Application 2020 & 2033
- Table 27: Argentina Phosgene Derivatives Revenue (million) Forecast, by Application 2020 & 2033
- Table 28: Argentina Phosgene Derivatives Volume (K) Forecast, by Application 2020 & 2033
- Table 29: Rest of South America Phosgene Derivatives Revenue (million) Forecast, by Application 2020 & 2033
- Table 30: Rest of South America Phosgene Derivatives Volume (K) Forecast, by Application 2020 & 2033
- Table 31: Global Phosgene Derivatives Revenue million Forecast, by Application 2020 & 2033
- Table 32: Global Phosgene Derivatives Volume K Forecast, by Application 2020 & 2033
- Table 33: Global Phosgene Derivatives Revenue million Forecast, by Types 2020 & 2033
- Table 34: Global Phosgene Derivatives Volume K Forecast, by Types 2020 & 2033
- Table 35: Global Phosgene Derivatives Revenue million Forecast, by Country 2020 & 2033
- Table 36: Global Phosgene Derivatives Volume K Forecast, by Country 2020 & 2033
- Table 37: United Kingdom Phosgene Derivatives Revenue (million) Forecast, by Application 2020 & 2033
- Table 38: United Kingdom Phosgene Derivatives Volume (K) Forecast, by Application 2020 & 2033
- Table 39: Germany Phosgene Derivatives Revenue (million) Forecast, by Application 2020 & 2033
- Table 40: Germany Phosgene Derivatives Volume (K) Forecast, by Application 2020 & 2033
- Table 41: France Phosgene Derivatives Revenue (million) Forecast, by Application 2020 & 2033
- Table 42: France Phosgene Derivatives Volume (K) Forecast, by Application 2020 & 2033
- Table 43: Italy Phosgene Derivatives Revenue (million) Forecast, by Application 2020 & 2033
- Table 44: Italy Phosgene Derivatives Volume (K) Forecast, by Application 2020 & 2033
- Table 45: Spain Phosgene Derivatives Revenue (million) Forecast, by Application 2020 & 2033
- Table 46: Spain Phosgene Derivatives Volume (K) Forecast, by Application 2020 & 2033
- Table 47: Russia Phosgene Derivatives Revenue (million) Forecast, by Application 2020 & 2033
- Table 48: Russia Phosgene Derivatives Volume (K) Forecast, by Application 2020 & 2033
- Table 49: Benelux Phosgene Derivatives Revenue (million) Forecast, by Application 2020 & 2033
- Table 50: Benelux Phosgene Derivatives Volume (K) Forecast, by Application 2020 & 2033
- Table 51: Nordics Phosgene Derivatives Revenue (million) Forecast, by Application 2020 & 2033
- Table 52: Nordics Phosgene Derivatives Volume (K) Forecast, by Application 2020 & 2033
- Table 53: Rest of Europe Phosgene Derivatives Revenue (million) Forecast, by Application 2020 & 2033
- Table 54: Rest of Europe Phosgene Derivatives Volume (K) Forecast, by Application 2020 & 2033
- Table 55: Global Phosgene Derivatives Revenue million Forecast, by Application 2020 & 2033
- Table 56: Global Phosgene Derivatives Volume K Forecast, by Application 2020 & 2033
- Table 57: Global Phosgene Derivatives Revenue million Forecast, by Types 2020 & 2033
- Table 58: Global Phosgene Derivatives Volume K Forecast, by Types 2020 & 2033
- Table 59: Global Phosgene Derivatives Revenue million Forecast, by Country 2020 & 2033
- Table 60: Global Phosgene Derivatives Volume K Forecast, by Country 2020 & 2033
- Table 61: Turkey Phosgene Derivatives Revenue (million) Forecast, by Application 2020 & 2033
- Table 62: Turkey Phosgene Derivatives Volume (K) Forecast, by Application 2020 & 2033
- Table 63: Israel Phosgene Derivatives Revenue (million) Forecast, by Application 2020 & 2033
- Table 64: Israel Phosgene Derivatives Volume (K) Forecast, by Application 2020 & 2033
- Table 65: GCC Phosgene Derivatives Revenue (million) Forecast, by Application 2020 & 2033
- Table 66: GCC Phosgene Derivatives Volume (K) Forecast, by Application 2020 & 2033
- Table 67: North Africa Phosgene Derivatives Revenue (million) Forecast, by Application 2020 & 2033
- Table 68: North Africa Phosgene Derivatives Volume (K) Forecast, by Application 2020 & 2033
- Table 69: South Africa Phosgene Derivatives Revenue (million) Forecast, by Application 2020 & 2033
- Table 70: South Africa Phosgene Derivatives Volume (K) Forecast, by Application 2020 & 2033
- Table 71: Rest of Middle East & Africa Phosgene Derivatives Revenue (million) Forecast, by Application 2020 & 2033
- Table 72: Rest of Middle East & Africa Phosgene Derivatives Volume (K) Forecast, by Application 2020 & 2033
- Table 73: Global Phosgene Derivatives Revenue million Forecast, by Application 2020 & 2033
- Table 74: Global Phosgene Derivatives Volume K Forecast, by Application 2020 & 2033
- Table 75: Global Phosgene Derivatives Revenue million Forecast, by Types 2020 & 2033
- Table 76: Global Phosgene Derivatives Volume K Forecast, by Types 2020 & 2033
- Table 77: Global Phosgene Derivatives Revenue million Forecast, by Country 2020 & 2033
- Table 78: Global Phosgene Derivatives Volume K Forecast, by Country 2020 & 2033
- Table 79: China Phosgene Derivatives Revenue (million) Forecast, by Application 2020 & 2033
- Table 80: China Phosgene Derivatives Volume (K) Forecast, by Application 2020 & 2033
- Table 81: India Phosgene Derivatives Revenue (million) Forecast, by Application 2020 & 2033
- Table 82: India Phosgene Derivatives Volume (K) Forecast, by Application 2020 & 2033
- Table 83: Japan Phosgene Derivatives Revenue (million) Forecast, by Application 2020 & 2033
- Table 84: Japan Phosgene Derivatives Volume (K) Forecast, by Application 2020 & 2033
- Table 85: South Korea Phosgene Derivatives Revenue (million) Forecast, by Application 2020 & 2033
- Table 86: South Korea Phosgene Derivatives Volume (K) Forecast, by Application 2020 & 2033
- Table 87: ASEAN Phosgene Derivatives Revenue (million) Forecast, by Application 2020 & 2033
- Table 88: ASEAN Phosgene Derivatives Volume (K) Forecast, by Application 2020 & 2033
- Table 89: Oceania Phosgene Derivatives Revenue (million) Forecast, by Application 2020 & 2033
- Table 90: Oceania Phosgene Derivatives Volume (K) Forecast, by Application 2020 & 2033
- Table 91: Rest of Asia Pacific Phosgene Derivatives Revenue (million) Forecast, by Application 2020 & 2033
- Table 92: Rest of Asia Pacific Phosgene Derivatives Volume (K) Forecast, by Application 2020 & 2033
Frequently Asked Questions
1. What is the projected Compound Annual Growth Rate (CAGR) of the Phosgene Derivatives?
The projected CAGR is approximately 4%.
2. Which companies are prominent players in the Phosgene Derivatives?
Key companies in the market include Covestro, Wanhua Chemical, BASF, Dow, Tosoh, Mitsui Chemicals, Chuo Kaseihin, Hodogaya Chemical, ALTIVIA, VanDeMark, Paushak, Saltigo, Atul Bioscience, UPL, KPX Life Science, Guangxin Corporation, Great Chinasoft Technology, Hunan Haili Chemical, Chongqing ChangFeng Chemical, Wynca Group, Shanghai Bayue Chemicals.
3. What are the main segments of the Phosgene Derivatives?
The market segments include Application, Types.
4. Can you provide details about the market size?
The market size is estimated to be USD 7352 million as of 2022.
5. What are some drivers contributing to market growth?
N/A
6. What are the notable trends driving market growth?
N/A
7. Are there any restraints impacting market growth?
N/A
8. Can you provide examples of recent developments in the market?
N/A
9. What pricing options are available for accessing the report?
Pricing options include single-user, multi-user, and enterprise licenses priced at USD 3950.00, USD 5925.00, and USD 7900.00 respectively.
10. Is the market size provided in terms of value or volume?
The market size is provided in terms of value, measured in million and volume, measured in K.
11. Are there any specific market keywords associated with the report?
Yes, the market keyword associated with the report is "Phosgene Derivatives," which aids in identifying and referencing the specific market segment covered.
12. How do I determine which pricing option suits my needs best?
The pricing options vary based on user requirements and access needs. Individual users may opt for single-user licenses, while businesses requiring broader access may choose multi-user or enterprise licenses for cost-effective access to the report.
13. Are there any additional resources or data provided in the Phosgene Derivatives report?
While the report offers comprehensive insights, it's advisable to review the specific contents or supplementary materials provided to ascertain if additional resources or data are available.
14. How can I stay updated on further developments or reports in the Phosgene Derivatives?
To stay informed about further developments, trends, and reports in the Phosgene Derivatives, consider subscribing to industry newsletters, following relevant companies and organizations, or regularly checking reputable industry news sources and publications.
Methodology
Step 1 - Identification of Relevant Samples Size from Population Database


Step 2 - Approaches for Defining Global Market Size (Value, Volume* & Price*)

Note*: In applicable scenarios
Step 3 - Data Sources
Primary Research
- Web Analytics
- Survey Reports
- Research Institute
- Latest Research Reports
- Opinion Leaders
Secondary Research
- Annual Reports
- White Paper
- Latest Press Release
- Industry Association
- Paid Database
- Investor Presentations

Step 4 - Data Triangulation
Involves using different sources of information in order to increase the validity of a study
These sources are likely to be stakeholders in a program - participants, other researchers, program staff, other community members, and so on.
Then we put all data in single framework & apply various statistical tools to find out the dynamic on the market.
During the analysis stage, feedback from the stakeholder groups would be compared to determine areas of agreement as well as areas of divergence