

Key Insights
The global rice trade, valued at $306.38 billion in 2025, is projected to experience steady growth, exhibiting a Compound Annual Growth Rate (CAGR) of 2.20% from 2025 to 2033. This growth is driven by several factors. Rising global population and increasing demand for staple foods, particularly in developing nations, are significant contributors. The burgeoning food processing industry, utilizing rice as a key ingredient in diverse products, fuels market expansion. Furthermore, the growing popularity of specialty rice varieties, such as organic and aromatic rice, catering to health-conscious consumers and those seeking premium culinary experiences, significantly influences market segmentation. While challenges exist, such as climate change impacting rice yields and price volatility, the overall market outlook remains positive. Strategic investments in improved agricultural technologies and sustainable farming practices are expected to mitigate these risks. Major players like Cargill, Adani Wilmar, and KRBL Ltd are actively shaping market dynamics through innovation, supply chain optimization, and expansion into new markets. Regional variations in consumption patterns and production capacities, however, will continue to influence growth trajectories. For example, the Asia-Pacific region, particularly India and China, will remain dominant due to high consumption and production, while regions like North America and Europe will experience moderate growth driven primarily by imports and increasing demand for specialty rice.
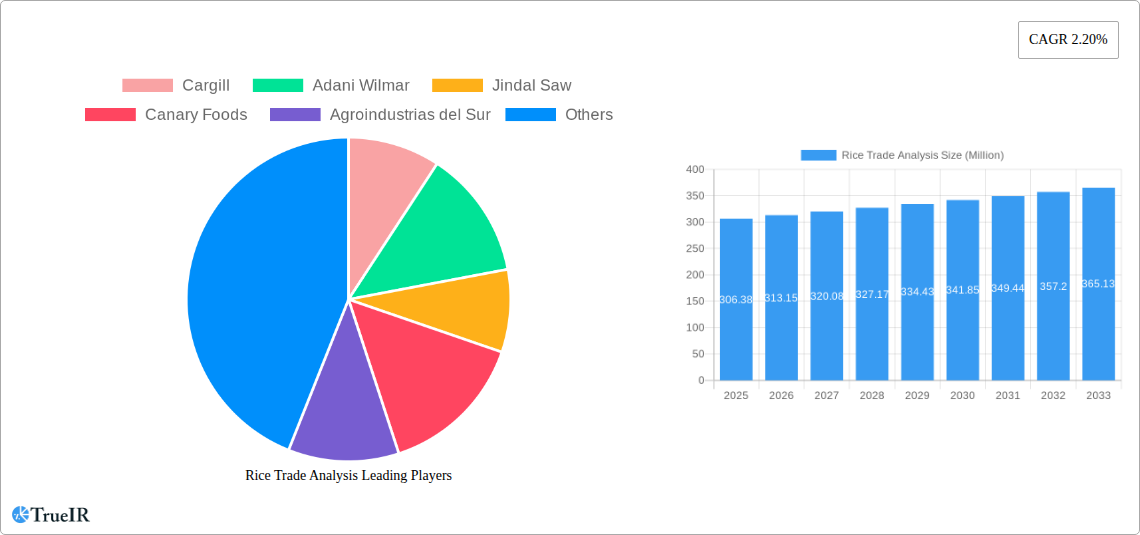
Rice Trade Analysis Market Size (In Million)
The segmentation of the rice market into hybrid rice, non-basmati rice, and specialty rice (organic and aromatic) offers opportunities for targeted marketing and product development. Similarly, the application-based segmentation (food processing, household consumption, livestock feed) highlights the diverse use cases of rice and the potential for growth across various sectors. The competitive landscape is marked by both large multinational corporations and regional players, emphasizing the need for strategic partnerships, vertical integration, and robust supply chain management to maintain a competitive edge. Future growth is anticipated to be fueled by both volume increases and premium pricing for specialty rice varieties, offering opportunities for both large-scale producers and niche players. Market expansion is also expected in regions with growing middle classes and changing dietary preferences.
Rice Trade Analysis Company Market Share
Rice Trade Analysis: A Comprehensive Market Report (2019-2033)
This dynamic report provides a comprehensive analysis of the global rice trade market, offering invaluable insights for industry stakeholders. Leveraging extensive data from 2019-2024 (historical period), the report projects market trends through 2033, with a base year of 2025 and a forecast period of 2025-2033. Covering key segments (Hybrid Rice, Non-Basmati Rice, Specialty Rice), applications (Food Processing, Household Consumption, Livestock Feed), and major players, this report is an essential resource for strategic decision-making. The report analyzes market size exceeding xx Million tons and assesses the impact of recent policy changes like India's export ban and China's minimum pricing policy.
Rice Trade Analysis Market Structure & Competitive Landscape
The global rice trade market exhibits a moderately concentrated structure, where a select group of major players commands a significant portion of the market share. While precise concentration ratios are subject to detailed analysis of specific datasets, initial estimations indicate that the top five entities collectively hold approximately [Insert specific percentage here, e.g., 60%] of the market. Key catalysts for market expansion and differentiation include ongoing innovations in rice cultivation methodologies, such as the development of enhanced hybrid varieties and the adoption of precision agriculture techniques, alongside advancements in processing technologies like automation and sophisticated milling operations. Regulatory frameworks, particularly those pertaining to international trade regulations and stringent food safety standards, wield substantial influence over market dynamics. Competition from substitute grains, including wheat and corn, remains a constant factor, vying for consumer and industrial market penetration.
- End-User Segmentation: Robust growth is projected across all end-user segments within the rice trade. A more granular dissection of specific consumer preferences and their impact on different rice categories will be provided in the comprehensive report.
- M&A Trends: The rice trade sector has witnessed a notable number of significant mergers and acquisitions over the past five years, underscoring a clear trend towards market consolidation and strategic expansion. The forthcoming report will present an in-depth examination of this M&A landscape.
Rice Trade Analysis Market Trends & Opportunities
The global rice trade market is on a trajectory for substantial growth throughout the projected forecast period of 2025-2033, with an anticipated Compound Annual Growth Rate (CAGR) of [Insert specific CAGR percentage here, e.g., 5.2%]. This upward momentum is propelled by a confluence of powerful drivers: a continuously expanding global population, a rising global demand for nutritious food sources, and a burgeoning consumer preference for premium and specialty rice varieties such as organic and aromatic rice. Technological advancements are revolutionizing rice cultivation and processing, leading to demonstrably higher yields and consistently improved product quality. Evolving consumer preferences, characterized by a pronounced shift towards healthier and more convenient food options, are also playing a pivotal role in reshaping market dynamics. Furthermore, the competitive landscape remains dynamic, marked by continuous innovation and aggressive market expansion initiatives undertaken by key industry participants. The report will offer a detailed analysis of market penetration rates across various rice types and their diverse applications.
Dominant Markets & Segments in Rice Trade Analysis
This comprehensive report will meticulously identify the leading global regions and individual countries based on the most current and relevant data. The primary growth drivers for the dominant segments are meticulously detailed below:
- By Type:
- Hybrid Rice: Characterized by its superior yields, inherent pest resistance, and enhanced overall quality, making it a key growth area.
- Non-Basmati Rice: Its widespread appeal is driven by its cost-effectiveness and remarkable adaptability across various culinary traditions and regions.
- Specialty Rice (Organic, Aromatic): Experiencing robust growth fueled by increasing consumer demand for premium, health-conscious, and distinctively flavored rice products.
- By Application:
- Food Processing: Witnessing a surge in demand from food manufacturers, particularly within the ready-to-eat meals and convenience food sectors.
- Household Consumption: This segment remains the bedrock of growth, driven by staple consumption patterns in major rice-producing and consuming nations worldwide.
- Livestock Feed: Maintaining a steady and significant demand from the animal feed industry, with an estimated consumption of [Insert specific tonnage here, e.g., 120] million tons in 2024.
Specific market dynamics within pivotal countries such as India and China will be thoroughly assessed, encompassing their unique infrastructure development, supportive government policies, and distinct consumer behaviors that shape their respective rice trade landscapes.
Rice Trade Analysis Product Analysis
Product innovation focuses on developing higher-yielding, disease-resistant varieties, and improving processing methods to enhance quality, reduce waste, and improve efficiency. These improvements cater to evolving consumer preferences for convenient, healthy, and diverse rice products. The competitive advantage lies in efficient production, superior quality, and effective supply chain management. This report will assess innovations and the market fit of the products.
Key Drivers, Barriers & Challenges in Rice Trade Analysis
Key Drivers: The primary catalysts propelling the rice trade forward include the relentless growth of the global population, which ensures a consistent and expanding demand for food security. Favorable government policies in numerous key rice-producing nations actively support and incentivize rice production. Furthermore, continuous technological advancements in both cultivation and processing methods are significantly enhancing efficiency and output. The burgeoning growth of the food processing industry also contributes substantially to increased rice utilization.
Challenges & Restraints: The rice trade faces several significant hurdles. The unpredictable impacts of climate change on rice cultivation present a substantial risk. Fluctuations in global commodity prices can create market volatility. Supply chain disruptions, whether due to logistical issues or geopolitical events, pose a persistent threat. Stringent trade restrictions and imposing tariffs can hinder international trade flows. Finally, intense competition among producers, both domestically and internationally, adds to the market's complexity. The precise impact of these factors on market growth will be rigorously quantified within the full report, offering predicted outcomes.
Growth Drivers in the Rice Trade Analysis Market
The primary impetus for growth in the rice trade market stems from the inexorable rise in global population, which directly translates into a consistent and escalating demand for this staple food. Further bolstering this growth are the significant advancements in technology that are enhancing both the efficiency and yield of rice production processes. Supportive government policies enacted in several key rice-producing nations also play a crucial role in fostering a conducive environment for market expansion.
Challenges Impacting Rice Trade Analysis Growth
Significant challenges include climate change impacting crop yields, trade barriers and tariffs that disrupt global trade flows, and increasing competition among rice producers, pushing prices and margins down. These factors will be discussed in depth, with quantitative impacts detailed.
Key Players Shaping the Rice Trade Analysis Market
- Cargill
- Adani Wilmar
- Jindal Saw
- Canary Foods
- Agroindustrias del Sur
- Saurer
- KRBL Ltd
- Vigoro
- Thai Binh Rice
- Agroindustrial Rueda
Significant Rice Trade Analysis Industry Milestones
- February 2022: China sets minimum rice prices for 2022, limiting purchases to 50 Million tons.
- August 2022: India plans to procure 51.8 Million tons of rice in the 2022-2023 season.
- September 2022: India bans broken rice exports and imposes a 20% export duty on non-basmati rice.
Future Outlook for Rice Trade Analysis Market
The rice trade market is expected to continue its growth trajectory, driven by population growth, increasing demand for healthier rice varieties, and ongoing technological advancements. Strategic opportunities lie in the development of sustainable and efficient production methods, expansion into new markets, and the creation of value-added rice products. The market holds significant potential for continued expansion and innovation.
Rice Trade Analysis Segmentation
- 1. Production Analysis
- 2. Consumption Analysis
- 3. Import Market Analysis (Value & Volume)
- 4. Export Market Analysis (Value & Volume)
- 5. Price Trend Analysis
Rice Trade Analysis Segmentation By Geography
-
1. North America
- 1.1. United States
- 1.2. Canada
-
2. Europe
- 2.1. France
- 2.2. United Kingdom
- 2.3. Germany
- 2.4. Italy
- 2.5. Spain
-
3. Asia Pacific
- 3.1. China
- 3.2. India
- 3.3. Thailand
- 3.4. Vietnam
- 3.5. Pakistan
-
4. South America
- 4.1. Brazil
- 4.2. Argentina
-
5. Africa
- 5.1. South Africa
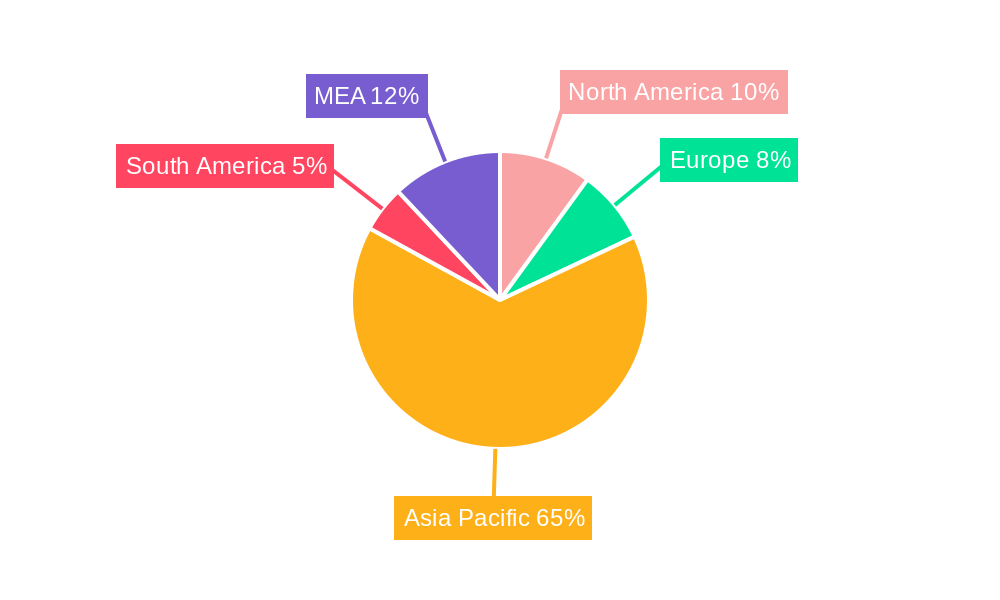
Rice Trade Analysis Regional Market Share
Geographic Coverage of Rice Trade Analysis
Rice Trade Analysis REPORT HIGHLIGHTS
| Aspects | Details |
|---|---|
| Study Period | 2020-2034 |
| Base Year | 2025 |
| Estimated Year | 2026 |
| Forecast Period | 2026-2034 |
| Historical Period | 2020-2025 |
| Growth Rate | CAGR of 2.20% from 2020-2034 |
| Segmentation |
|
Table of Contents
- 1. Introduction
- 1.1. Research Scope
- 1.2. Market Segmentation
- 1.3. Research Methodology
- 1.4. Definitions and Assumptions
- 2. Executive Summary
- 2.1. Introduction
- 3. Market Dynamics
- 3.1. Introduction
- 3.2. Market Drivers
- 3.3. Market Restrains
- 3.4. Market Trends
- 3.4.1. Favorable Trade Policies
- 4. Market Factor Analysis
- 4.1. Porters Five Forces
- 4.2. Supply/Value Chain
- 4.3. PESTEL analysis
- 4.4. Market Entropy
- 4.5. Patent/Trademark Analysis
- 5. Global Rice Trade Analysis Analysis, Insights and Forecast, 2020-2032
- 5.1. Market Analysis, Insights and Forecast - by Production Analysis
- 5.2. Market Analysis, Insights and Forecast - by Consumption Analysis
- 5.3. Market Analysis, Insights and Forecast - by Import Market Analysis (Value & Volume)
- 5.4. Market Analysis, Insights and Forecast - by Export Market Analysis (Value & Volume)
- 5.5. Market Analysis, Insights and Forecast - by Price Trend Analysis
- 5.6. Market Analysis, Insights and Forecast - by Region
- 5.6.1. North America
- 5.6.2. Europe
- 5.6.3. Asia Pacific
- 5.6.4. South America
- 5.6.5. Africa
- 5.1. Market Analysis, Insights and Forecast - by Production Analysis
- 6. North America Rice Trade Analysis Analysis, Insights and Forecast, 2020-2032
- 6.1. Market Analysis, Insights and Forecast - by Production Analysis
- 6.2. Market Analysis, Insights and Forecast - by Consumption Analysis
- 6.3. Market Analysis, Insights and Forecast - by Import Market Analysis (Value & Volume)
- 6.4. Market Analysis, Insights and Forecast - by Export Market Analysis (Value & Volume)
- 6.5. Market Analysis, Insights and Forecast - by Price Trend Analysis
- 6.1. Market Analysis, Insights and Forecast - by Production Analysis
- 7. Europe Rice Trade Analysis Analysis, Insights and Forecast, 2020-2032
- 7.1. Market Analysis, Insights and Forecast - by Production Analysis
- 7.2. Market Analysis, Insights and Forecast - by Consumption Analysis
- 7.3. Market Analysis, Insights and Forecast - by Import Market Analysis (Value & Volume)
- 7.4. Market Analysis, Insights and Forecast - by Export Market Analysis (Value & Volume)
- 7.5. Market Analysis, Insights and Forecast - by Price Trend Analysis
- 7.1. Market Analysis, Insights and Forecast - by Production Analysis
- 8. Asia Pacific Rice Trade Analysis Analysis, Insights and Forecast, 2020-2032
- 8.1. Market Analysis, Insights and Forecast - by Production Analysis
- 8.2. Market Analysis, Insights and Forecast - by Consumption Analysis
- 8.3. Market Analysis, Insights and Forecast - by Import Market Analysis (Value & Volume)
- 8.4. Market Analysis, Insights and Forecast - by Export Market Analysis (Value & Volume)
- 8.5. Market Analysis, Insights and Forecast - by Price Trend Analysis
- 8.1. Market Analysis, Insights and Forecast - by Production Analysis
- 9. South America Rice Trade Analysis Analysis, Insights and Forecast, 2020-2032
- 9.1. Market Analysis, Insights and Forecast - by Production Analysis
- 9.2. Market Analysis, Insights and Forecast - by Consumption Analysis
- 9.3. Market Analysis, Insights and Forecast - by Import Market Analysis (Value & Volume)
- 9.4. Market Analysis, Insights and Forecast - by Export Market Analysis (Value & Volume)
- 9.5. Market Analysis, Insights and Forecast - by Price Trend Analysis
- 9.1. Market Analysis, Insights and Forecast - by Production Analysis
- 10. Africa Rice Trade Analysis Analysis, Insights and Forecast, 2020-2032
- 10.1. Market Analysis, Insights and Forecast - by Production Analysis
- 10.2. Market Analysis, Insights and Forecast - by Consumption Analysis
- 10.3. Market Analysis, Insights and Forecast - by Import Market Analysis (Value & Volume)
- 10.4. Market Analysis, Insights and Forecast - by Export Market Analysis (Value & Volume)
- 10.5. Market Analysis, Insights and Forecast - by Price Trend Analysis
- 10.1. Market Analysis, Insights and Forecast - by Production Analysis
- 11. Competitive Analysis
- 11.1. Global Market Share Analysis 2025
- 11.2. Company Profiles
- 11.2.1 Cargill
- 11.2.1.1. Overview
- 11.2.1.2. Products
- 11.2.1.3. SWOT Analysis
- 11.2.1.4. Recent Developments
- 11.2.1.5. Financials (Based on Availability)
- 11.2.2 Adani Wilmar
- 11.2.2.1. Overview
- 11.2.2.2. Products
- 11.2.2.3. SWOT Analysis
- 11.2.2.4. Recent Developments
- 11.2.2.5. Financials (Based on Availability)
- 11.2.3 Jindal Saw
- 11.2.3.1. Overview
- 11.2.3.2. Products
- 11.2.3.3. SWOT Analysis
- 11.2.3.4. Recent Developments
- 11.2.3.5. Financials (Based on Availability)
- 11.2.4 Canary Foods
- 11.2.4.1. Overview
- 11.2.4.2. Products
- 11.2.4.3. SWOT Analysis
- 11.2.4.4. Recent Developments
- 11.2.4.5. Financials (Based on Availability)
- 11.2.5 Agroindustrias del Sur
- 11.2.5.1. Overview
- 11.2.5.2. Products
- 11.2.5.3. SWOT Analysis
- 11.2.5.4. Recent Developments
- 11.2.5.5. Financials (Based on Availability)
- 11.2.6 Saurer
- 11.2.6.1. Overview
- 11.2.6.2. Products
- 11.2.6.3. SWOT Analysis
- 11.2.6.4. Recent Developments
- 11.2.6.5. Financials (Based on Availability)
- 11.2.7 KRBL Ltd
- 11.2.7.1. Overview
- 11.2.7.2. Products
- 11.2.7.3. SWOT Analysis
- 11.2.7.4. Recent Developments
- 11.2.7.5. Financials (Based on Availability)
- 11.2.8 Vigoro
- 11.2.8.1. Overview
- 11.2.8.2. Products
- 11.2.8.3. SWOT Analysis
- 11.2.8.4. Recent Developments
- 11.2.8.5. Financials (Based on Availability)
- 11.2.9 Thai Binh Rice
- 11.2.9.1. Overview
- 11.2.9.2. Products
- 11.2.9.3. SWOT Analysis
- 11.2.9.4. Recent Developments
- 11.2.9.5. Financials (Based on Availability)
- 11.2.10 Agroindustrial Rueda
- 11.2.10.1. Overview
- 11.2.10.2. Products
- 11.2.10.3. SWOT Analysis
- 11.2.10.4. Recent Developments
- 11.2.10.5. Financials (Based on Availability)
- 11.2.1 Cargill
List of Figures
- Figure 1: Global Rice Trade Analysis Revenue Breakdown (Million, %) by Region 2025 & 2033
- Figure 2: Global Rice Trade Analysis Volume Breakdown (Kiloton, %) by Region 2025 & 2033
- Figure 3: North America Rice Trade Analysis Revenue (Million), by Production Analysis 2025 & 2033
- Figure 4: North America Rice Trade Analysis Volume (Kiloton), by Production Analysis 2025 & 2033
- Figure 5: North America Rice Trade Analysis Revenue Share (%), by Production Analysis 2025 & 2033
- Figure 6: North America Rice Trade Analysis Volume Share (%), by Production Analysis 2025 & 2033
- Figure 7: North America Rice Trade Analysis Revenue (Million), by Consumption Analysis 2025 & 2033
- Figure 8: North America Rice Trade Analysis Volume (Kiloton), by Consumption Analysis 2025 & 2033
- Figure 9: North America Rice Trade Analysis Revenue Share (%), by Consumption Analysis 2025 & 2033
- Figure 10: North America Rice Trade Analysis Volume Share (%), by Consumption Analysis 2025 & 2033
- Figure 11: North America Rice Trade Analysis Revenue (Million), by Import Market Analysis (Value & Volume) 2025 & 2033
- Figure 12: North America Rice Trade Analysis Volume (Kiloton), by Import Market Analysis (Value & Volume) 2025 & 2033
- Figure 13: North America Rice Trade Analysis Revenue Share (%), by Import Market Analysis (Value & Volume) 2025 & 2033
- Figure 14: North America Rice Trade Analysis Volume Share (%), by Import Market Analysis (Value & Volume) 2025 & 2033
- Figure 15: North America Rice Trade Analysis Revenue (Million), by Export Market Analysis (Value & Volume) 2025 & 2033
- Figure 16: North America Rice Trade Analysis Volume (Kiloton), by Export Market Analysis (Value & Volume) 2025 & 2033
- Figure 17: North America Rice Trade Analysis Revenue Share (%), by Export Market Analysis (Value & Volume) 2025 & 2033
- Figure 18: North America Rice Trade Analysis Volume Share (%), by Export Market Analysis (Value & Volume) 2025 & 2033
- Figure 19: North America Rice Trade Analysis Revenue (Million), by Price Trend Analysis 2025 & 2033
- Figure 20: North America Rice Trade Analysis Volume (Kiloton), by Price Trend Analysis 2025 & 2033
- Figure 21: North America Rice Trade Analysis Revenue Share (%), by Price Trend Analysis 2025 & 2033
- Figure 22: North America Rice Trade Analysis Volume Share (%), by Price Trend Analysis 2025 & 2033
- Figure 23: North America Rice Trade Analysis Revenue (Million), by Country 2025 & 2033
- Figure 24: North America Rice Trade Analysis Volume (Kiloton), by Country 2025 & 2033
- Figure 25: North America Rice Trade Analysis Revenue Share (%), by Country 2025 & 2033
- Figure 26: North America Rice Trade Analysis Volume Share (%), by Country 2025 & 2033
- Figure 27: Europe Rice Trade Analysis Revenue (Million), by Production Analysis 2025 & 2033
- Figure 28: Europe Rice Trade Analysis Volume (Kiloton), by Production Analysis 2025 & 2033
- Figure 29: Europe Rice Trade Analysis Revenue Share (%), by Production Analysis 2025 & 2033
- Figure 30: Europe Rice Trade Analysis Volume Share (%), by Production Analysis 2025 & 2033
- Figure 31: Europe Rice Trade Analysis Revenue (Million), by Consumption Analysis 2025 & 2033
- Figure 32: Europe Rice Trade Analysis Volume (Kiloton), by Consumption Analysis 2025 & 2033
- Figure 33: Europe Rice Trade Analysis Revenue Share (%), by Consumption Analysis 2025 & 2033
- Figure 34: Europe Rice Trade Analysis Volume Share (%), by Consumption Analysis 2025 & 2033
- Figure 35: Europe Rice Trade Analysis Revenue (Million), by Import Market Analysis (Value & Volume) 2025 & 2033
- Figure 36: Europe Rice Trade Analysis Volume (Kiloton), by Import Market Analysis (Value & Volume) 2025 & 2033
- Figure 37: Europe Rice Trade Analysis Revenue Share (%), by Import Market Analysis (Value & Volume) 2025 & 2033
- Figure 38: Europe Rice Trade Analysis Volume Share (%), by Import Market Analysis (Value & Volume) 2025 & 2033
- Figure 39: Europe Rice Trade Analysis Revenue (Million), by Export Market Analysis (Value & Volume) 2025 & 2033
- Figure 40: Europe Rice Trade Analysis Volume (Kiloton), by Export Market Analysis (Value & Volume) 2025 & 2033
- Figure 41: Europe Rice Trade Analysis Revenue Share (%), by Export Market Analysis (Value & Volume) 2025 & 2033
- Figure 42: Europe Rice Trade Analysis Volume Share (%), by Export Market Analysis (Value & Volume) 2025 & 2033
- Figure 43: Europe Rice Trade Analysis Revenue (Million), by Price Trend Analysis 2025 & 2033
- Figure 44: Europe Rice Trade Analysis Volume (Kiloton), by Price Trend Analysis 2025 & 2033
- Figure 45: Europe Rice Trade Analysis Revenue Share (%), by Price Trend Analysis 2025 & 2033
- Figure 46: Europe Rice Trade Analysis Volume Share (%), by Price Trend Analysis 2025 & 2033
- Figure 47: Europe Rice Trade Analysis Revenue (Million), by Country 2025 & 2033
- Figure 48: Europe Rice Trade Analysis Volume (Kiloton), by Country 2025 & 2033
- Figure 49: Europe Rice Trade Analysis Revenue Share (%), by Country 2025 & 2033
- Figure 50: Europe Rice Trade Analysis Volume Share (%), by Country 2025 & 2033
- Figure 51: Asia Pacific Rice Trade Analysis Revenue (Million), by Production Analysis 2025 & 2033
- Figure 52: Asia Pacific Rice Trade Analysis Volume (Kiloton), by Production Analysis 2025 & 2033
- Figure 53: Asia Pacific Rice Trade Analysis Revenue Share (%), by Production Analysis 2025 & 2033
- Figure 54: Asia Pacific Rice Trade Analysis Volume Share (%), by Production Analysis 2025 & 2033
- Figure 55: Asia Pacific Rice Trade Analysis Revenue (Million), by Consumption Analysis 2025 & 2033
- Figure 56: Asia Pacific Rice Trade Analysis Volume (Kiloton), by Consumption Analysis 2025 & 2033
- Figure 57: Asia Pacific Rice Trade Analysis Revenue Share (%), by Consumption Analysis 2025 & 2033
- Figure 58: Asia Pacific Rice Trade Analysis Volume Share (%), by Consumption Analysis 2025 & 2033
- Figure 59: Asia Pacific Rice Trade Analysis Revenue (Million), by Import Market Analysis (Value & Volume) 2025 & 2033
- Figure 60: Asia Pacific Rice Trade Analysis Volume (Kiloton), by Import Market Analysis (Value & Volume) 2025 & 2033
- Figure 61: Asia Pacific Rice Trade Analysis Revenue Share (%), by Import Market Analysis (Value & Volume) 2025 & 2033
- Figure 62: Asia Pacific Rice Trade Analysis Volume Share (%), by Import Market Analysis (Value & Volume) 2025 & 2033
- Figure 63: Asia Pacific Rice Trade Analysis Revenue (Million), by Export Market Analysis (Value & Volume) 2025 & 2033
- Figure 64: Asia Pacific Rice Trade Analysis Volume (Kiloton), by Export Market Analysis (Value & Volume) 2025 & 2033
- Figure 65: Asia Pacific Rice Trade Analysis Revenue Share (%), by Export Market Analysis (Value & Volume) 2025 & 2033
- Figure 66: Asia Pacific Rice Trade Analysis Volume Share (%), by Export Market Analysis (Value & Volume) 2025 & 2033
- Figure 67: Asia Pacific Rice Trade Analysis Revenue (Million), by Price Trend Analysis 2025 & 2033
- Figure 68: Asia Pacific Rice Trade Analysis Volume (Kiloton), by Price Trend Analysis 2025 & 2033
- Figure 69: Asia Pacific Rice Trade Analysis Revenue Share (%), by Price Trend Analysis 2025 & 2033
- Figure 70: Asia Pacific Rice Trade Analysis Volume Share (%), by Price Trend Analysis 2025 & 2033
- Figure 71: Asia Pacific Rice Trade Analysis Revenue (Million), by Country 2025 & 2033
- Figure 72: Asia Pacific Rice Trade Analysis Volume (Kiloton), by Country 2025 & 2033
- Figure 73: Asia Pacific Rice Trade Analysis Revenue Share (%), by Country 2025 & 2033
- Figure 74: Asia Pacific Rice Trade Analysis Volume Share (%), by Country 2025 & 2033
- Figure 75: South America Rice Trade Analysis Revenue (Million), by Production Analysis 2025 & 2033
- Figure 76: South America Rice Trade Analysis Volume (Kiloton), by Production Analysis 2025 & 2033
- Figure 77: South America Rice Trade Analysis Revenue Share (%), by Production Analysis 2025 & 2033
- Figure 78: South America Rice Trade Analysis Volume Share (%), by Production Analysis 2025 & 2033
- Figure 79: South America Rice Trade Analysis Revenue (Million), by Consumption Analysis 2025 & 2033
- Figure 80: South America Rice Trade Analysis Volume (Kiloton), by Consumption Analysis 2025 & 2033
- Figure 81: South America Rice Trade Analysis Revenue Share (%), by Consumption Analysis 2025 & 2033
- Figure 82: South America Rice Trade Analysis Volume Share (%), by Consumption Analysis 2025 & 2033
- Figure 83: South America Rice Trade Analysis Revenue (Million), by Import Market Analysis (Value & Volume) 2025 & 2033
- Figure 84: South America Rice Trade Analysis Volume (Kiloton), by Import Market Analysis (Value & Volume) 2025 & 2033
- Figure 85: South America Rice Trade Analysis Revenue Share (%), by Import Market Analysis (Value & Volume) 2025 & 2033
- Figure 86: South America Rice Trade Analysis Volume Share (%), by Import Market Analysis (Value & Volume) 2025 & 2033
- Figure 87: South America Rice Trade Analysis Revenue (Million), by Export Market Analysis (Value & Volume) 2025 & 2033
- Figure 88: South America Rice Trade Analysis Volume (Kiloton), by Export Market Analysis (Value & Volume) 2025 & 2033
- Figure 89: South America Rice Trade Analysis Revenue Share (%), by Export Market Analysis (Value & Volume) 2025 & 2033
- Figure 90: South America Rice Trade Analysis Volume Share (%), by Export Market Analysis (Value & Volume) 2025 & 2033
- Figure 91: South America Rice Trade Analysis Revenue (Million), by Price Trend Analysis 2025 & 2033
- Figure 92: South America Rice Trade Analysis Volume (Kiloton), by Price Trend Analysis 2025 & 2033
- Figure 93: South America Rice Trade Analysis Revenue Share (%), by Price Trend Analysis 2025 & 2033
- Figure 94: South America Rice Trade Analysis Volume Share (%), by Price Trend Analysis 2025 & 2033
- Figure 95: South America Rice Trade Analysis Revenue (Million), by Country 2025 & 2033
- Figure 96: South America Rice Trade Analysis Volume (Kiloton), by Country 2025 & 2033
- Figure 97: South America Rice Trade Analysis Revenue Share (%), by Country 2025 & 2033
- Figure 98: South America Rice Trade Analysis Volume Share (%), by Country 2025 & 2033
- Figure 99: Africa Rice Trade Analysis Revenue (Million), by Production Analysis 2025 & 2033
- Figure 100: Africa Rice Trade Analysis Volume (Kiloton), by Production Analysis 2025 & 2033
- Figure 101: Africa Rice Trade Analysis Revenue Share (%), by Production Analysis 2025 & 2033
- Figure 102: Africa Rice Trade Analysis Volume Share (%), by Production Analysis 2025 & 2033
- Figure 103: Africa Rice Trade Analysis Revenue (Million), by Consumption Analysis 2025 & 2033
- Figure 104: Africa Rice Trade Analysis Volume (Kiloton), by Consumption Analysis 2025 & 2033
- Figure 105: Africa Rice Trade Analysis Revenue Share (%), by Consumption Analysis 2025 & 2033
- Figure 106: Africa Rice Trade Analysis Volume Share (%), by Consumption Analysis 2025 & 2033
- Figure 107: Africa Rice Trade Analysis Revenue (Million), by Import Market Analysis (Value & Volume) 2025 & 2033
- Figure 108: Africa Rice Trade Analysis Volume (Kiloton), by Import Market Analysis (Value & Volume) 2025 & 2033
- Figure 109: Africa Rice Trade Analysis Revenue Share (%), by Import Market Analysis (Value & Volume) 2025 & 2033
- Figure 110: Africa Rice Trade Analysis Volume Share (%), by Import Market Analysis (Value & Volume) 2025 & 2033
- Figure 111: Africa Rice Trade Analysis Revenue (Million), by Export Market Analysis (Value & Volume) 2025 & 2033
- Figure 112: Africa Rice Trade Analysis Volume (Kiloton), by Export Market Analysis (Value & Volume) 2025 & 2033
- Figure 113: Africa Rice Trade Analysis Revenue Share (%), by Export Market Analysis (Value & Volume) 2025 & 2033
- Figure 114: Africa Rice Trade Analysis Volume Share (%), by Export Market Analysis (Value & Volume) 2025 & 2033
- Figure 115: Africa Rice Trade Analysis Revenue (Million), by Price Trend Analysis 2025 & 2033
- Figure 116: Africa Rice Trade Analysis Volume (Kiloton), by Price Trend Analysis 2025 & 2033
- Figure 117: Africa Rice Trade Analysis Revenue Share (%), by Price Trend Analysis 2025 & 2033
- Figure 118: Africa Rice Trade Analysis Volume Share (%), by Price Trend Analysis 2025 & 2033
- Figure 119: Africa Rice Trade Analysis Revenue (Million), by Country 2025 & 2033
- Figure 120: Africa Rice Trade Analysis Volume (Kiloton), by Country 2025 & 2033
- Figure 121: Africa Rice Trade Analysis Revenue Share (%), by Country 2025 & 2033
- Figure 122: Africa Rice Trade Analysis Volume Share (%), by Country 2025 & 2033
List of Tables
- Table 1: Global Rice Trade Analysis Revenue Million Forecast, by Production Analysis 2020 & 2033
- Table 2: Global Rice Trade Analysis Volume Kiloton Forecast, by Production Analysis 2020 & 2033
- Table 3: Global Rice Trade Analysis Revenue Million Forecast, by Consumption Analysis 2020 & 2033
- Table 4: Global Rice Trade Analysis Volume Kiloton Forecast, by Consumption Analysis 2020 & 2033
- Table 5: Global Rice Trade Analysis Revenue Million Forecast, by Import Market Analysis (Value & Volume) 2020 & 2033
- Table 6: Global Rice Trade Analysis Volume Kiloton Forecast, by Import Market Analysis (Value & Volume) 2020 & 2033
- Table 7: Global Rice Trade Analysis Revenue Million Forecast, by Export Market Analysis (Value & Volume) 2020 & 2033
- Table 8: Global Rice Trade Analysis Volume Kiloton Forecast, by Export Market Analysis (Value & Volume) 2020 & 2033
- Table 9: Global Rice Trade Analysis Revenue Million Forecast, by Price Trend Analysis 2020 & 2033
- Table 10: Global Rice Trade Analysis Volume Kiloton Forecast, by Price Trend Analysis 2020 & 2033
- Table 11: Global Rice Trade Analysis Revenue Million Forecast, by Region 2020 & 2033
- Table 12: Global Rice Trade Analysis Volume Kiloton Forecast, by Region 2020 & 2033
- Table 13: Global Rice Trade Analysis Revenue Million Forecast, by Production Analysis 2020 & 2033
- Table 14: Global Rice Trade Analysis Volume Kiloton Forecast, by Production Analysis 2020 & 2033
- Table 15: Global Rice Trade Analysis Revenue Million Forecast, by Consumption Analysis 2020 & 2033
- Table 16: Global Rice Trade Analysis Volume Kiloton Forecast, by Consumption Analysis 2020 & 2033
- Table 17: Global Rice Trade Analysis Revenue Million Forecast, by Import Market Analysis (Value & Volume) 2020 & 2033
- Table 18: Global Rice Trade Analysis Volume Kiloton Forecast, by Import Market Analysis (Value & Volume) 2020 & 2033
- Table 19: Global Rice Trade Analysis Revenue Million Forecast, by Export Market Analysis (Value & Volume) 2020 & 2033
- Table 20: Global Rice Trade Analysis Volume Kiloton Forecast, by Export Market Analysis (Value & Volume) 2020 & 2033
- Table 21: Global Rice Trade Analysis Revenue Million Forecast, by Price Trend Analysis 2020 & 2033
- Table 22: Global Rice Trade Analysis Volume Kiloton Forecast, by Price Trend Analysis 2020 & 2033
- Table 23: Global Rice Trade Analysis Revenue Million Forecast, by Country 2020 & 2033
- Table 24: Global Rice Trade Analysis Volume Kiloton Forecast, by Country 2020 & 2033
- Table 25: United States Rice Trade Analysis Revenue (Million) Forecast, by Application 2020 & 2033
- Table 26: United States Rice Trade Analysis Volume (Kiloton) Forecast, by Application 2020 & 2033
- Table 27: Canada Rice Trade Analysis Revenue (Million) Forecast, by Application 2020 & 2033
- Table 28: Canada Rice Trade Analysis Volume (Kiloton) Forecast, by Application 2020 & 2033
- Table 29: Global Rice Trade Analysis Revenue Million Forecast, by Production Analysis 2020 & 2033
- Table 30: Global Rice Trade Analysis Volume Kiloton Forecast, by Production Analysis 2020 & 2033
- Table 31: Global Rice Trade Analysis Revenue Million Forecast, by Consumption Analysis 2020 & 2033
- Table 32: Global Rice Trade Analysis Volume Kiloton Forecast, by Consumption Analysis 2020 & 2033
- Table 33: Global Rice Trade Analysis Revenue Million Forecast, by Import Market Analysis (Value & Volume) 2020 & 2033
- Table 34: Global Rice Trade Analysis Volume Kiloton Forecast, by Import Market Analysis (Value & Volume) 2020 & 2033
- Table 35: Global Rice Trade Analysis Revenue Million Forecast, by Export Market Analysis (Value & Volume) 2020 & 2033
- Table 36: Global Rice Trade Analysis Volume Kiloton Forecast, by Export Market Analysis (Value & Volume) 2020 & 2033
- Table 37: Global Rice Trade Analysis Revenue Million Forecast, by Price Trend Analysis 2020 & 2033
- Table 38: Global Rice Trade Analysis Volume Kiloton Forecast, by Price Trend Analysis 2020 & 2033
- Table 39: Global Rice Trade Analysis Revenue Million Forecast, by Country 2020 & 2033
- Table 40: Global Rice Trade Analysis Volume Kiloton Forecast, by Country 2020 & 2033
- Table 41: France Rice Trade Analysis Revenue (Million) Forecast, by Application 2020 & 2033
- Table 42: France Rice Trade Analysis Volume (Kiloton) Forecast, by Application 2020 & 2033
- Table 43: United Kingdom Rice Trade Analysis Revenue (Million) Forecast, by Application 2020 & 2033
- Table 44: United Kingdom Rice Trade Analysis Volume (Kiloton) Forecast, by Application 2020 & 2033
- Table 45: Germany Rice Trade Analysis Revenue (Million) Forecast, by Application 2020 & 2033
- Table 46: Germany Rice Trade Analysis Volume (Kiloton) Forecast, by Application 2020 & 2033
- Table 47: Italy Rice Trade Analysis Revenue (Million) Forecast, by Application 2020 & 2033
- Table 48: Italy Rice Trade Analysis Volume (Kiloton) Forecast, by Application 2020 & 2033
- Table 49: Spain Rice Trade Analysis Revenue (Million) Forecast, by Application 2020 & 2033
- Table 50: Spain Rice Trade Analysis Volume (Kiloton) Forecast, by Application 2020 & 2033
- Table 51: Global Rice Trade Analysis Revenue Million Forecast, by Production Analysis 2020 & 2033
- Table 52: Global Rice Trade Analysis Volume Kiloton Forecast, by Production Analysis 2020 & 2033
- Table 53: Global Rice Trade Analysis Revenue Million Forecast, by Consumption Analysis 2020 & 2033
- Table 54: Global Rice Trade Analysis Volume Kiloton Forecast, by Consumption Analysis 2020 & 2033
- Table 55: Global Rice Trade Analysis Revenue Million Forecast, by Import Market Analysis (Value & Volume) 2020 & 2033
- Table 56: Global Rice Trade Analysis Volume Kiloton Forecast, by Import Market Analysis (Value & Volume) 2020 & 2033
- Table 57: Global Rice Trade Analysis Revenue Million Forecast, by Export Market Analysis (Value & Volume) 2020 & 2033
- Table 58: Global Rice Trade Analysis Volume Kiloton Forecast, by Export Market Analysis (Value & Volume) 2020 & 2033
- Table 59: Global Rice Trade Analysis Revenue Million Forecast, by Price Trend Analysis 2020 & 2033
- Table 60: Global Rice Trade Analysis Volume Kiloton Forecast, by Price Trend Analysis 2020 & 2033
- Table 61: Global Rice Trade Analysis Revenue Million Forecast, by Country 2020 & 2033
- Table 62: Global Rice Trade Analysis Volume Kiloton Forecast, by Country 2020 & 2033
- Table 63: China Rice Trade Analysis Revenue (Million) Forecast, by Application 2020 & 2033
- Table 64: China Rice Trade Analysis Volume (Kiloton) Forecast, by Application 2020 & 2033
- Table 65: India Rice Trade Analysis Revenue (Million) Forecast, by Application 2020 & 2033
- Table 66: India Rice Trade Analysis Volume (Kiloton) Forecast, by Application 2020 & 2033
- Table 67: Thailand Rice Trade Analysis Revenue (Million) Forecast, by Application 2020 & 2033
- Table 68: Thailand Rice Trade Analysis Volume (Kiloton) Forecast, by Application 2020 & 2033
- Table 69: Vietnam Rice Trade Analysis Revenue (Million) Forecast, by Application 2020 & 2033
- Table 70: Vietnam Rice Trade Analysis Volume (Kiloton) Forecast, by Application 2020 & 2033
- Table 71: Pakistan Rice Trade Analysis Revenue (Million) Forecast, by Application 2020 & 2033
- Table 72: Pakistan Rice Trade Analysis Volume (Kiloton) Forecast, by Application 2020 & 2033
- Table 73: Global Rice Trade Analysis Revenue Million Forecast, by Production Analysis 2020 & 2033
- Table 74: Global Rice Trade Analysis Volume Kiloton Forecast, by Production Analysis 2020 & 2033
- Table 75: Global Rice Trade Analysis Revenue Million Forecast, by Consumption Analysis 2020 & 2033
- Table 76: Global Rice Trade Analysis Volume Kiloton Forecast, by Consumption Analysis 2020 & 2033
- Table 77: Global Rice Trade Analysis Revenue Million Forecast, by Import Market Analysis (Value & Volume) 2020 & 2033
- Table 78: Global Rice Trade Analysis Volume Kiloton Forecast, by Import Market Analysis (Value & Volume) 2020 & 2033
- Table 79: Global Rice Trade Analysis Revenue Million Forecast, by Export Market Analysis (Value & Volume) 2020 & 2033
- Table 80: Global Rice Trade Analysis Volume Kiloton Forecast, by Export Market Analysis (Value & Volume) 2020 & 2033
- Table 81: Global Rice Trade Analysis Revenue Million Forecast, by Price Trend Analysis 2020 & 2033
- Table 82: Global Rice Trade Analysis Volume Kiloton Forecast, by Price Trend Analysis 2020 & 2033
- Table 83: Global Rice Trade Analysis Revenue Million Forecast, by Country 2020 & 2033
- Table 84: Global Rice Trade Analysis Volume Kiloton Forecast, by Country 2020 & 2033
- Table 85: Brazil Rice Trade Analysis Revenue (Million) Forecast, by Application 2020 & 2033
- Table 86: Brazil Rice Trade Analysis Volume (Kiloton) Forecast, by Application 2020 & 2033
- Table 87: Argentina Rice Trade Analysis Revenue (Million) Forecast, by Application 2020 & 2033
- Table 88: Argentina Rice Trade Analysis Volume (Kiloton) Forecast, by Application 2020 & 2033
- Table 89: Global Rice Trade Analysis Revenue Million Forecast, by Production Analysis 2020 & 2033
- Table 90: Global Rice Trade Analysis Volume Kiloton Forecast, by Production Analysis 2020 & 2033
- Table 91: Global Rice Trade Analysis Revenue Million Forecast, by Consumption Analysis 2020 & 2033
- Table 92: Global Rice Trade Analysis Volume Kiloton Forecast, by Consumption Analysis 2020 & 2033
- Table 93: Global Rice Trade Analysis Revenue Million Forecast, by Import Market Analysis (Value & Volume) 2020 & 2033
- Table 94: Global Rice Trade Analysis Volume Kiloton Forecast, by Import Market Analysis (Value & Volume) 2020 & 2033
- Table 95: Global Rice Trade Analysis Revenue Million Forecast, by Export Market Analysis (Value & Volume) 2020 & 2033
- Table 96: Global Rice Trade Analysis Volume Kiloton Forecast, by Export Market Analysis (Value & Volume) 2020 & 2033
- Table 97: Global Rice Trade Analysis Revenue Million Forecast, by Price Trend Analysis 2020 & 2033
- Table 98: Global Rice Trade Analysis Volume Kiloton Forecast, by Price Trend Analysis 2020 & 2033
- Table 99: Global Rice Trade Analysis Revenue Million Forecast, by Country 2020 & 2033
- Table 100: Global Rice Trade Analysis Volume Kiloton Forecast, by Country 2020 & 2033
- Table 101: South Africa Rice Trade Analysis Revenue (Million) Forecast, by Application 2020 & 2033
- Table 102: South Africa Rice Trade Analysis Volume (Kiloton) Forecast, by Application 2020 & 2033
Frequently Asked Questions
1. What is the projected Compound Annual Growth Rate (CAGR) of the Rice Trade Analysis?
The projected CAGR is approximately 2.20%.
2. Which companies are prominent players in the Rice Trade Analysis?
Key companies in the market include Cargill , Adani Wilmar , Jindal Saw , Canary Foods , Agroindustrias del Sur, Saurer , KRBL Ltd , Vigoro , Thai Binh Rice , Agroindustrial Rueda .
3. What are the main segments of the Rice Trade Analysis?
The market segments include Production Analysis, Consumption Analysis, Import Market Analysis (Value & Volume), Export Market Analysis (Value & Volume), Price Trend Analysis.
4. Can you provide details about the market size?
The market size is estimated to be USD 306.38 Million as of 2022.
5. What are some drivers contributing to market growth?
N/A
6. What are the notable trends driving market growth?
Favorable Trade Policies.
7. Are there any restraints impacting market growth?
N/A
8. Can you provide examples of recent developments in the market?
September 2022: India banned the export of broken rice, and a 20% export duty was imposed on non-basmati rice. This is the first ban by India after the 2011 ban on non-basmati rice for three years.
9. What pricing options are available for accessing the report?
Pricing options include single-user, multi-user, and enterprise licenses priced at USD 4750, USD 5250, and USD 8750 respectively.
10. Is the market size provided in terms of value or volume?
The market size is provided in terms of value, measured in Million and volume, measured in Kiloton.
11. Are there any specific market keywords associated with the report?
Yes, the market keyword associated with the report is "Rice Trade Analysis," which aids in identifying and referencing the specific market segment covered.
12. How do I determine which pricing option suits my needs best?
The pricing options vary based on user requirements and access needs. Individual users may opt for single-user licenses, while businesses requiring broader access may choose multi-user or enterprise licenses for cost-effective access to the report.
13. Are there any additional resources or data provided in the Rice Trade Analysis report?
While the report offers comprehensive insights, it's advisable to review the specific contents or supplementary materials provided to ascertain if additional resources or data are available.
14. How can I stay updated on further developments or reports in the Rice Trade Analysis?
To stay informed about further developments, trends, and reports in the Rice Trade Analysis, consider subscribing to industry newsletters, following relevant companies and organizations, or regularly checking reputable industry news sources and publications.
Methodology
Step 1 - Identification of Relevant Samples Size from Population Database


Step 2 - Approaches for Defining Global Market Size (Value, Volume* & Price*)

Note*: In applicable scenarios
Step 3 - Data Sources
Primary Research
- Web Analytics
- Survey Reports
- Research Institute
- Latest Research Reports
- Opinion Leaders
Secondary Research
- Annual Reports
- White Paper
- Latest Press Release
- Industry Association
- Paid Database
- Investor Presentations

Step 4 - Data Triangulation
Involves using different sources of information in order to increase the validity of a study
These sources are likely to be stakeholders in a program - participants, other researchers, program staff, other community members, and so on.
Then we put all data in single framework & apply various statistical tools to find out the dynamic on the market.
During the analysis stage, feedback from the stakeholder groups would be compared to determine areas of agreement as well as areas of divergence