

Key Insights
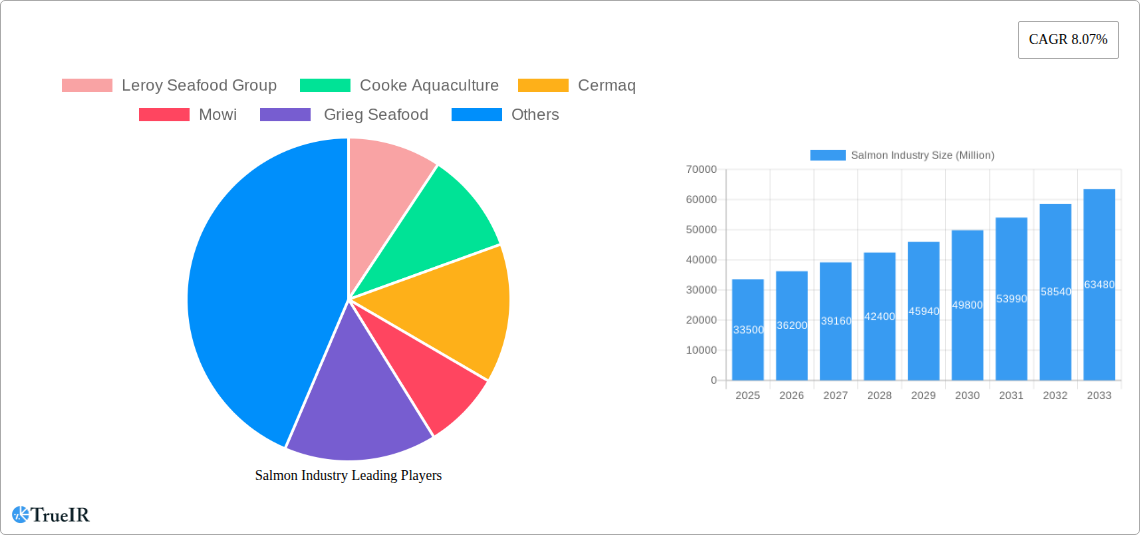
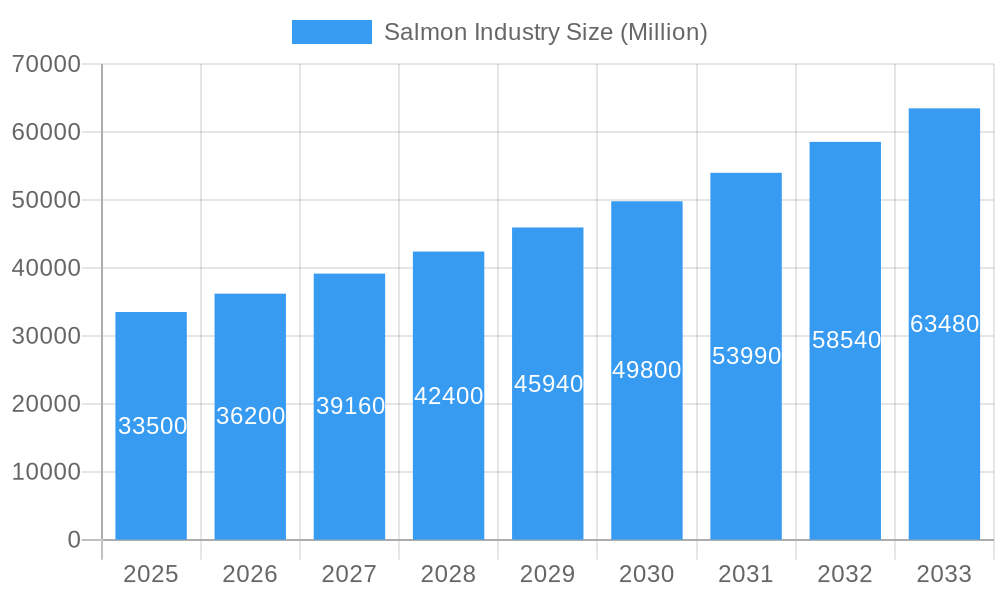
The global salmon industry, valued at $33.5 billion in 2025, is projected to experience robust growth, driven by increasing consumer demand for healthy protein sources and the rising popularity of sustainable seafood options. The compound annual growth rate (CAGR) of 8.07% from 2025 to 2033 indicates a significant expansion of the market. Key drivers include rising disposable incomes in developing economies, leading to increased seafood consumption, and advancements in aquaculture techniques resulting in higher production yields and improved product quality. Furthermore, the growing awareness of the health benefits associated with omega-3 fatty acids found in salmon is fueling demand. Market segmentation reveals a strong preference for farmed salmon, particularly Atlantic salmon, accounting for a significant portion of the total volume due to its accessibility and consistent supply. However, the wild-caught segment maintains a niche market for consumers seeking premium quality and a perceived higher nutritional value. Geographical distribution shows strong regional variations, with North America and Europe representing major markets, followed by Asia-Pacific and South America. Emerging markets in Asia-Pacific and MEA are expected to contribute significantly to future growth, driven by rising middle classes and increased purchasing power.
Salmon Industry Market Size (In Billion)
While the industry faces challenges such as fluctuating fish prices, potential environmental concerns regarding aquaculture practices, and disease outbreaks, ongoing innovations in sustainable aquaculture, traceability initiatives, and the development of disease-resistant salmon strains are mitigating these risks. The industry's response to these challenges, coupled with the persistent consumer demand, assures a promising future trajectory for growth and profitability. Competition among major players like Leroy Seafood Group, Cooke Aquaculture, Cermaq, Mowi, and Grieg Seafood is expected to remain intense, with a focus on efficiency improvements, product differentiation, and expansion into new markets. This competitive landscape will likely fuel further innovation and ensure the continued supply of high-quality salmon to a growing global consumer base.
Salmon Industry Company Market Share
Salmon Industry Market Report: 2019-2033
This comprehensive report provides a detailed analysis of the global salmon industry, projecting a market value exceeding $XX Million by 2033. We delve into market structure, competitive dynamics, key segments (Farmed and Wild Captured), species-specific trends (Atlantic Salmon, Coho Salmon, Masu Salmon, Chinook Salmon, and Other Species Types), and future growth opportunities. The report covers the historical period (2019-2024), the base year (2025), and forecasts from 2025 to 2033, offering invaluable insights for industry stakeholders, investors, and researchers. Key players like Leroy Seafood Group, Cooke Aquaculture, Cermaq, Mowi, and Grieg Seafood are analyzed for their market positioning and strategic moves.
Salmon Industry Market Structure & Competitive Landscape
The global salmon market is characterized by a moderately concentrated structure, with a few dominant players shaping its dynamics. The top five leading companies—Leroy Seafood Group, Cooke Aquaculture, Cermaq, Mowi, and Grieg Seafood—collectively command a significant market share, estimated to be around XX%. This industry is propelled by continuous innovation across several fronts, including advanced farming techniques, sophisticated selective breeding programs, and a strong emphasis on sustainable practices. These advancements are directly influenced by escalating consumer demand for premium-quality salmon that is responsibly sourced. Furthermore, the operational landscape and profitability are significantly shaped by robust regulatory frameworks governing both aquaculture and wild-caught fishing. While competition from alternative protein sources exists, salmon's inherent appeal, stemming from its distinctive flavor and exceptional nutritional profile, ensures its enduring consumer preference. The end-user market is segmented into retail, food service, and processing sectors, each exhibiting unique purchasing behaviors and price sensitivities. Mergers and acquisitions (M&A) have played a moderate role in recent years, with approximately XX transactions valued at $XX Million recorded between 2019 and 2024. This activity has primarily been driven by strategic consolidation efforts and ambitious expansion into emerging markets.
- Concentration Ratio (CR5): XX%
- M&A Volume (2019-2024): XX transactions
- M&A Value (2019-2024): $XX Million
- Key Innovation Drivers: Sustainable aquaculture techniques, genetic improvement for enhanced traits, and advanced processing technologies.
- Regulatory Impacts: Stringent environmental regulations, evolving fishing quotas, and comprehensive food safety standards.
- Product Substitutes: Other commercially valuable fish species, and a growing range of plant-based protein alternatives.
Salmon Industry Market Trends & Opportunities
The global salmon market is projected to experience robust growth, with a Compound Annual Growth Rate (CAGR) of XX% during the forecast period (2025-2033). This growth is propelled by rising global demand fueled by increasing consumer awareness of salmon's health benefits and its versatility in culinary applications. Technological advancements in aquaculture, such as recirculating aquaculture systems (RAS) and improved feed formulations, are enhancing efficiency and sustainability. Consumer preferences are shifting towards sustainably sourced and responsibly farmed salmon, creating opportunities for companies that prioritize ethical and environmental practices. Competitive dynamics are increasingly influenced by factors like brand reputation, price competitiveness, and the ability to meet the growing demand for traceable and certified products. Market penetration rates for farmed salmon are consistently high in key markets, exceeding XX% in several regions.
Dominant Markets & Segments in Salmon Industry
The largest market segment is Farmed Salmon, accounting for approximately XX% of the total market value in 2025. Atlantic Salmon dominates the species segment, representing over XX% of total production. Norway and Chile remain leading producers, benefiting from favorable environmental conditions and established aquaculture infrastructure.
- Key Growth Drivers (Farmed Salmon):
- Technological advancements in aquaculture (RAS, automated feeding).
- Government support and investment in aquaculture infrastructure.
- Growing consumer demand for sustainably produced salmon.
- Key Growth Drivers (Norway):
- Established aquaculture infrastructure and expertise.
- Supportive regulatory environment.
- Access to advanced technologies and research.
- Key Growth Drivers (Chile):
- Favorable environmental conditions for salmon farming.
- Strong export capabilities.
- Government incentives for aquaculture development.
- Wild-Captured Salmon: While smaller than the farmed segment, this market segment is characterized by stringent regulations and sustainability concerns. The primary species is Atlantic Salmon, followed by Pacific Salmon species (Chinook, Coho, Masu).
Salmon Industry Product Analysis
Technological breakthroughs in selective breeding programs are continuously enhancing critical salmon quality attributes, including accelerated growth rates, robust disease resistance, and desirable flesh coloration. The escalating consumer desire for superior quality and intensely flavorful salmon serves as a powerful catalyst for product innovation. This innovation focuses on optimizing efficient processing methodologies, developing an array of value-added products (such as smoked, marinated, and ready-to-eat options), and creating advanced packaging solutions designed to extend shelf life while meticulously preserving product freshness. The ultimate competitive advantage in this dynamic market hinges on achieving a harmonious balance between exceptional quality, unwavering sustainability, and competitive affordability.
Key Drivers, Barriers & Challenges in Salmon Industry
Key Drivers: The persistent global growth in demand for protein-rich foods, coupled with significant technological advancements in aquaculture, and a heightened consumer awareness regarding the health benefits of salmon, collectively act as powerful market drivers. Additionally, supportive government initiatives aimed at promoting sustainable aquaculture practices further stimulate market expansion and investment.
Challenges: The industry grapples with persistent challenges, including the threat of disease outbreaks, volatile fluctuations in feed prices, growing environmental concerns associated with large-scale farming, and navigating complex and evolving regulatory landscapes. Sustaining responsible resource management and implementing continuous innovation are paramount to meeting the burgeoning demand while upholding environmental integrity. Furthermore, supply chain vulnerabilities, encompassing transportation and logistics intricacies, can significantly impact product availability and overall profitability. The overarching influence of climate change on wild salmon populations and the suitability of farming conditions necessitates the development and implementation of adaptive, forward-thinking strategies.
Growth Drivers in the Salmon Industry Market
Continued growth will be fueled by rising global protein demand, technological improvements in aquaculture, increasing consumer preference for healthy and sustainable seafood, and supportive government policies encouraging sustainable aquaculture practices.
Challenges Impacting Salmon Industry Growth
The salmon industry is currently navigating a landscape fraught with significant challenges. Recurring disease outbreaks have led to substantial production losses, estimated at $XX Million annually. The volatile nature of feed costs directly impacts profitability, with fluctuations potentially affecting margins by up to XX%. Moreover, increasingly stringent regulatory requirements necessitate higher compliance costs for producers. The long-term viability and operational stability are further threatened by the multifaceted impacts of climate change, including shifts in water temperature regimes and the increasing prevalence of ocean acidification, which pose significant risks to both wild salmon populations and established farming operations.
Key Players Shaping the Salmon Industry Market
Significant Salmon Industry Milestones
- 2020: Implementation of stricter environmental regulations in Norway.
- 2021: Launch of a new recirculating aquaculture system (RAS) technology by a major player.
- 2022: Significant M&A activity, with several smaller players acquired by larger companies.
- 2023: Increased focus on sustainable aquaculture certifications and traceability initiatives.
Future Outlook for Salmon Industry Market
The salmon industry is strategically positioned for sustained and robust growth, propelled by enduring strong consumer demand and the relentless pace of technological innovation. Success in the long term will be intrinsically linked to strategic investments in pioneering sustainable aquaculture practices, fostering innovative product development, and cultivating exceptionally efficient and resilient supply chain management systems. Significant opportunities are present in expanding market reach into new geographical territories, developing a diverse portfolio of value-added products, and strategically focusing on premium, sustainably sourced salmon offerings that cater to the evolving preferences of discerning consumers. Projections indicate that the market value is anticipated to surpass $XX Million by the year 2033.
Salmon Industry Segmentation
-
1. Species Type
- 1.1. Atlantic Salmon
- 1.2. Coho Salmon
- 1.3. Masu Salmon
- 1.4. Chinook Salmon
- 1.5. Other Species Types
-
2. Type
- 2.1. Farmed
- 2.2. Wild Captured
-
3. Species Type
- 3.1. Atlantic Salmon
- 3.2. Coho Salmon
- 3.3. Masu Salmon
- 3.4. Chinook Salmon
- 3.5. Other Species Types
-
4. Type
- 4.1. Farmed
- 4.2. Wild Captured
Salmon Industry Segmentation By Geography
-
1. North America
- 1.1. United States
- 1.2. Canada
-
2. Europe
- 2.1. Norway
- 2.2. Spain
- 2.3. Netherlands
- 2.4. France
- 2.5. Italy
- 2.6. Greece
- 2.7. United Kingdom
- 2.8. Scotland
-
3. Asia Pacific
- 3.1. China
- 3.2. Japan
- 3.3. Australia
-
4. South America
- 4.1. Chile
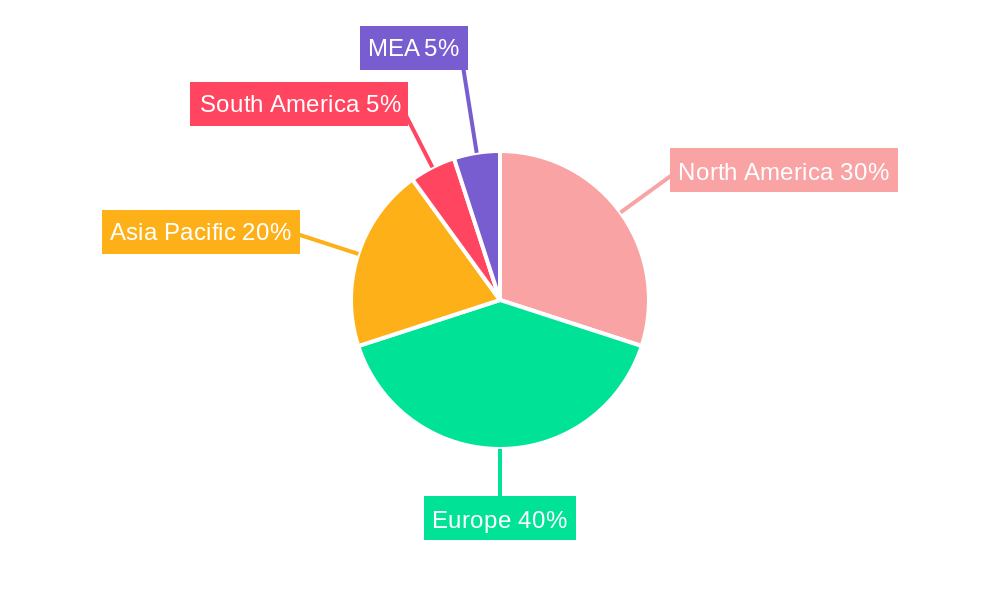
Salmon Industry Regional Market Share
Geographic Coverage of Salmon Industry
Salmon Industry REPORT HIGHLIGHTS
| Aspects | Details |
|---|---|
| Study Period | 2020-2034 |
| Base Year | 2025 |
| Estimated Year | 2026 |
| Forecast Period | 2026-2034 |
| Historical Period | 2020-2025 |
| Growth Rate | CAGR of 8.07% from 2020-2034 |
| Segmentation |
|
Table of Contents
- 1. Introduction
- 1.1. Research Scope
- 1.2. Market Segmentation
- 1.3. Research Methodology
- 1.4. Definitions and Assumptions
- 2. Executive Summary
- 2.1. Introduction
- 3. Market Dynamics
- 3.1. Introduction
- 3.2. Market Drivers
- 3.2.1. ; Awareness About Health Benefits Associated With Pecan Consumption; Wide Application of Pecan
- 3.3. Market Restrains
- 3.3.1. ; Volatility in the Prices; Adverse Weather Conditions Affecting Yield
- 3.4. Market Trends
- 3.4.1. Healthy Boost in the Salmon Production
- 4. Market Factor Analysis
- 4.1. Porters Five Forces
- 4.2. Supply/Value Chain
- 4.3. PESTEL analysis
- 4.4. Market Entropy
- 4.5. Patent/Trademark Analysis
- 5. Global Salmon Industry Analysis, Insights and Forecast, 2020-2032
- 5.1. Market Analysis, Insights and Forecast - by Species Type
- 5.1.1. Atlantic Salmon
- 5.1.2. Coho Salmon
- 5.1.3. Masu Salmon
- 5.1.4. Chinook Salmon
- 5.1.5. Other Species Types
- 5.2. Market Analysis, Insights and Forecast - by Type
- 5.2.1. Farmed
- 5.2.2. Wild Captured
- 5.3. Market Analysis, Insights and Forecast - by Species Type
- 5.3.1. Atlantic Salmon
- 5.3.2. Coho Salmon
- 5.3.3. Masu Salmon
- 5.3.4. Chinook Salmon
- 5.3.5. Other Species Types
- 5.4. Market Analysis, Insights and Forecast - by Type
- 5.4.1. Farmed
- 5.4.2. Wild Captured
- 5.5. Market Analysis, Insights and Forecast - by Region
- 5.5.1. North America
- 5.5.2. Europe
- 5.5.3. Asia Pacific
- 5.5.4. South America
- 5.1. Market Analysis, Insights and Forecast - by Species Type
- 6. North America Salmon Industry Analysis, Insights and Forecast, 2020-2032
- 6.1. Market Analysis, Insights and Forecast - by Species Type
- 6.1.1. Atlantic Salmon
- 6.1.2. Coho Salmon
- 6.1.3. Masu Salmon
- 6.1.4. Chinook Salmon
- 6.1.5. Other Species Types
- 6.2. Market Analysis, Insights and Forecast - by Type
- 6.2.1. Farmed
- 6.2.2. Wild Captured
- 6.3. Market Analysis, Insights and Forecast - by Species Type
- 6.3.1. Atlantic Salmon
- 6.3.2. Coho Salmon
- 6.3.3. Masu Salmon
- 6.3.4. Chinook Salmon
- 6.3.5. Other Species Types
- 6.4. Market Analysis, Insights and Forecast - by Type
- 6.4.1. Farmed
- 6.4.2. Wild Captured
- 6.1. Market Analysis, Insights and Forecast - by Species Type
- 7. Europe Salmon Industry Analysis, Insights and Forecast, 2020-2032
- 7.1. Market Analysis, Insights and Forecast - by Species Type
- 7.1.1. Atlantic Salmon
- 7.1.2. Coho Salmon
- 7.1.3. Masu Salmon
- 7.1.4. Chinook Salmon
- 7.1.5. Other Species Types
- 7.2. Market Analysis, Insights and Forecast - by Type
- 7.2.1. Farmed
- 7.2.2. Wild Captured
- 7.3. Market Analysis, Insights and Forecast - by Species Type
- 7.3.1. Atlantic Salmon
- 7.3.2. Coho Salmon
- 7.3.3. Masu Salmon
- 7.3.4. Chinook Salmon
- 7.3.5. Other Species Types
- 7.4. Market Analysis, Insights and Forecast - by Type
- 7.4.1. Farmed
- 7.4.2. Wild Captured
- 7.1. Market Analysis, Insights and Forecast - by Species Type
- 8. Asia Pacific Salmon Industry Analysis, Insights and Forecast, 2020-2032
- 8.1. Market Analysis, Insights and Forecast - by Species Type
- 8.1.1. Atlantic Salmon
- 8.1.2. Coho Salmon
- 8.1.3. Masu Salmon
- 8.1.4. Chinook Salmon
- 8.1.5. Other Species Types
- 8.2. Market Analysis, Insights and Forecast - by Type
- 8.2.1. Farmed
- 8.2.2. Wild Captured
- 8.3. Market Analysis, Insights and Forecast - by Species Type
- 8.3.1. Atlantic Salmon
- 8.3.2. Coho Salmon
- 8.3.3. Masu Salmon
- 8.3.4. Chinook Salmon
- 8.3.5. Other Species Types
- 8.4. Market Analysis, Insights and Forecast - by Type
- 8.4.1. Farmed
- 8.4.2. Wild Captured
- 8.1. Market Analysis, Insights and Forecast - by Species Type
- 9. South America Salmon Industry Analysis, Insights and Forecast, 2020-2032
- 9.1. Market Analysis, Insights and Forecast - by Species Type
- 9.1.1. Atlantic Salmon
- 9.1.2. Coho Salmon
- 9.1.3. Masu Salmon
- 9.1.4. Chinook Salmon
- 9.1.5. Other Species Types
- 9.2. Market Analysis, Insights and Forecast - by Type
- 9.2.1. Farmed
- 9.2.2. Wild Captured
- 9.3. Market Analysis, Insights and Forecast - by Species Type
- 9.3.1. Atlantic Salmon
- 9.3.2. Coho Salmon
- 9.3.3. Masu Salmon
- 9.3.4. Chinook Salmon
- 9.3.5. Other Species Types
- 9.4. Market Analysis, Insights and Forecast - by Type
- 9.4.1. Farmed
- 9.4.2. Wild Captured
- 9.1. Market Analysis, Insights and Forecast - by Species Type
- 10. Competitive Analysis
- 10.1. Global Market Share Analysis 2025
- 10.2. Company Profiles
- 10.2.1 Leroy Seafood Group
- 10.2.1.1. Overview
- 10.2.1.2. Products
- 10.2.1.3. SWOT Analysis
- 10.2.1.4. Recent Developments
- 10.2.1.5. Financials (Based on Availability)
- 10.2.2 Cooke Aquaculture
- 10.2.2.1. Overview
- 10.2.2.2. Products
- 10.2.2.3. SWOT Analysis
- 10.2.2.4. Recent Developments
- 10.2.2.5. Financials (Based on Availability)
- 10.2.3 Cermaq
- 10.2.3.1. Overview
- 10.2.3.2. Products
- 10.2.3.3. SWOT Analysis
- 10.2.3.4. Recent Developments
- 10.2.3.5. Financials (Based on Availability)
- 10.2.4 Mowi
- 10.2.4.1. Overview
- 10.2.4.2. Products
- 10.2.4.3. SWOT Analysis
- 10.2.4.4. Recent Developments
- 10.2.4.5. Financials (Based on Availability)
- 10.2.5 Grieg Seafood
- 10.2.5.1. Overview
- 10.2.5.2. Products
- 10.2.5.3. SWOT Analysis
- 10.2.5.4. Recent Developments
- 10.2.5.5. Financials (Based on Availability)
- 10.2.1 Leroy Seafood Group
List of Figures
- Figure 1: Global Salmon Industry Revenue Breakdown (Million, %) by Region 2025 & 2033
- Figure 2: North America Salmon Industry Revenue (Million), by Species Type 2025 & 2033
- Figure 3: North America Salmon Industry Revenue Share (%), by Species Type 2025 & 2033
- Figure 4: North America Salmon Industry Revenue (Million), by Type 2025 & 2033
- Figure 5: North America Salmon Industry Revenue Share (%), by Type 2025 & 2033
- Figure 6: North America Salmon Industry Revenue (Million), by Species Type 2025 & 2033
- Figure 7: North America Salmon Industry Revenue Share (%), by Species Type 2025 & 2033
- Figure 8: North America Salmon Industry Revenue (Million), by Type 2025 & 2033
- Figure 9: North America Salmon Industry Revenue Share (%), by Type 2025 & 2033
- Figure 10: North America Salmon Industry Revenue (Million), by Country 2025 & 2033
- Figure 11: North America Salmon Industry Revenue Share (%), by Country 2025 & 2033
- Figure 12: Europe Salmon Industry Revenue (Million), by Species Type 2025 & 2033
- Figure 13: Europe Salmon Industry Revenue Share (%), by Species Type 2025 & 2033
- Figure 14: Europe Salmon Industry Revenue (Million), by Type 2025 & 2033
- Figure 15: Europe Salmon Industry Revenue Share (%), by Type 2025 & 2033
- Figure 16: Europe Salmon Industry Revenue (Million), by Species Type 2025 & 2033
- Figure 17: Europe Salmon Industry Revenue Share (%), by Species Type 2025 & 2033
- Figure 18: Europe Salmon Industry Revenue (Million), by Type 2025 & 2033
- Figure 19: Europe Salmon Industry Revenue Share (%), by Type 2025 & 2033
- Figure 20: Europe Salmon Industry Revenue (Million), by Country 2025 & 2033
- Figure 21: Europe Salmon Industry Revenue Share (%), by Country 2025 & 2033
- Figure 22: Asia Pacific Salmon Industry Revenue (Million), by Species Type 2025 & 2033
- Figure 23: Asia Pacific Salmon Industry Revenue Share (%), by Species Type 2025 & 2033
- Figure 24: Asia Pacific Salmon Industry Revenue (Million), by Type 2025 & 2033
- Figure 25: Asia Pacific Salmon Industry Revenue Share (%), by Type 2025 & 2033
- Figure 26: Asia Pacific Salmon Industry Revenue (Million), by Species Type 2025 & 2033
- Figure 27: Asia Pacific Salmon Industry Revenue Share (%), by Species Type 2025 & 2033
- Figure 28: Asia Pacific Salmon Industry Revenue (Million), by Type 2025 & 2033
- Figure 29: Asia Pacific Salmon Industry Revenue Share (%), by Type 2025 & 2033
- Figure 30: Asia Pacific Salmon Industry Revenue (Million), by Country 2025 & 2033
- Figure 31: Asia Pacific Salmon Industry Revenue Share (%), by Country 2025 & 2033
- Figure 32: South America Salmon Industry Revenue (Million), by Species Type 2025 & 2033
- Figure 33: South America Salmon Industry Revenue Share (%), by Species Type 2025 & 2033
- Figure 34: South America Salmon Industry Revenue (Million), by Type 2025 & 2033
- Figure 35: South America Salmon Industry Revenue Share (%), by Type 2025 & 2033
- Figure 36: South America Salmon Industry Revenue (Million), by Species Type 2025 & 2033
- Figure 37: South America Salmon Industry Revenue Share (%), by Species Type 2025 & 2033
- Figure 38: South America Salmon Industry Revenue (Million), by Type 2025 & 2033
- Figure 39: South America Salmon Industry Revenue Share (%), by Type 2025 & 2033
- Figure 40: South America Salmon Industry Revenue (Million), by Country 2025 & 2033
- Figure 41: South America Salmon Industry Revenue Share (%), by Country 2025 & 2033
List of Tables
- Table 1: Global Salmon Industry Revenue Million Forecast, by Species Type 2020 & 2033
- Table 2: Global Salmon Industry Revenue Million Forecast, by Type 2020 & 2033
- Table 3: Global Salmon Industry Revenue Million Forecast, by Species Type 2020 & 2033
- Table 4: Global Salmon Industry Revenue Million Forecast, by Type 2020 & 2033
- Table 5: Global Salmon Industry Revenue Million Forecast, by Region 2020 & 2033
- Table 6: Global Salmon Industry Revenue Million Forecast, by Species Type 2020 & 2033
- Table 7: Global Salmon Industry Revenue Million Forecast, by Type 2020 & 2033
- Table 8: Global Salmon Industry Revenue Million Forecast, by Species Type 2020 & 2033
- Table 9: Global Salmon Industry Revenue Million Forecast, by Type 2020 & 2033
- Table 10: Global Salmon Industry Revenue Million Forecast, by Country 2020 & 2033
- Table 11: United States Salmon Industry Revenue (Million) Forecast, by Application 2020 & 2033
- Table 12: Canada Salmon Industry Revenue (Million) Forecast, by Application 2020 & 2033
- Table 13: Global Salmon Industry Revenue Million Forecast, by Species Type 2020 & 2033
- Table 14: Global Salmon Industry Revenue Million Forecast, by Type 2020 & 2033
- Table 15: Global Salmon Industry Revenue Million Forecast, by Species Type 2020 & 2033
- Table 16: Global Salmon Industry Revenue Million Forecast, by Type 2020 & 2033
- Table 17: Global Salmon Industry Revenue Million Forecast, by Country 2020 & 2033
- Table 18: Norway Salmon Industry Revenue (Million) Forecast, by Application 2020 & 2033
- Table 19: Spain Salmon Industry Revenue (Million) Forecast, by Application 2020 & 2033
- Table 20: Netherlands Salmon Industry Revenue (Million) Forecast, by Application 2020 & 2033
- Table 21: France Salmon Industry Revenue (Million) Forecast, by Application 2020 & 2033
- Table 22: Italy Salmon Industry Revenue (Million) Forecast, by Application 2020 & 2033
- Table 23: Greece Salmon Industry Revenue (Million) Forecast, by Application 2020 & 2033
- Table 24: United Kingdom Salmon Industry Revenue (Million) Forecast, by Application 2020 & 2033
- Table 25: Scotland Salmon Industry Revenue (Million) Forecast, by Application 2020 & 2033
- Table 26: Global Salmon Industry Revenue Million Forecast, by Species Type 2020 & 2033
- Table 27: Global Salmon Industry Revenue Million Forecast, by Type 2020 & 2033
- Table 28: Global Salmon Industry Revenue Million Forecast, by Species Type 2020 & 2033
- Table 29: Global Salmon Industry Revenue Million Forecast, by Type 2020 & 2033
- Table 30: Global Salmon Industry Revenue Million Forecast, by Country 2020 & 2033
- Table 31: China Salmon Industry Revenue (Million) Forecast, by Application 2020 & 2033
- Table 32: Japan Salmon Industry Revenue (Million) Forecast, by Application 2020 & 2033
- Table 33: Australia Salmon Industry Revenue (Million) Forecast, by Application 2020 & 2033
- Table 34: Global Salmon Industry Revenue Million Forecast, by Species Type 2020 & 2033
- Table 35: Global Salmon Industry Revenue Million Forecast, by Type 2020 & 2033
- Table 36: Global Salmon Industry Revenue Million Forecast, by Species Type 2020 & 2033
- Table 37: Global Salmon Industry Revenue Million Forecast, by Type 2020 & 2033
- Table 38: Global Salmon Industry Revenue Million Forecast, by Country 2020 & 2033
- Table 39: Chile Salmon Industry Revenue (Million) Forecast, by Application 2020 & 2033
Frequently Asked Questions
1. What is the projected Compound Annual Growth Rate (CAGR) of the Salmon Industry?
The projected CAGR is approximately 8.07%.
2. Which companies are prominent players in the Salmon Industry?
Key companies in the market include Leroy Seafood Group , Cooke Aquaculture , Cermaq, Mowi , Grieg Seafood .
3. What are the main segments of the Salmon Industry?
The market segments include Species Type, Type, Species Type, Type.
4. Can you provide details about the market size?
The market size is estimated to be USD 33.50 Million as of 2022.
5. What are some drivers contributing to market growth?
; Awareness About Health Benefits Associated With Pecan Consumption; Wide Application of Pecan.
6. What are the notable trends driving market growth?
Healthy Boost in the Salmon Production.
7. Are there any restraints impacting market growth?
; Volatility in the Prices; Adverse Weather Conditions Affecting Yield.
8. Can you provide examples of recent developments in the market?
N/A
9. What pricing options are available for accessing the report?
Pricing options include single-user, multi-user, and enterprise licenses priced at USD 4750, USD 5250, and USD 8750 respectively.
10. Is the market size provided in terms of value or volume?
The market size is provided in terms of value, measured in Million.
11. Are there any specific market keywords associated with the report?
Yes, the market keyword associated with the report is "Salmon Industry," which aids in identifying and referencing the specific market segment covered.
12. How do I determine which pricing option suits my needs best?
The pricing options vary based on user requirements and access needs. Individual users may opt for single-user licenses, while businesses requiring broader access may choose multi-user or enterprise licenses for cost-effective access to the report.
13. Are there any additional resources or data provided in the Salmon Industry report?
While the report offers comprehensive insights, it's advisable to review the specific contents or supplementary materials provided to ascertain if additional resources or data are available.
14. How can I stay updated on further developments or reports in the Salmon Industry?
To stay informed about further developments, trends, and reports in the Salmon Industry, consider subscribing to industry newsletters, following relevant companies and organizations, or regularly checking reputable industry news sources and publications.
Methodology
Step 1 - Identification of Relevant Samples Size from Population Database


Step 2 - Approaches for Defining Global Market Size (Value, Volume* & Price*)

Note*: In applicable scenarios
Step 3 - Data Sources
Primary Research
- Web Analytics
- Survey Reports
- Research Institute
- Latest Research Reports
- Opinion Leaders
Secondary Research
- Annual Reports
- White Paper
- Latest Press Release
- Industry Association
- Paid Database
- Investor Presentations

Step 4 - Data Triangulation
Involves using different sources of information in order to increase the validity of a study
These sources are likely to be stakeholders in a program - participants, other researchers, program staff, other community members, and so on.
Then we put all data in single framework & apply various statistical tools to find out the dynamic on the market.
During the analysis stage, feedback from the stakeholder groups would be compared to determine areas of agreement as well as areas of divergence