

Key Insights
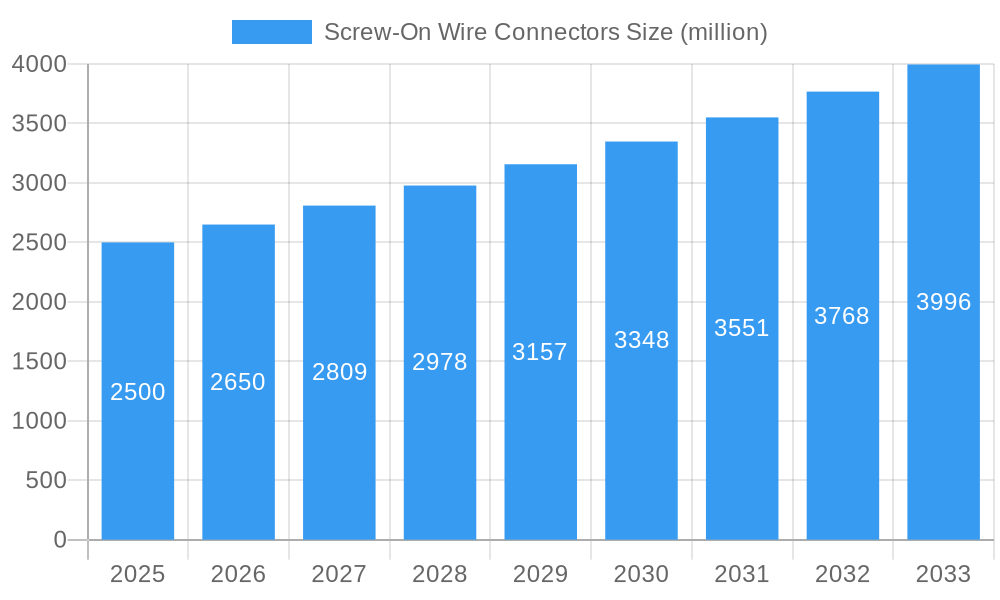
The global market for Screw-On Wire Connectors is poised for robust expansion, projected to reach an estimated $2.5 billion in 2025, with a compelling Compound Annual Growth Rate (CAGR) of 6% anticipated through 2033. This sustained growth is underpinned by a confluence of escalating construction activities worldwide and the persistent demand from the industrial sector for reliable and efficient electrical connections. The inherent ease of use, cost-effectiveness, and dependable performance of screw-on connectors make them indispensable in both new installations and maintenance projects. Furthermore, the increasing adoption of advanced electrical systems in residential, commercial, and infrastructure developments worldwide is creating a fertile ground for market penetration. Innovation in materials and design, leading to enhanced safety features and greater versatility, is also playing a significant role in driving market demand.
Screw-On Wire Connectors Market Size (In Billion)
The market's trajectory is being shaped by key drivers such as the substantial investments in building and infrastructure projects, particularly in emerging economies. The growing emphasis on electrical safety standards and regulations also necessitates the use of certified and high-quality connectors like those in the screw-on category. While the market exhibits strong growth, it faces certain restraints including the increasing competition from alternative wire termination technologies, such as lever nuts and push-in connectors, which offer some advantages in specific applications. However, the established legacy and widespread familiarity of screw-on connectors, coupled with their cost-effectiveness for a broad range of applications, ensure their continued relevance and market share. The market is segmented primarily by application into Construction, Industrial, and Others, with Construction and Industrial sectors representing the largest share. By type, Ordinary and Functional connectors cater to diverse needs. Leading companies like 3M, TE Connectivity, and Ideal Industries are actively innovating and expanding their product portfolios to capture this expanding market.
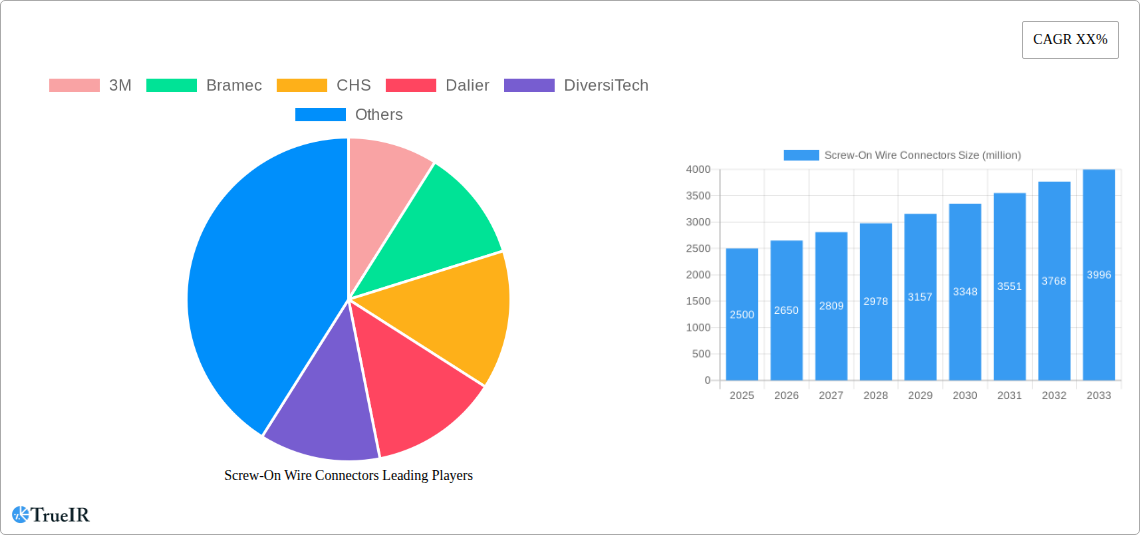
Screw-On Wire Connectors Company Market Share
This in-depth report provides a detailed examination of the global Screw-On Wire Connectors market, offering critical insights for stakeholders across the industry. Spanning the historical period from 2019 to 2024, with a base year of 2025 and a forecast period extending to 2033, this analysis leverages high-volume keywords to ensure optimal SEO performance and maximum reach among industry professionals.
Screw-On Wire Connectors Market Structure & Competitive Landscape
The Screw-On Wire Connectors market exhibits a moderately consolidated structure, with a significant presence of established players alongside emerging innovators. Market concentration is estimated to be around 60%, with the top five companies accounting for this share in the base year of 2025. Innovation drivers are primarily focused on enhancing safety features, improving ease of installation, and developing connectors resistant to extreme environmental conditions. Regulatory impacts, particularly stringent electrical safety standards across North America and Europe, significantly shape product development and market entry strategies. Product substitutes, such as lever-action connectors and solder-based connections, present a competitive challenge, though screw-on connectors retain dominance due to their cost-effectiveness and ease of use in numerous applications. End-user segmentation reveals a strong reliance on the Construction and Industrial segments, collectively representing over 80% of market demand in 2025. Mergers and acquisitions (M&A) activity has been steady, with an average of 3 significant transactions per year between 2019 and 2024, aimed at expanding product portfolios and geographical reach. Key M&A targets often involve smaller, specialized connector manufacturers or companies with innovative material science expertise.
Screw-On Wire Connectors Market Trends & Opportunities
The Screw-On Wire Connectors market is poised for robust growth, projected to expand at a Compound Annual Growth Rate (CAGR) of approximately 5.8% during the forecast period of 2025–2033. The global market size, estimated at over 2.5 billion USD in the base year of 2025, is expected to reach an impressive 3.8 billion USD by 2033. This expansion is fueled by several interconnected trends. A significant technological shift is the increasing integration of smart features in electrical installations, leading to a demand for connectors that can accommodate advanced wiring systems and potentially incorporate monitoring capabilities. The rise of renewable energy projects, particularly solar and wind farms, necessitates reliable and durable wire connections for infrastructure development. Consumer preferences are leaning towards solutions that offer enhanced safety, faster installation times, and long-term reliability, driving manufacturers to invest in research and development for improved materials and designs.
Competitive dynamics are intensifying, with both global giants and regional players vying for market share. Companies are differentiating themselves through product quality, compliance with international standards, and competitive pricing strategies. The increasing adoption of automation in manufacturing processes is also contributing to more efficient production and potentially lower costs. Furthermore, the global push towards electrifying transportation and expanding smart city initiatives are creating new avenues for growth. The demand for high-performance, weather-resistant, and vibration-proof connectors is particularly evident in the industrial and infrastructure development sectors. The trend towards miniaturization in electrical components also influences connector design, requiring smaller, more efficient solutions for complex systems. The growing emphasis on sustainability is also prompting manufacturers to explore eco-friendly materials and production methods. Emerging markets in Asia-Pacific and Latin America are presenting substantial opportunities due to rapid industrialization and infrastructure development projects, with market penetration rates in these regions expected to climb from xx% in 2025 to over xx% by 2033.
Dominant Markets & Segments in Screw-On Wire Connectors
The Industrial application segment is the dominant force in the Screw-On Wire Connectors market, accounting for an estimated 45% of global demand in 2025. This dominance is underpinned by extensive infrastructure development, continuous upgrades in manufacturing facilities, and the widespread use of electrical systems in heavy machinery and industrial processes. Key growth drivers within this segment include government initiatives promoting industrial automation and efficiency, the expansion of factory automation, and the increasing complexity of industrial electrical grids requiring robust and reliable connection solutions. The sheer volume of electrical work in building and maintaining industrial plants, processing facilities, and power generation units makes it a consistent and substantial market.
The Construction application segment follows closely, representing approximately 35% of the market share in 2025. The ongoing global construction boom, driven by urbanization, population growth, and a need for modern housing and commercial spaces, directly translates into high demand for electrical connectors. Infrastructure projects, including the development of transportation networks, utilities, and telecommunications, further bolster this segment. Factors contributing to growth include the increasing adoption of energy-efficient building technologies and the need for safe and compliant electrical installations in both residential and commercial construction.
Within the Types classification, Ordinary screw-on wire connectors hold the majority share, estimated at 70% in 2025, due to their widespread application in standard electrical wiring scenarios across all segments. However, the Functional type, which includes connectors with specialized features like enhanced insulation, vibration resistance, or color-coding for specific applications, is experiencing a faster growth rate, projected at a CAGR of xx% from 2025–2033. This growth is driven by the increasing demand for specialized solutions in complex industrial environments and advanced construction projects.
Geographically, North America and Europe are the leading markets, collectively holding over 55% of the global market share in 2025. This dominance is attributed to mature economies, stringent safety regulations mandating high-quality connectors, extensive existing infrastructure requiring maintenance and upgrades, and a strong industrial base. Asia-Pacific, however, is emerging as the fastest-growing region, with an anticipated CAGR of over xx% during the forecast period, propelled by rapid industrialization, significant government investments in infrastructure, and increasing disposable incomes, driving residential and commercial construction.
Screw-On Wire Connectors Product Analysis
Screw-on wire connectors are evolving with innovations focused on enhanced safety, ease of use, and improved performance in diverse environmental conditions. Manufacturers are developing connectors with advanced flame-retardant materials and superior insulation properties to meet stringent safety standards. Innovations in self-stripping mechanisms and expanded wire accommodation further streamline installation processes, reducing labor time and costs. The competitive advantage lies in offering durable, reliable, and cost-effective solutions that cater to both standard and specialized applications within construction and industrial sectors.
Key Drivers, Barriers & Challenges in Screw-On Wire Connectors
Key Drivers:
- Infrastructure Development: Global investments in construction, utilities, and industrial facilities are a primary growth catalyst, demanding robust electrical connection solutions.
- Technological Advancements: Innovations in materials science and connector design, leading to safer, more efficient, and durable products.
- Regulatory Compliance: Stringent electrical safety standards in developed economies drive demand for certified, high-quality connectors.
- Electrification Trends: The increasing adoption of electric vehicles and renewable energy sources necessitates reliable wiring and connection systems.
Barriers & Challenges:
- Price Sensitivity: In certain cost-conscious markets and applications, price competition can be intense, impacting profit margins.
- Competition from Alternatives: The presence of other connection methods like lever connectors and crimp connectors.
- Supply Chain Volatility: Fluctuations in raw material prices and availability can impact production costs and lead times, with potential disruptions estimated to increase costs by up to xx% in challenging periods.
- Skilled Labor Shortages: A lack of trained electricians in some regions can indirectly affect the adoption of more complex connector types, although screw-on connectors are generally user-friendly.
Growth Drivers in the Screw-On Wire Connectors Market
The Screw-On Wire Connectors market is propelled by the ongoing global surge in infrastructure development, encompassing new construction projects and the modernization of existing facilities. Technological advancements are introducing connectors with superior fire resistance, dielectric strength, and vibration dampening capabilities, directly addressing safety and performance concerns. Stringent regulatory mandates for electrical safety across various regions are a significant driver, pushing demand for certified and reliable connectors. Furthermore, the accelerating trend towards electrification in transportation and the widespread adoption of renewable energy solutions are creating sustained demand for secure and efficient wire connections.
Challenges Impacting Screw-On Wire Connectors Growth
Despite robust growth prospects, the Screw-On Wire Connectors market faces several challenges. Regulatory complexities and varying compliance standards across different countries can hinder market penetration and increase product development costs. Supply chain vulnerabilities, including raw material price volatility and geopolitical disruptions, can impact production costs and lead times, with potential for cost increases by up to xx% during periods of instability. Intense competitive pressures from both established global manufacturers and lower-cost regional players can lead to price erosion, particularly in commoditized product segments. The availability of alternative connection technologies also poses a continuous challenge, requiring manufacturers to innovate and emphasize the unique benefits of screw-on connectors.
Key Players Shaping the Screw-On Wire Connectors Market
- 3M
- Bramec
- CHS
- Dalier
- DiversiTech
- ECM Industries
- Elecmit Electrical
- Golden-Tek Electric
- Heavy Power
- Ideal Industry
- KSS
- MaxBrite
- Meba Electric
- NSi Industries
- SGE
- Smart Electric
- Sodd
- TE Connectivity
- Techspan
- Truper
Significant Screw-On Wire Connectors Industry Milestones
- 2019: Introduction of enhanced flame-retardant materials in connectors, increasing safety compliance in high-risk environments.
- 2020: Launch of innovative self-stripping screw-on connectors, significantly reducing installation time for electricians.
- 2021: Increased focus on sustainable manufacturing processes and materials for electrical connectors.
- 2022: Development of connectors with improved vibration resistance for heavy industrial and automotive applications.
- 2023: Stringent new safety certifications and standards introduced in key global markets, driving demand for compliant products.
- 2024: Advancements in miniaturization of connectors to accommodate increasingly complex and compact electronic devices.
Future Outlook for Screw-On Wire Connectors Market
The future outlook for the Screw-On Wire Connectors market is exceptionally bright, driven by persistent global infrastructure expansion and the ongoing electrification of various sectors. Strategic opportunities lie in the development of smart connectors that can integrate with IoT ecosystems and provide real-time monitoring of electrical connections. The growing demand for high-performance, durable, and aesthetically pleasing connectors in residential and commercial construction also presents significant potential. Furthermore, the expanding renewable energy sector, particularly solar and wind power, will continue to be a major growth catalyst, requiring reliable and robust connection solutions for large-scale projects. The market is expected to witness continued innovation in material science and design, leading to more efficient, safer, and environmentally conscious products, further solidifying its position in the electrical component landscape.
Screw-On Wire Connectors Segmentation
-
1. Application
- 1.1. Construction
- 1.2. Industrial
- 1.3. Others
-
2. Types
- 2.1. Ordinary
- 2.2. Functional
Screw-On Wire Connectors Segmentation By Geography
-
1. North America
- 1.1. United States
- 1.2. Canada
- 1.3. Mexico
-
2. South America
- 2.1. Brazil
- 2.2. Argentina
- 2.3. Rest of South America
-
3. Europe
- 3.1. United Kingdom
- 3.2. Germany
- 3.3. France
- 3.4. Italy
- 3.5. Spain
- 3.6. Russia
- 3.7. Benelux
- 3.8. Nordics
- 3.9. Rest of Europe
-
4. Middle East & Africa
- 4.1. Turkey
- 4.2. Israel
- 4.3. GCC
- 4.4. North Africa
- 4.5. South Africa
- 4.6. Rest of Middle East & Africa
-
5. Asia Pacific
- 5.1. China
- 5.2. India
- 5.3. Japan
- 5.4. South Korea
- 5.5. ASEAN
- 5.6. Oceania
- 5.7. Rest of Asia Pacific
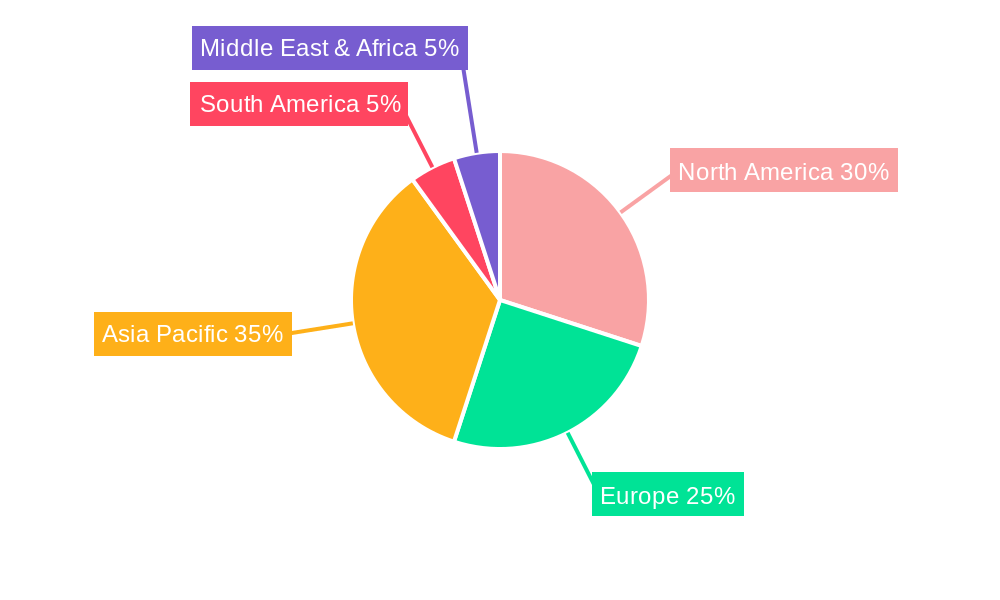
Screw-On Wire Connectors Regional Market Share
Geographic Coverage of Screw-On Wire Connectors
Screw-On Wire Connectors REPORT HIGHLIGHTS
| Aspects | Details |
|---|---|
| Study Period | 2020-2034 |
| Base Year | 2025 |
| Estimated Year | 2026 |
| Forecast Period | 2026-2034 |
| Historical Period | 2020-2025 |
| Growth Rate | CAGR of 6% from 2020-2034 |
| Segmentation |
|
Table of Contents
- 1. Introduction
- 1.1. Research Scope
- 1.2. Market Segmentation
- 1.3. Research Methodology
- 1.4. Definitions and Assumptions
- 2. Executive Summary
- 2.1. Introduction
- 3. Market Dynamics
- 3.1. Introduction
- 3.2. Market Drivers
- 3.3. Market Restrains
- 3.4. Market Trends
- 4. Market Factor Analysis
- 4.1. Porters Five Forces
- 4.2. Supply/Value Chain
- 4.3. PESTEL analysis
- 4.4. Market Entropy
- 4.5. Patent/Trademark Analysis
- 5. Global Screw-On Wire Connectors Analysis, Insights and Forecast, 2020-2032
- 5.1. Market Analysis, Insights and Forecast - by Application
- 5.1.1. Construction
- 5.1.2. Industrial
- 5.1.3. Others
- 5.2. Market Analysis, Insights and Forecast - by Types
- 5.2.1. Ordinary
- 5.2.2. Functional
- 5.3. Market Analysis, Insights and Forecast - by Region
- 5.3.1. North America
- 5.3.2. South America
- 5.3.3. Europe
- 5.3.4. Middle East & Africa
- 5.3.5. Asia Pacific
- 5.1. Market Analysis, Insights and Forecast - by Application
- 6. North America Screw-On Wire Connectors Analysis, Insights and Forecast, 2020-2032
- 6.1. Market Analysis, Insights and Forecast - by Application
- 6.1.1. Construction
- 6.1.2. Industrial
- 6.1.3. Others
- 6.2. Market Analysis, Insights and Forecast - by Types
- 6.2.1. Ordinary
- 6.2.2. Functional
- 6.1. Market Analysis, Insights and Forecast - by Application
- 7. South America Screw-On Wire Connectors Analysis, Insights and Forecast, 2020-2032
- 7.1. Market Analysis, Insights and Forecast - by Application
- 7.1.1. Construction
- 7.1.2. Industrial
- 7.1.3. Others
- 7.2. Market Analysis, Insights and Forecast - by Types
- 7.2.1. Ordinary
- 7.2.2. Functional
- 7.1. Market Analysis, Insights and Forecast - by Application
- 8. Europe Screw-On Wire Connectors Analysis, Insights and Forecast, 2020-2032
- 8.1. Market Analysis, Insights and Forecast - by Application
- 8.1.1. Construction
- 8.1.2. Industrial
- 8.1.3. Others
- 8.2. Market Analysis, Insights and Forecast - by Types
- 8.2.1. Ordinary
- 8.2.2. Functional
- 8.1. Market Analysis, Insights and Forecast - by Application
- 9. Middle East & Africa Screw-On Wire Connectors Analysis, Insights and Forecast, 2020-2032
- 9.1. Market Analysis, Insights and Forecast - by Application
- 9.1.1. Construction
- 9.1.2. Industrial
- 9.1.3. Others
- 9.2. Market Analysis, Insights and Forecast - by Types
- 9.2.1. Ordinary
- 9.2.2. Functional
- 9.1. Market Analysis, Insights and Forecast - by Application
- 10. Asia Pacific Screw-On Wire Connectors Analysis, Insights and Forecast, 2020-2032
- 10.1. Market Analysis, Insights and Forecast - by Application
- 10.1.1. Construction
- 10.1.2. Industrial
- 10.1.3. Others
- 10.2. Market Analysis, Insights and Forecast - by Types
- 10.2.1. Ordinary
- 10.2.2. Functional
- 10.1. Market Analysis, Insights and Forecast - by Application
- 11. Competitive Analysis
- 11.1. Global Market Share Analysis 2025
- 11.2. Company Profiles
- 11.2.1 3M
- 11.2.1.1. Overview
- 11.2.1.2. Products
- 11.2.1.3. SWOT Analysis
- 11.2.1.4. Recent Developments
- 11.2.1.5. Financials (Based on Availability)
- 11.2.2 Bramec
- 11.2.2.1. Overview
- 11.2.2.2. Products
- 11.2.2.3. SWOT Analysis
- 11.2.2.4. Recent Developments
- 11.2.2.5. Financials (Based on Availability)
- 11.2.3 CHS
- 11.2.3.1. Overview
- 11.2.3.2. Products
- 11.2.3.3. SWOT Analysis
- 11.2.3.4. Recent Developments
- 11.2.3.5. Financials (Based on Availability)
- 11.2.4 Dalier
- 11.2.4.1. Overview
- 11.2.4.2. Products
- 11.2.4.3. SWOT Analysis
- 11.2.4.4. Recent Developments
- 11.2.4.5. Financials (Based on Availability)
- 11.2.5 DiversiTech
- 11.2.5.1. Overview
- 11.2.5.2. Products
- 11.2.5.3. SWOT Analysis
- 11.2.5.4. Recent Developments
- 11.2.5.5. Financials (Based on Availability)
- 11.2.6 ECM Industries
- 11.2.6.1. Overview
- 11.2.6.2. Products
- 11.2.6.3. SWOT Analysis
- 11.2.6.4. Recent Developments
- 11.2.6.5. Financials (Based on Availability)
- 11.2.7 Elecmit Electrical
- 11.2.7.1. Overview
- 11.2.7.2. Products
- 11.2.7.3. SWOT Analysis
- 11.2.7.4. Recent Developments
- 11.2.7.5. Financials (Based on Availability)
- 11.2.8 Golden-Tek Electric
- 11.2.8.1. Overview
- 11.2.8.2. Products
- 11.2.8.3. SWOT Analysis
- 11.2.8.4. Recent Developments
- 11.2.8.5. Financials (Based on Availability)
- 11.2.9 Heavy Power
- 11.2.9.1. Overview
- 11.2.9.2. Products
- 11.2.9.3. SWOT Analysis
- 11.2.9.4. Recent Developments
- 11.2.9.5. Financials (Based on Availability)
- 11.2.10 Ideal Industry
- 11.2.10.1. Overview
- 11.2.10.2. Products
- 11.2.10.3. SWOT Analysis
- 11.2.10.4. Recent Developments
- 11.2.10.5. Financials (Based on Availability)
- 11.2.11 KSS
- 11.2.11.1. Overview
- 11.2.11.2. Products
- 11.2.11.3. SWOT Analysis
- 11.2.11.4. Recent Developments
- 11.2.11.5. Financials (Based on Availability)
- 11.2.12 MaxBrite
- 11.2.12.1. Overview
- 11.2.12.2. Products
- 11.2.12.3. SWOT Analysis
- 11.2.12.4. Recent Developments
- 11.2.12.5. Financials (Based on Availability)
- 11.2.13 Meba Electric
- 11.2.13.1. Overview
- 11.2.13.2. Products
- 11.2.13.3. SWOT Analysis
- 11.2.13.4. Recent Developments
- 11.2.13.5. Financials (Based on Availability)
- 11.2.14 NSi Industries
- 11.2.14.1. Overview
- 11.2.14.2. Products
- 11.2.14.3. SWOT Analysis
- 11.2.14.4. Recent Developments
- 11.2.14.5. Financials (Based on Availability)
- 11.2.15 SGE
- 11.2.15.1. Overview
- 11.2.15.2. Products
- 11.2.15.3. SWOT Analysis
- 11.2.15.4. Recent Developments
- 11.2.15.5. Financials (Based on Availability)
- 11.2.16 Smart Electric
- 11.2.16.1. Overview
- 11.2.16.2. Products
- 11.2.16.3. SWOT Analysis
- 11.2.16.4. Recent Developments
- 11.2.16.5. Financials (Based on Availability)
- 11.2.17 Sodd
- 11.2.17.1. Overview
- 11.2.17.2. Products
- 11.2.17.3. SWOT Analysis
- 11.2.17.4. Recent Developments
- 11.2.17.5. Financials (Based on Availability)
- 11.2.18 TE Connectivity
- 11.2.18.1. Overview
- 11.2.18.2. Products
- 11.2.18.3. SWOT Analysis
- 11.2.18.4. Recent Developments
- 11.2.18.5. Financials (Based on Availability)
- 11.2.19 Techspan
- 11.2.19.1. Overview
- 11.2.19.2. Products
- 11.2.19.3. SWOT Analysis
- 11.2.19.4. Recent Developments
- 11.2.19.5. Financials (Based on Availability)
- 11.2.20 Truper
- 11.2.20.1. Overview
- 11.2.20.2. Products
- 11.2.20.3. SWOT Analysis
- 11.2.20.4. Recent Developments
- 11.2.20.5. Financials (Based on Availability)
- 11.2.1 3M
List of Figures
- Figure 1: Global Screw-On Wire Connectors Revenue Breakdown (undefined, %) by Region 2025 & 2033
- Figure 2: North America Screw-On Wire Connectors Revenue (undefined), by Application 2025 & 2033
- Figure 3: North America Screw-On Wire Connectors Revenue Share (%), by Application 2025 & 2033
- Figure 4: North America Screw-On Wire Connectors Revenue (undefined), by Types 2025 & 2033
- Figure 5: North America Screw-On Wire Connectors Revenue Share (%), by Types 2025 & 2033
- Figure 6: North America Screw-On Wire Connectors Revenue (undefined), by Country 2025 & 2033
- Figure 7: North America Screw-On Wire Connectors Revenue Share (%), by Country 2025 & 2033
- Figure 8: South America Screw-On Wire Connectors Revenue (undefined), by Application 2025 & 2033
- Figure 9: South America Screw-On Wire Connectors Revenue Share (%), by Application 2025 & 2033
- Figure 10: South America Screw-On Wire Connectors Revenue (undefined), by Types 2025 & 2033
- Figure 11: South America Screw-On Wire Connectors Revenue Share (%), by Types 2025 & 2033
- Figure 12: South America Screw-On Wire Connectors Revenue (undefined), by Country 2025 & 2033
- Figure 13: South America Screw-On Wire Connectors Revenue Share (%), by Country 2025 & 2033
- Figure 14: Europe Screw-On Wire Connectors Revenue (undefined), by Application 2025 & 2033
- Figure 15: Europe Screw-On Wire Connectors Revenue Share (%), by Application 2025 & 2033
- Figure 16: Europe Screw-On Wire Connectors Revenue (undefined), by Types 2025 & 2033
- Figure 17: Europe Screw-On Wire Connectors Revenue Share (%), by Types 2025 & 2033
- Figure 18: Europe Screw-On Wire Connectors Revenue (undefined), by Country 2025 & 2033
- Figure 19: Europe Screw-On Wire Connectors Revenue Share (%), by Country 2025 & 2033
- Figure 20: Middle East & Africa Screw-On Wire Connectors Revenue (undefined), by Application 2025 & 2033
- Figure 21: Middle East & Africa Screw-On Wire Connectors Revenue Share (%), by Application 2025 & 2033
- Figure 22: Middle East & Africa Screw-On Wire Connectors Revenue (undefined), by Types 2025 & 2033
- Figure 23: Middle East & Africa Screw-On Wire Connectors Revenue Share (%), by Types 2025 & 2033
- Figure 24: Middle East & Africa Screw-On Wire Connectors Revenue (undefined), by Country 2025 & 2033
- Figure 25: Middle East & Africa Screw-On Wire Connectors Revenue Share (%), by Country 2025 & 2033
- Figure 26: Asia Pacific Screw-On Wire Connectors Revenue (undefined), by Application 2025 & 2033
- Figure 27: Asia Pacific Screw-On Wire Connectors Revenue Share (%), by Application 2025 & 2033
- Figure 28: Asia Pacific Screw-On Wire Connectors Revenue (undefined), by Types 2025 & 2033
- Figure 29: Asia Pacific Screw-On Wire Connectors Revenue Share (%), by Types 2025 & 2033
- Figure 30: Asia Pacific Screw-On Wire Connectors Revenue (undefined), by Country 2025 & 2033
- Figure 31: Asia Pacific Screw-On Wire Connectors Revenue Share (%), by Country 2025 & 2033
List of Tables
- Table 1: Global Screw-On Wire Connectors Revenue undefined Forecast, by Application 2020 & 2033
- Table 2: Global Screw-On Wire Connectors Revenue undefined Forecast, by Types 2020 & 2033
- Table 3: Global Screw-On Wire Connectors Revenue undefined Forecast, by Region 2020 & 2033
- Table 4: Global Screw-On Wire Connectors Revenue undefined Forecast, by Application 2020 & 2033
- Table 5: Global Screw-On Wire Connectors Revenue undefined Forecast, by Types 2020 & 2033
- Table 6: Global Screw-On Wire Connectors Revenue undefined Forecast, by Country 2020 & 2033
- Table 7: United States Screw-On Wire Connectors Revenue (undefined) Forecast, by Application 2020 & 2033
- Table 8: Canada Screw-On Wire Connectors Revenue (undefined) Forecast, by Application 2020 & 2033
- Table 9: Mexico Screw-On Wire Connectors Revenue (undefined) Forecast, by Application 2020 & 2033
- Table 10: Global Screw-On Wire Connectors Revenue undefined Forecast, by Application 2020 & 2033
- Table 11: Global Screw-On Wire Connectors Revenue undefined Forecast, by Types 2020 & 2033
- Table 12: Global Screw-On Wire Connectors Revenue undefined Forecast, by Country 2020 & 2033
- Table 13: Brazil Screw-On Wire Connectors Revenue (undefined) Forecast, by Application 2020 & 2033
- Table 14: Argentina Screw-On Wire Connectors Revenue (undefined) Forecast, by Application 2020 & 2033
- Table 15: Rest of South America Screw-On Wire Connectors Revenue (undefined) Forecast, by Application 2020 & 2033
- Table 16: Global Screw-On Wire Connectors Revenue undefined Forecast, by Application 2020 & 2033
- Table 17: Global Screw-On Wire Connectors Revenue undefined Forecast, by Types 2020 & 2033
- Table 18: Global Screw-On Wire Connectors Revenue undefined Forecast, by Country 2020 & 2033
- Table 19: United Kingdom Screw-On Wire Connectors Revenue (undefined) Forecast, by Application 2020 & 2033
- Table 20: Germany Screw-On Wire Connectors Revenue (undefined) Forecast, by Application 2020 & 2033
- Table 21: France Screw-On Wire Connectors Revenue (undefined) Forecast, by Application 2020 & 2033
- Table 22: Italy Screw-On Wire Connectors Revenue (undefined) Forecast, by Application 2020 & 2033
- Table 23: Spain Screw-On Wire Connectors Revenue (undefined) Forecast, by Application 2020 & 2033
- Table 24: Russia Screw-On Wire Connectors Revenue (undefined) Forecast, by Application 2020 & 2033
- Table 25: Benelux Screw-On Wire Connectors Revenue (undefined) Forecast, by Application 2020 & 2033
- Table 26: Nordics Screw-On Wire Connectors Revenue (undefined) Forecast, by Application 2020 & 2033
- Table 27: Rest of Europe Screw-On Wire Connectors Revenue (undefined) Forecast, by Application 2020 & 2033
- Table 28: Global Screw-On Wire Connectors Revenue undefined Forecast, by Application 2020 & 2033
- Table 29: Global Screw-On Wire Connectors Revenue undefined Forecast, by Types 2020 & 2033
- Table 30: Global Screw-On Wire Connectors Revenue undefined Forecast, by Country 2020 & 2033
- Table 31: Turkey Screw-On Wire Connectors Revenue (undefined) Forecast, by Application 2020 & 2033
- Table 32: Israel Screw-On Wire Connectors Revenue (undefined) Forecast, by Application 2020 & 2033
- Table 33: GCC Screw-On Wire Connectors Revenue (undefined) Forecast, by Application 2020 & 2033
- Table 34: North Africa Screw-On Wire Connectors Revenue (undefined) Forecast, by Application 2020 & 2033
- Table 35: South Africa Screw-On Wire Connectors Revenue (undefined) Forecast, by Application 2020 & 2033
- Table 36: Rest of Middle East & Africa Screw-On Wire Connectors Revenue (undefined) Forecast, by Application 2020 & 2033
- Table 37: Global Screw-On Wire Connectors Revenue undefined Forecast, by Application 2020 & 2033
- Table 38: Global Screw-On Wire Connectors Revenue undefined Forecast, by Types 2020 & 2033
- Table 39: Global Screw-On Wire Connectors Revenue undefined Forecast, by Country 2020 & 2033
- Table 40: China Screw-On Wire Connectors Revenue (undefined) Forecast, by Application 2020 & 2033
- Table 41: India Screw-On Wire Connectors Revenue (undefined) Forecast, by Application 2020 & 2033
- Table 42: Japan Screw-On Wire Connectors Revenue (undefined) Forecast, by Application 2020 & 2033
- Table 43: South Korea Screw-On Wire Connectors Revenue (undefined) Forecast, by Application 2020 & 2033
- Table 44: ASEAN Screw-On Wire Connectors Revenue (undefined) Forecast, by Application 2020 & 2033
- Table 45: Oceania Screw-On Wire Connectors Revenue (undefined) Forecast, by Application 2020 & 2033
- Table 46: Rest of Asia Pacific Screw-On Wire Connectors Revenue (undefined) Forecast, by Application 2020 & 2033
Frequently Asked Questions
1. What is the projected Compound Annual Growth Rate (CAGR) of the Screw-On Wire Connectors?
The projected CAGR is approximately 6%.
2. Which companies are prominent players in the Screw-On Wire Connectors?
Key companies in the market include 3M, Bramec, CHS, Dalier, DiversiTech, ECM Industries, Elecmit Electrical, Golden-Tek Electric, Heavy Power, Ideal Industry, KSS, MaxBrite, Meba Electric, NSi Industries, SGE, Smart Electric, Sodd, TE Connectivity, Techspan, Truper.
3. What are the main segments of the Screw-On Wire Connectors?
The market segments include Application, Types.
4. Can you provide details about the market size?
The market size is estimated to be USD XXX N/A as of 2022.
5. What are some drivers contributing to market growth?
N/A
6. What are the notable trends driving market growth?
N/A
7. Are there any restraints impacting market growth?
N/A
8. Can you provide examples of recent developments in the market?
N/A
9. What pricing options are available for accessing the report?
Pricing options include single-user, multi-user, and enterprise licenses priced at USD 2900.00, USD 4350.00, and USD 5800.00 respectively.
10. Is the market size provided in terms of value or volume?
The market size is provided in terms of value, measured in N/A.
11. Are there any specific market keywords associated with the report?
Yes, the market keyword associated with the report is "Screw-On Wire Connectors," which aids in identifying and referencing the specific market segment covered.
12. How do I determine which pricing option suits my needs best?
The pricing options vary based on user requirements and access needs. Individual users may opt for single-user licenses, while businesses requiring broader access may choose multi-user or enterprise licenses for cost-effective access to the report.
13. Are there any additional resources or data provided in the Screw-On Wire Connectors report?
While the report offers comprehensive insights, it's advisable to review the specific contents or supplementary materials provided to ascertain if additional resources or data are available.
14. How can I stay updated on further developments or reports in the Screw-On Wire Connectors?
To stay informed about further developments, trends, and reports in the Screw-On Wire Connectors, consider subscribing to industry newsletters, following relevant companies and organizations, or regularly checking reputable industry news sources and publications.
Methodology
Step 1 - Identification of Relevant Samples Size from Population Database


Step 2 - Approaches for Defining Global Market Size (Value, Volume* & Price*)

Note*: In applicable scenarios
Step 3 - Data Sources
Primary Research
- Web Analytics
- Survey Reports
- Research Institute
- Latest Research Reports
- Opinion Leaders
Secondary Research
- Annual Reports
- White Paper
- Latest Press Release
- Industry Association
- Paid Database
- Investor Presentations

Step 4 - Data Triangulation
Involves using different sources of information in order to increase the validity of a study
These sources are likely to be stakeholders in a program - participants, other researchers, program staff, other community members, and so on.
Then we put all data in single framework & apply various statistical tools to find out the dynamic on the market.
During the analysis stage, feedback from the stakeholder groups would be compared to determine areas of agreement as well as areas of divergence