

Key Insights
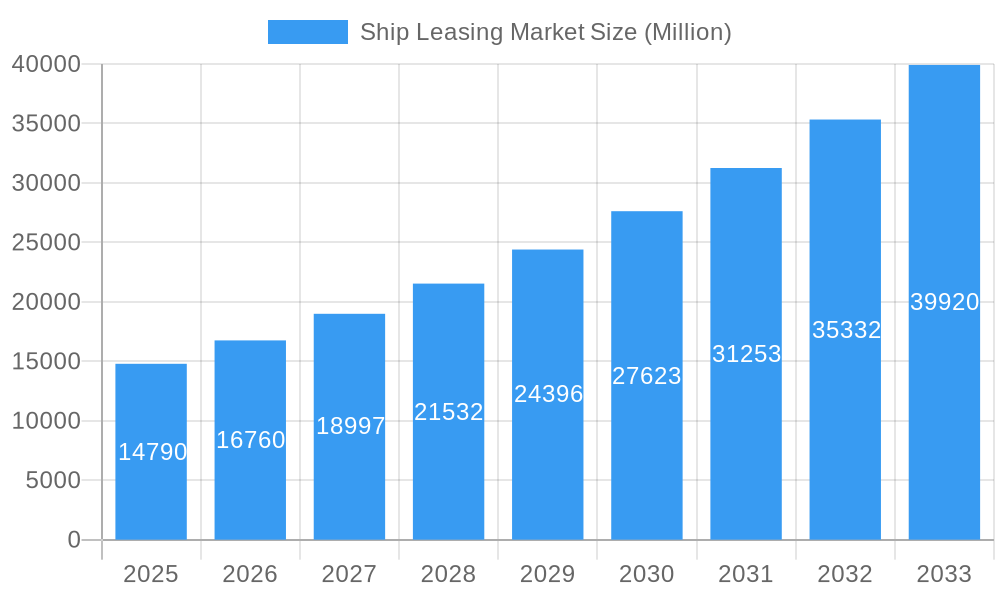
The global ship leasing market, valued at $14.79 billion in 2025, is projected to experience robust growth, exhibiting a Compound Annual Growth Rate (CAGR) of 13.59% from 2025 to 2033. This expansion is driven by several key factors. The increasing global trade volume necessitates a larger shipping fleet, fueling demand for leased vessels rather than outright purchases. Furthermore, the operational flexibility offered by leasing—allowing companies to adapt to fluctuating market conditions and avoid large capital expenditures—is a significant advantage. Technological advancements in vessel design and efficiency, coupled with the implementation of stricter environmental regulations, are also contributing to market growth. The segment encompassing container ships and bulk carriers dominates the market due to their high demand in global trade. Financial leases, providing significant tax advantages, and full-service leases, which include maintenance and operational support, are the most prevalent lease types. Competition is intense, with major players including ICBC, CMB Financial Leasing, Hamburg Commercial Bank, and A.P. Møller-Mærsk actively vying for market share. Geographical distribution reveals a strong presence in Asia-Pacific, driven by China's substantial import/export activities, followed by North America and Europe.
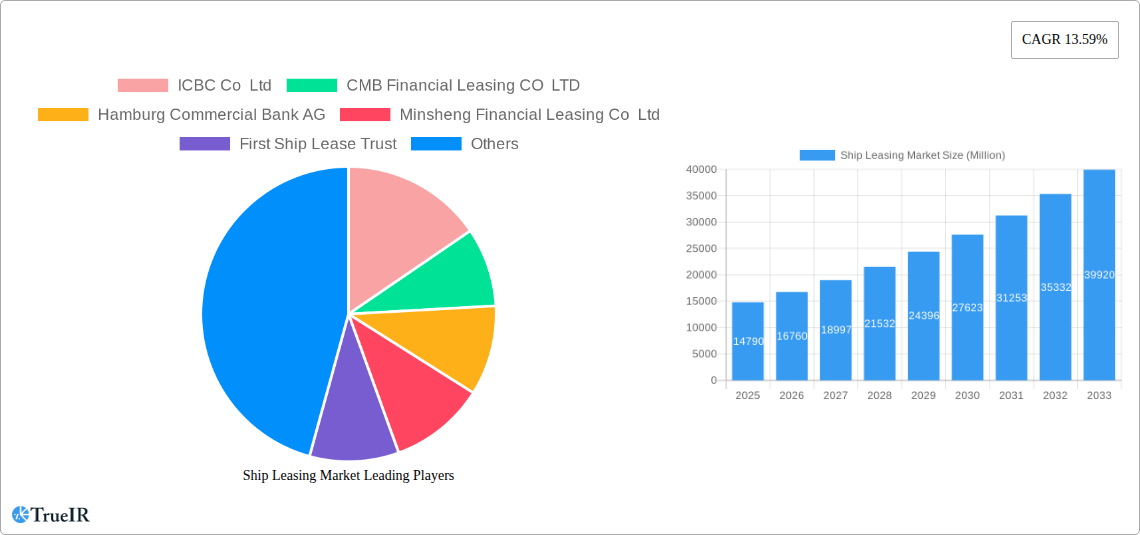
Ship Leasing Market Market Size (In Billion)
The market's growth, however, faces certain restraints. Fluctuations in global economic conditions can significantly impact shipping demand, affecting lease rates. Geopolitical instability and trade disputes create uncertainty, potentially hindering growth. Furthermore, the availability of financing and the rising cost of shipbuilding materials can influence the market's trajectory. To mitigate these challenges, leasing companies are increasingly focusing on diversifying their portfolios, expanding into new geographical markets, and offering innovative lease structures tailored to specific client needs. The adoption of digital technologies for streamlined lease management and enhanced risk assessment is also becoming crucial for success in this competitive landscape. The predicted growth trajectory suggests a promising future for the ship leasing market, although navigating economic volatility and geopolitical complexities will remain vital for sustained success.
Ship Leasing Market Company Market Share
Ship Leasing Market Report: 2019-2033 Forecast
This comprehensive report provides a detailed analysis of the global Ship Leasing Market, offering invaluable insights for investors, industry professionals, and strategic decision-makers. Covering the period from 2019 to 2033, with a focus on 2025, this study unveils market dynamics, competitive landscapes, and future growth projections. The report incorporates extensive data analysis, including CAGR calculations and market penetration rates, to deliver a holistic understanding of this crucial maritime sector.
Ship Leasing Market Structure & Competitive Landscape
The global ship leasing market exhibits a moderately concentrated structure, with a few major players commanding significant market share. The Herfindahl-Hirschman Index (HHI) for 2025 is estimated at xx, indicating a moderately concentrated market. Key drivers of innovation include the adoption of advanced technologies like AI-powered predictive maintenance and the development of more efficient vessel designs. Regulatory impacts, such as those related to emissions and safety standards, are increasingly influential, driving demand for compliant vessels and impacting leasing contracts. Product substitutes, such as container rail transport or pipeline transportation, exert limited pressure, given the unique advantages of maritime shipping for bulk commodities and long-distance transport. End-user segmentation is predominantly driven by the type of cargo (containers, bulk), with container shipping currently holding a larger share. M&A activity in the ship leasing sector has been relatively moderate in recent years, with xx deals recorded between 2019 and 2024, reflecting a consolidating market.
- Market Concentration: HHI (2025) estimated at xx
- Innovation Drivers: AI-powered maintenance, efficient vessel designs
- Regulatory Impacts: Emission standards, safety regulations
- Product Substitutes: Limited impact from rail or pipelines
- End-User Segmentation: Container ships & Bulk carriers dominate
- M&A Trends: xx deals recorded between 2019-2024
Ship Leasing Market Market Trends & Opportunities
The global ship leasing market is experiencing robust growth, driven by rising global trade volumes, increasing demand for specialized vessels, and the ongoing expansion of containerization. The market size is projected to reach xx Million by 2025, exhibiting a CAGR of xx% during the forecast period (2025-2033). This growth is fueled by several key trends, including technological advancements in vessel construction and operation, leading to increased efficiency and reduced operational costs. Furthermore, shifting consumer preferences toward e-commerce and the resulting surge in global container shipping contribute significantly to market expansion. Competitive dynamics are shaping the landscape, with major players focusing on fleet modernization, strategic partnerships, and diversification to maintain market leadership. The market penetration rate for financial leases is projected to reach xx% by 2033, indicating a growing preference for this leasing type.
Dominant Markets & Segments in Ship Leasing Market
The Asia-Pacific region currently dominates the ship leasing market, driven by robust economic growth and expanding trade within the region. China, particularly, is a key market. Within the segment breakdown:
- Lease Type: Financial leases currently hold the largest market share, followed by full-service leases. The preference for financial leases is driven by flexibility and cost-effectiveness.
- Application: Container ships represent the largest segment, reflecting the growth of containerized shipping. Bulk carriers, although significant, hold a smaller share.
- Type: Real-time leases and periodic tenancies account for the majority of the market, driven by the demand for short-term and flexible leasing options.
Key Growth Drivers:
- Asia-Pacific Economic Growth: Strong regional trade and infrastructure development
- Technological Advancements: Increased efficiency and cost reductions
- Government Policies: Supportive shipping industry policies in key regions.
Ship Leasing Market Product Analysis
Technological advancements are a significant catalyst for innovation in the ship leasing market. The integration of smart technologies, including advanced navigation systems, real-time performance monitoring, and predictive maintenance solutions, is revolutionizing vessel operations. These innovations lead to substantial improvements in operational efficiency, optimized fuel consumption through sophisticated route planning and engine management, and reduced maintenance costs by identifying potential issues proactively. Consequently, the market strongly favors vessels that offer a competitive edge, characterized by superior fuel efficiency, maximized cargo capacity, and stringent adherence to evolving environmental compliance standards. Leasing companies and owners who strategically invest in modern, technologically advanced fleets are well-positioned to secure attractive lease terms, command higher rental rates, and ultimately expand their market share in this dynamic sector.
Key Drivers, Barriers & Challenges in Ship Leasing Market
Key Drivers:
- Growing global trade volumes.
- Increased demand for specialized vessels.
- Technological advancements in vessel design and operation.
- Favorable regulatory environments in some regions.
Challenges & Restraints:
- Fluctuations in freight rates and fuel prices pose a significant challenge. A 10% increase in fuel prices can impact operating costs by xx Million.
- Stringent environmental regulations can increase compliance costs.
- Geopolitical instability and trade wars can disrupt supply chains and impact demand.
Growth Drivers in the Ship Leasing Market Market
The rising global trade, coupled with the growing preference for leasing due to its financial flexibility, remains the primary driver. Technological advancements, enabling greater efficiency and lower operating costs, also significantly contribute. Furthermore, supportive government policies in many countries continue to boost the market's growth.
Challenges Impacting Ship Leasing Market Growth
The ship leasing market faces several multifaceted challenges that impact its growth trajectory. Persistent fluctuations in global fuel prices, directly influencing operating costs, and volatile freight rates, which affect charter income, create significant financial uncertainty for both lessors and lessees. Furthermore, the increasingly stringent environmental regulations being implemented by international bodies like the IMO, such as the Energy Efficiency Existing Ship Index (EEXI) and Carbon Intensity Indicator (CII), are elevating compliance costs and necessitating significant investment in vessel upgrades or the acquisition of newer, greener tonnage. Geopolitical uncertainties, including trade disputes, regional conflicts, and disruptions to key shipping lanes, can profoundly impact global supply chains, leading to unpredictable shifts in market demand and creating substantial risks for the industry. Economic downturns and changes in global trade patterns also contribute to market volatility.
Key Players Shaping the Ship Leasing Market Market
- ICBC Financial Leasing Co., Ltd.
- CMB Financial Leasing CO LTD
- Hamburg Commercial Bank AG
- Minsheng Financial Leasing Co Ltd
- First Ship Lease Trust
- MUFG Bank Ltd
- Bothra Group
- Bank of Communications Financial Leasing Co Ltd
- Galbraiths Ltd
- A.P. Møller - Mærsk A/S
- Global Ship Lease Inc
- DNB Bank ASA
- Nordea Bank Abp
- CLdN SA
- SeaQuest Marine Ltd
- BW Group
Significant Ship Leasing Market Industry Milestones
- 2021 Q4: The International Maritime Organization (IMO) introduced new, stricter emission reduction regulations, including the Energy Efficiency Existing Ship Index (EEXI) and Carbon Intensity Indicator (CII). This mandate significantly boosted demand for vessels meeting these environmental standards and spurred investment in retrofitting older tonnage or acquiring newer, compliant ships.
- 2022 Q2: A notable merger occurred between two prominent ship leasing entities, consolidating market share and leading to a more concentrated competitive landscape. The specific identities of the involved companies remain confidential, but this consolidation is expected to influence market dynamics and pricing strategies.
- 2023 Q1: A leading ship manufacturer unveiled a groundbreaking new class of ultra-fuel-efficient container ships, setting a new benchmark for performance and environmental impact. This innovation is expected to reshape fleet strategies and accelerate the adoption of advanced hull designs and propulsion systems across the industry.
- 2023 Q3: The market witnessed a surge in the leasing of specialized vessels designed for offshore wind farm construction and maintenance, reflecting the growing global commitment to renewable energy infrastructure.
- 2024 Q1: Increased interest and investment in leasing eco-friendly tanker vessels equipped with advanced ballast water treatment systems and low-sulfur fuel capabilities, driven by evolving environmental regulations and industry sustainability goals.
Future Outlook for Ship Leasing Market Market
The ship leasing market is poised for continued growth, driven by the sustained expansion of global trade and the increasing adoption of sustainable shipping practices. Strategic partnerships and investments in technological advancements will be key factors in shaping the market's future trajectory, with opportunities for further consolidation and innovation in the years ahead.
Ship Leasing Market Segmentation
-
1. Lease Type
- 1.1. Financial Lease
- 1.2. Full-Service Lease
-
2. Application
- 2.1. Container Ships
- 2.2. Bulk Carriers
-
3. Type
- 3.1. Real-Time Lease
- 3.2. Periodic Tenancy
- 3.3. Bareboat Charter
- 3.4. Other Types
Ship Leasing Market Segmentation By Geography
-
1. North America
- 1.1. United States
- 1.2. Canada
-
2. Europe
- 2.1. United Kingdom
- 2.2. France
- 2.3. Germany
- 2.4. Rest of Europe
-
3. Asia Pacific
- 3.1. China
- 3.2. India
- 3.3. Japan
- 3.4. South Korea
- 3.5. Rest of Asia Pacific
-
4. Latin America
- 4.1. Brazil
- 4.2. Rest of Latin America
-
5. Middle East and Africa
- 5.1. United Arab Emirates
- 5.2. Saudi Arabia
- 5.3. South Africa
- 5.4. Rest of Middle East and Africa
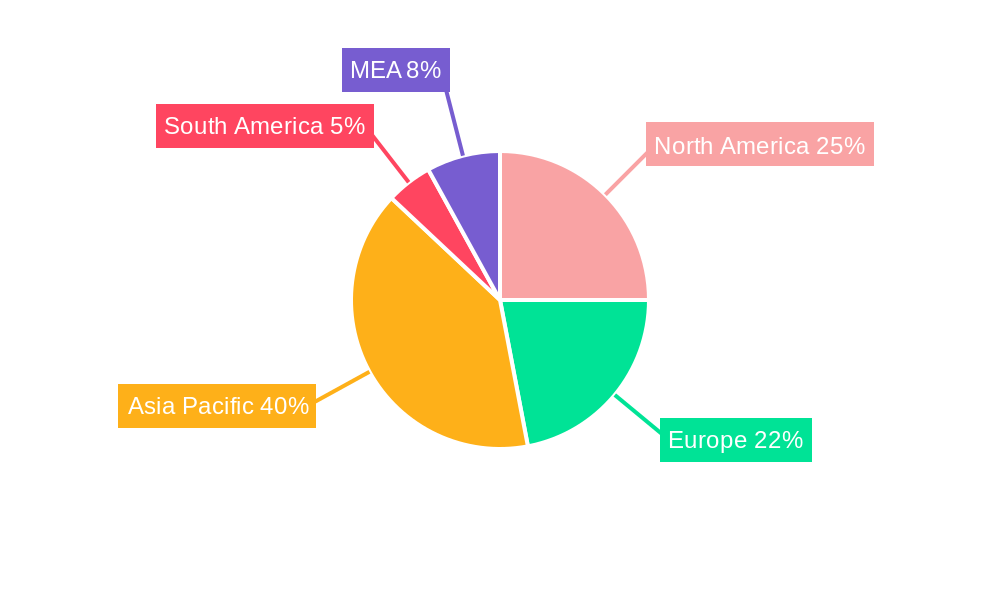
Ship Leasing Market Regional Market Share
Geographic Coverage of Ship Leasing Market
Ship Leasing Market REPORT HIGHLIGHTS
| Aspects | Details |
|---|---|
| Study Period | 2020-2034 |
| Base Year | 2025 |
| Estimated Year | 2026 |
| Forecast Period | 2026-2034 |
| Historical Period | 2020-2025 |
| Growth Rate | CAGR of 12% from 2020-2034 |
| Segmentation |
|
Table of Contents
- 1. Introduction
- 1.1. Research Scope
- 1.2. Market Segmentation
- 1.3. Research Objective
- 1.4. Definitions and Assumptions
- 2. Executive Summary
- 2.1. Market Snapshot
- 3. Market Dynamics
- 3.1. Market Drivers
- 3.2. Market Restrains
- 3.3. Market Trends
- 3.4. Market Opportunities
- 4. Market Factor Analysis
- 4.1. Porters Five Forces
- 4.1.1. Bargaining Power of Suppliers
- 4.1.2. Bargaining Power of Buyers
- 4.1.3. Threat of New Entrants
- 4.1.4. Threat of Substitutes
- 4.1.5. Competitive Rivalry
- 4.2. PESTEL analysis
- 4.3. BCG Analysis
- 4.3.1. Stars (High Growth, High Market Share)
- 4.3.2. Cash Cows (Low Growth, High Market Share)
- 4.3.3. Question Mark (High Growth, Low Market Share)
- 4.3.4. Dogs (Low Growth, Low Market Share)
- 4.4. Ansoff Matrix Analysis
- 4.5. Supply Chain Analysis
- 4.6. Regulatory Landscape
- 4.7. Current Market Potential and Opportunity Assessment (TAM–SAM–SOM Framework)
- 4.8. TIR Analyst Note
- 4.1. Porters Five Forces
- 5. Market Analysis, Insights and Forecast 2021-2033
- 5.1. Market Analysis, Insights and Forecast - by Lease Type
- 5.1.1. Financial Lease
- 5.1.2. Full-Service Lease
- 5.2. Market Analysis, Insights and Forecast - by Application
- 5.2.1. Container Ships
- 5.2.2. Bulk Carriers
- 5.3. Market Analysis, Insights and Forecast - by Type
- 5.3.1. Real-Time Lease
- 5.3.2. Periodic Tenancy
- 5.3.3. Bareboat Charter
- 5.3.4. Other Types
- 5.4. Market Analysis, Insights and Forecast - by Region
- 5.4.1. North America
- 5.4.2. Europe
- 5.4.3. Asia Pacific
- 5.4.4. Latin America
- 5.4.5. Middle East and Africa
- 5.1. Market Analysis, Insights and Forecast - by Lease Type
- 6. Global Ship Leasing Market Analysis, Insights and Forecast, 2021-2033
- 6.1. Market Analysis, Insights and Forecast - by Lease Type
- 6.1.1. Financial Lease
- 6.1.2. Full-Service Lease
- 6.2. Market Analysis, Insights and Forecast - by Application
- 6.2.1. Container Ships
- 6.2.2. Bulk Carriers
- 6.3. Market Analysis, Insights and Forecast - by Type
- 6.3.1. Real-Time Lease
- 6.3.2. Periodic Tenancy
- 6.3.3. Bareboat Charter
- 6.3.4. Other Types
- 6.1. Market Analysis, Insights and Forecast - by Lease Type
- 7. North America Ship Leasing Market Analysis, Insights and Forecast, 2020-2032
- 7.1. Market Analysis, Insights and Forecast - by Lease Type
- 7.1.1. Financial Lease
- 7.1.2. Full-Service Lease
- 7.2. Market Analysis, Insights and Forecast - by Application
- 7.2.1. Container Ships
- 7.2.2. Bulk Carriers
- 7.3. Market Analysis, Insights and Forecast - by Type
- 7.3.1. Real-Time Lease
- 7.3.2. Periodic Tenancy
- 7.3.3. Bareboat Charter
- 7.3.4. Other Types
- 7.1. Market Analysis, Insights and Forecast - by Lease Type
- 8. Europe Ship Leasing Market Analysis, Insights and Forecast, 2020-2032
- 8.1. Market Analysis, Insights and Forecast - by Lease Type
- 8.1.1. Financial Lease
- 8.1.2. Full-Service Lease
- 8.2. Market Analysis, Insights and Forecast - by Application
- 8.2.1. Container Ships
- 8.2.2. Bulk Carriers
- 8.3. Market Analysis, Insights and Forecast - by Type
- 8.3.1. Real-Time Lease
- 8.3.2. Periodic Tenancy
- 8.3.3. Bareboat Charter
- 8.3.4. Other Types
- 8.1. Market Analysis, Insights and Forecast - by Lease Type
- 9. Asia Pacific Ship Leasing Market Analysis, Insights and Forecast, 2020-2032
- 9.1. Market Analysis, Insights and Forecast - by Lease Type
- 9.1.1. Financial Lease
- 9.1.2. Full-Service Lease
- 9.2. Market Analysis, Insights and Forecast - by Application
- 9.2.1. Container Ships
- 9.2.2. Bulk Carriers
- 9.3. Market Analysis, Insights and Forecast - by Type
- 9.3.1. Real-Time Lease
- 9.3.2. Periodic Tenancy
- 9.3.3. Bareboat Charter
- 9.3.4. Other Types
- 9.1. Market Analysis, Insights and Forecast - by Lease Type
- 10. Latin America Ship Leasing Market Analysis, Insights and Forecast, 2020-2032
- 10.1. Market Analysis, Insights and Forecast - by Lease Type
- 10.1.1. Financial Lease
- 10.1.2. Full-Service Lease
- 10.2. Market Analysis, Insights and Forecast - by Application
- 10.2.1. Container Ships
- 10.2.2. Bulk Carriers
- 10.3. Market Analysis, Insights and Forecast - by Type
- 10.3.1. Real-Time Lease
- 10.3.2. Periodic Tenancy
- 10.3.3. Bareboat Charter
- 10.3.4. Other Types
- 10.1. Market Analysis, Insights and Forecast - by Lease Type
- 11. Middle East and Africa Ship Leasing Market Analysis, Insights and Forecast, 2020-2032
- 11.1. Market Analysis, Insights and Forecast - by Lease Type
- 11.1.1. Financial Lease
- 11.1.2. Full-Service Lease
- 11.2. Market Analysis, Insights and Forecast - by Application
- 11.2.1. Container Ships
- 11.2.2. Bulk Carriers
- 11.3. Market Analysis, Insights and Forecast - by Type
- 11.3.1. Real-Time Lease
- 11.3.2. Periodic Tenancy
- 11.3.3. Bareboat Charter
- 11.3.4. Other Types
- 11.1. Market Analysis, Insights and Forecast - by Lease Type
- 12. Competitive Analysis
- 12.1. Company Profiles
- 12.1.1 ICBC Co Ltd
- 12.1.1.1. Company Overview
- 12.1.1.2. Products
- 12.1.1.3. Company Financials
- 12.1.1.4. SWOT Analysis
- 12.1.2 CMB Financial Leasing CO LTD
- 12.1.2.1. Company Overview
- 12.1.2.2. Products
- 12.1.2.3. Company Financials
- 12.1.2.4. SWOT Analysis
- 12.1.3 Hamburg Commercial Bank AG
- 12.1.3.1. Company Overview
- 12.1.3.2. Products
- 12.1.3.3. Company Financials
- 12.1.3.4. SWOT Analysis
- 12.1.4 Minsheng Financial Leasing Co Ltd
- 12.1.4.1. Company Overview
- 12.1.4.2. Products
- 12.1.4.3. Company Financials
- 12.1.4.4. SWOT Analysis
- 12.1.5 First Ship Lease Trust
- 12.1.5.1. Company Overview
- 12.1.5.2. Products
- 12.1.5.3. Company Financials
- 12.1.5.4. SWOT Analysis
- 12.1.6 MUFG Bank Ltd
- 12.1.6.1. Company Overview
- 12.1.6.2. Products
- 12.1.6.3. Company Financials
- 12.1.6.4. SWOT Analysis
- 12.1.7 Bothra Group
- 12.1.7.1. Company Overview
- 12.1.7.2. Products
- 12.1.7.3. Company Financials
- 12.1.7.4. SWOT Analysis
- 12.1.8 Bank of Communications Financial Leasing Co Ltd
- 12.1.8.1. Company Overview
- 12.1.8.2. Products
- 12.1.8.3. Company Financials
- 12.1.8.4. SWOT Analysis
- 12.1.9 Galbraiths Ltd
- 12.1.9.1. Company Overview
- 12.1.9.2. Products
- 12.1.9.3. Company Financials
- 12.1.9.4. SWOT Analysis
- 12.1.10 A P Møller - Mærsk A/S
- 12.1.10.1. Company Overview
- 12.1.10.2. Products
- 12.1.10.3. Company Financials
- 12.1.10.4. SWOT Analysis
- 12.1.11 Global Ship Lease Inc
- 12.1.11.1. Company Overview
- 12.1.11.2. Products
- 12.1.11.3. Company Financials
- 12.1.11.4. SWOT Analysis
- 12.1.1 ICBC Co Ltd
- 12.2. Market Entropy
- 12.2.1 Company's Key Areas Served
- 12.2.2 Recent Developments
- 12.3. Company Market Share Analysis 2025
- 12.3.1 Top 5 Companies Market Share Analysis
- 12.3.2 Top 3 Companies Market Share Analysis
- 12.4. List of Potential Customers
- 13. Research Methodology
List of Figures
- Figure 1: Global Ship Leasing Market Revenue Breakdown (billion, %) by Region 2025 & 2033
- Figure 2: North America Ship Leasing Market Revenue (billion), by Lease Type 2025 & 2033
- Figure 3: North America Ship Leasing Market Revenue Share (%), by Lease Type 2025 & 2033
- Figure 4: North America Ship Leasing Market Revenue (billion), by Application 2025 & 2033
- Figure 5: North America Ship Leasing Market Revenue Share (%), by Application 2025 & 2033
- Figure 6: North America Ship Leasing Market Revenue (billion), by Type 2025 & 2033
- Figure 7: North America Ship Leasing Market Revenue Share (%), by Type 2025 & 2033
- Figure 8: North America Ship Leasing Market Revenue (billion), by Country 2025 & 2033
- Figure 9: North America Ship Leasing Market Revenue Share (%), by Country 2025 & 2033
- Figure 10: Europe Ship Leasing Market Revenue (billion), by Lease Type 2025 & 2033
- Figure 11: Europe Ship Leasing Market Revenue Share (%), by Lease Type 2025 & 2033
- Figure 12: Europe Ship Leasing Market Revenue (billion), by Application 2025 & 2033
- Figure 13: Europe Ship Leasing Market Revenue Share (%), by Application 2025 & 2033
- Figure 14: Europe Ship Leasing Market Revenue (billion), by Type 2025 & 2033
- Figure 15: Europe Ship Leasing Market Revenue Share (%), by Type 2025 & 2033
- Figure 16: Europe Ship Leasing Market Revenue (billion), by Country 2025 & 2033
- Figure 17: Europe Ship Leasing Market Revenue Share (%), by Country 2025 & 2033
- Figure 18: Asia Pacific Ship Leasing Market Revenue (billion), by Lease Type 2025 & 2033
- Figure 19: Asia Pacific Ship Leasing Market Revenue Share (%), by Lease Type 2025 & 2033
- Figure 20: Asia Pacific Ship Leasing Market Revenue (billion), by Application 2025 & 2033
- Figure 21: Asia Pacific Ship Leasing Market Revenue Share (%), by Application 2025 & 2033
- Figure 22: Asia Pacific Ship Leasing Market Revenue (billion), by Type 2025 & 2033
- Figure 23: Asia Pacific Ship Leasing Market Revenue Share (%), by Type 2025 & 2033
- Figure 24: Asia Pacific Ship Leasing Market Revenue (billion), by Country 2025 & 2033
- Figure 25: Asia Pacific Ship Leasing Market Revenue Share (%), by Country 2025 & 2033
- Figure 26: Latin America Ship Leasing Market Revenue (billion), by Lease Type 2025 & 2033
- Figure 27: Latin America Ship Leasing Market Revenue Share (%), by Lease Type 2025 & 2033
- Figure 28: Latin America Ship Leasing Market Revenue (billion), by Application 2025 & 2033
- Figure 29: Latin America Ship Leasing Market Revenue Share (%), by Application 2025 & 2033
- Figure 30: Latin America Ship Leasing Market Revenue (billion), by Type 2025 & 2033
- Figure 31: Latin America Ship Leasing Market Revenue Share (%), by Type 2025 & 2033
- Figure 32: Latin America Ship Leasing Market Revenue (billion), by Country 2025 & 2033
- Figure 33: Latin America Ship Leasing Market Revenue Share (%), by Country 2025 & 2033
- Figure 34: Middle East and Africa Ship Leasing Market Revenue (billion), by Lease Type 2025 & 2033
- Figure 35: Middle East and Africa Ship Leasing Market Revenue Share (%), by Lease Type 2025 & 2033
- Figure 36: Middle East and Africa Ship Leasing Market Revenue (billion), by Application 2025 & 2033
- Figure 37: Middle East and Africa Ship Leasing Market Revenue Share (%), by Application 2025 & 2033
- Figure 38: Middle East and Africa Ship Leasing Market Revenue (billion), by Type 2025 & 2033
- Figure 39: Middle East and Africa Ship Leasing Market Revenue Share (%), by Type 2025 & 2033
- Figure 40: Middle East and Africa Ship Leasing Market Revenue (billion), by Country 2025 & 2033
- Figure 41: Middle East and Africa Ship Leasing Market Revenue Share (%), by Country 2025 & 2033
List of Tables
- Table 1: Global Ship Leasing Market Revenue billion Forecast, by Lease Type 2020 & 2033
- Table 2: Global Ship Leasing Market Revenue billion Forecast, by Application 2020 & 2033
- Table 3: Global Ship Leasing Market Revenue billion Forecast, by Type 2020 & 2033
- Table 4: Global Ship Leasing Market Revenue billion Forecast, by Region 2020 & 2033
- Table 5: Global Ship Leasing Market Revenue billion Forecast, by Lease Type 2020 & 2033
- Table 6: Global Ship Leasing Market Revenue billion Forecast, by Application 2020 & 2033
- Table 7: Global Ship Leasing Market Revenue billion Forecast, by Type 2020 & 2033
- Table 8: Global Ship Leasing Market Revenue billion Forecast, by Country 2020 & 2033
- Table 9: United States Ship Leasing Market Revenue (billion) Forecast, by Application 2020 & 2033
- Table 10: Canada Ship Leasing Market Revenue (billion) Forecast, by Application 2020 & 2033
- Table 11: Global Ship Leasing Market Revenue billion Forecast, by Lease Type 2020 & 2033
- Table 12: Global Ship Leasing Market Revenue billion Forecast, by Application 2020 & 2033
- Table 13: Global Ship Leasing Market Revenue billion Forecast, by Type 2020 & 2033
- Table 14: Global Ship Leasing Market Revenue billion Forecast, by Country 2020 & 2033
- Table 15: United Kingdom Ship Leasing Market Revenue (billion) Forecast, by Application 2020 & 2033
- Table 16: France Ship Leasing Market Revenue (billion) Forecast, by Application 2020 & 2033
- Table 17: Germany Ship Leasing Market Revenue (billion) Forecast, by Application 2020 & 2033
- Table 18: Rest of Europe Ship Leasing Market Revenue (billion) Forecast, by Application 2020 & 2033
- Table 19: Global Ship Leasing Market Revenue billion Forecast, by Lease Type 2020 & 2033
- Table 20: Global Ship Leasing Market Revenue billion Forecast, by Application 2020 & 2033
- Table 21: Global Ship Leasing Market Revenue billion Forecast, by Type 2020 & 2033
- Table 22: Global Ship Leasing Market Revenue billion Forecast, by Country 2020 & 2033
- Table 23: China Ship Leasing Market Revenue (billion) Forecast, by Application 2020 & 2033
- Table 24: India Ship Leasing Market Revenue (billion) Forecast, by Application 2020 & 2033
- Table 25: Japan Ship Leasing Market Revenue (billion) Forecast, by Application 2020 & 2033
- Table 26: South Korea Ship Leasing Market Revenue (billion) Forecast, by Application 2020 & 2033
- Table 27: Rest of Asia Pacific Ship Leasing Market Revenue (billion) Forecast, by Application 2020 & 2033
- Table 28: Global Ship Leasing Market Revenue billion Forecast, by Lease Type 2020 & 2033
- Table 29: Global Ship Leasing Market Revenue billion Forecast, by Application 2020 & 2033
- Table 30: Global Ship Leasing Market Revenue billion Forecast, by Type 2020 & 2033
- Table 31: Global Ship Leasing Market Revenue billion Forecast, by Country 2020 & 2033
- Table 32: Brazil Ship Leasing Market Revenue (billion) Forecast, by Application 2020 & 2033
- Table 33: Rest of Latin America Ship Leasing Market Revenue (billion) Forecast, by Application 2020 & 2033
- Table 34: Global Ship Leasing Market Revenue billion Forecast, by Lease Type 2020 & 2033
- Table 35: Global Ship Leasing Market Revenue billion Forecast, by Application 2020 & 2033
- Table 36: Global Ship Leasing Market Revenue billion Forecast, by Type 2020 & 2033
- Table 37: Global Ship Leasing Market Revenue billion Forecast, by Country 2020 & 2033
- Table 38: United Arab Emirates Ship Leasing Market Revenue (billion) Forecast, by Application 2020 & 2033
- Table 39: Saudi Arabia Ship Leasing Market Revenue (billion) Forecast, by Application 2020 & 2033
- Table 40: South Africa Ship Leasing Market Revenue (billion) Forecast, by Application 2020 & 2033
- Table 41: Rest of Middle East and Africa Ship Leasing Market Revenue (billion) Forecast, by Application 2020 & 2033
Frequently Asked Questions
1. What is the projected Compound Annual Growth Rate (CAGR) of the Ship Leasing Market?
The projected CAGR is approximately 12%.
2. Which companies are prominent players in the Ship Leasing Market?
Key companies in the market include ICBC Co Ltd, CMB Financial Leasing CO LTD, Hamburg Commercial Bank AG, Minsheng Financial Leasing Co Ltd, First Ship Lease Trust, MUFG Bank Ltd, Bothra Group, Bank of Communications Financial Leasing Co Ltd, Galbraiths Ltd, A P Møller - Mærsk A/S, Global Ship Lease Inc.
3. What are the main segments of the Ship Leasing Market?
The market segments include Lease Type, Application, Type.
4. Can you provide details about the market size?
The market size is estimated to be USD 15.78 billion as of 2022.
5. What are some drivers contributing to market growth?
N/A
6. What are the notable trends driving market growth?
Bareboat Charter Segment is Expected to Witness Significant Growth During the Forecast Period.
7. Are there any restraints impacting market growth?
N/A
8. Can you provide examples of recent developments in the market?
N/A
9. What pricing options are available for accessing the report?
Pricing options include single-user, multi-user, and enterprise licenses priced at USD 4750, USD 5250, and USD 8750 respectively.
10. Is the market size provided in terms of value or volume?
The market size is provided in terms of value, measured in billion.
11. Are there any specific market keywords associated with the report?
Yes, the market keyword associated with the report is "Ship Leasing Market," which aids in identifying and referencing the specific market segment covered.
12. How do I determine which pricing option suits my needs best?
The pricing options vary based on user requirements and access needs. Individual users may opt for single-user licenses, while businesses requiring broader access may choose multi-user or enterprise licenses for cost-effective access to the report.
13. Are there any additional resources or data provided in the Ship Leasing Market report?
While the report offers comprehensive insights, it's advisable to review the specific contents or supplementary materials provided to ascertain if additional resources or data are available.
14. How can I stay updated on further developments or reports in the Ship Leasing Market?
To stay informed about further developments, trends, and reports in the Ship Leasing Market, consider subscribing to industry newsletters, following relevant companies and organizations, or regularly checking reputable industry news sources and publications.
Methodology
Step 1 - Identification of Relevant Samples Size from Population Database


Step 2 - Approaches for Defining Global Market Size (Value, Volume* & Price*)

Note*: In applicable scenarios
Step 3 - Data Sources
Primary Research
- Web Analytics
- Survey Reports
- Research Institute
- Latest Research Reports
- Opinion Leaders
Secondary Research
- Annual Reports
- White Paper
- Latest Press Release
- Industry Association
- Paid Database
- Investor Presentations

Step 4 - Data Triangulation
Involves using different sources of information in order to increase the validity of a study
These sources are likely to be stakeholders in a program - participants, other researchers, program staff, other community members, and so on.
Then we put all data in single framework & apply various statistical tools to find out the dynamic on the market.
During the analysis stage, feedback from the stakeholder groups would be compared to determine areas of agreement as well as areas of divergence