

Key Insights
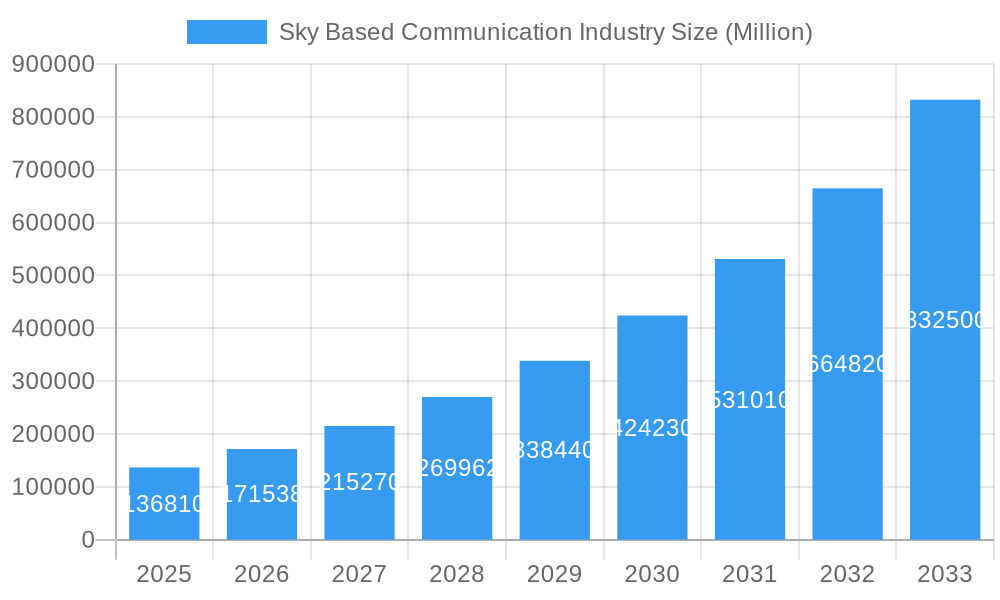
The sky-based communication industry is experiencing robust growth, projected to reach a market size of $136.81 billion in 2025 and exhibiting a Compound Annual Growth Rate (CAGR) of 25.53% from 2019 to 2033. This expansion is driven by several key factors. Increasing demand for high-speed, reliable internet connectivity across remote and underserved areas fuels the adoption of satellite-based solutions. Furthermore, advancements in satellite technology, such as the emergence of low Earth orbit (LEO) constellations, are enhancing data throughput and reducing latency, making sky-based communication more competitive with terrestrial alternatives for applications like IoT, broadband internet access, and navigation systems. The burgeoning aerospace and defense sectors also contribute significantly to the market's growth, as satellite communication is crucial for military operations, surveillance, and intelligence gathering. Growth is also fueled by the increasing adoption of cloud computing and the need for efficient data transfer across continents. Government initiatives aimed at improving digital infrastructure in developing nations further support this positive growth trajectory.
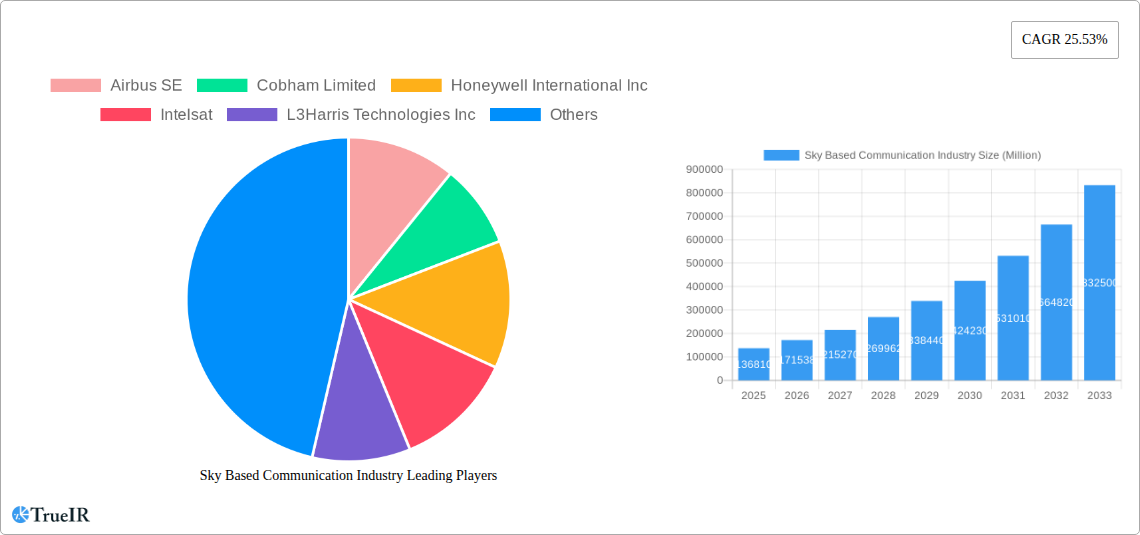
Sky Based Communication Industry Market Size (In Billion)
However, challenges remain. The high capital expenditure associated with satellite development and launch constitutes a major restraint, particularly for smaller players. Regulatory complexities and spectrum allocation issues in different regions create further hurdles for market expansion. Competition from emerging technologies like terrestrial 5G and fiber optic networks also presents a challenge, although the unique advantages of sky-based communication, particularly in terms of coverage and accessibility, maintain its long-term relevance and potential for growth. Despite these challenges, the market is expected to continue its upward trajectory, driven by technological innovations and increasing demand for reliable global connectivity in various sectors. This growth will likely lead to further consolidation within the industry, with larger players acquiring smaller companies to enhance their market share and technological capabilities. Key players like Airbus SE, Cobham Limited, Honeywell International Inc., and others will be central to shaping the future of this dynamic market.
Sky Based Communication Industry Company Market Share
Sky Based Communication Industry Market Report: 2019-2033
This comprehensive report provides an in-depth analysis of the Sky Based Communication Industry, offering invaluable insights for businesses, investors, and stakeholders. With a study period spanning 2019-2033, a base year of 2025, and a forecast period of 2025-2033, this report leverages extensive market data to provide a clear understanding of current market dynamics and future growth potential. The market is expected to reach a value of xx Million by 2033.
Sky Based Communication Industry Market Structure & Competitive Landscape
The Sky Based Communication Industry is characterized by a moderately concentrated market structure, with a handful of major players holding significant market share. The Herfindahl-Hirschman Index (HHI) for the industry in 2024 was estimated at xx, indicating a moderately concentrated market. Key drivers of innovation include advancements in satellite technology, miniaturization of components, and increasing demand for high-bandwidth connectivity. Regulatory impacts, particularly concerning spectrum allocation and international agreements, significantly influence market dynamics. Product substitutes, such as terrestrial communication networks (e.g., 5G), pose a competitive threat, although the unique advantages of sky-based communication, such as wide-area coverage, remain compelling.
The end-user segments are diverse, encompassing government (military and civilian), commercial aviation, maritime, and individual consumers. Mergers and acquisitions (M&A) activity has been significant in recent years, with a total volume of approximately xx Million USD worth of deals in the historical period (2019-2024). This M&A activity reflects the industry's ongoing consolidation and the pursuit of synergies and expansion into new markets.
- Market Concentration: Moderately concentrated, with a HHI of xx in 2024.
- Innovation Drivers: Advancements in satellite technology, miniaturization, demand for high-bandwidth connectivity.
- Regulatory Impacts: Significant influence on spectrum allocation and international agreements.
- Product Substitutes: Terrestrial communication networks (e.g., 5G).
- End-User Segmentation: Government (military and civilian), commercial aviation, maritime, individual consumers.
- M&A Trends: Significant activity (xx Million USD in 2019-2024), reflecting industry consolidation.
Sky Based Communication Industry Market Trends & Opportunities
The Sky Based Communication Industry is experiencing a period of dynamic evolution and robust expansion. This growth is fueled by an escalating global demand for uninterrupted, high-speed, and secure connectivity across a diverse spectrum of industries, from aviation and maritime to defense, broadcasting, and the burgeoning direct-to-consumer satellite internet market. The market size is projected to demonstrate a significant Compound Annual Growth Rate (CAGR) of approximately 12-15% during the forecast period (2025-2033), with an estimated valuation reaching USD 150-200 Billion by 2033. Key technological shifts, notably the proliferation of Low Earth Orbit (LEO) satellite constellations and the synergistic integration with terrestrial 5G networks, are fundamentally reshaping connectivity paradigms. Consumer and enterprise preferences are increasingly leaning towards seamless, ubiquitous connectivity, irrespective of geographical limitations, thereby driving the demand for enhanced coverage, superior bandwidth, and lower latency solutions. The competitive landscape is characterized by intense innovation, strategic alliances, mergers, and acquisitions as both established industry giants and agile new entrants strive to secure substantial market share. Significant advancements in satellite technology, ground infrastructure, and service offerings are expected to drive higher market penetration rates, particularly in previously underserved or unserved regions worldwide.
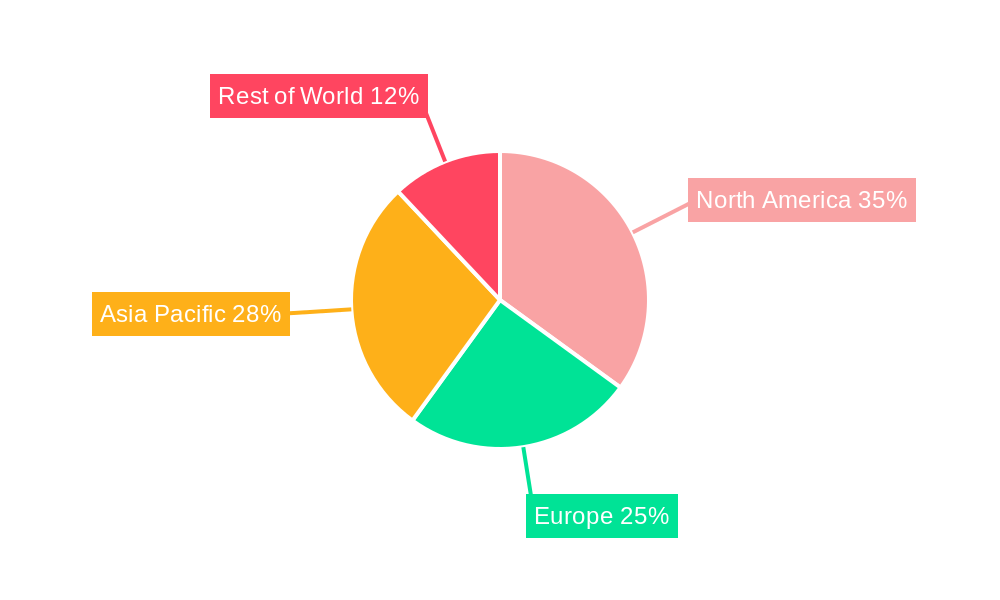
Dominant Markets & Segments in Sky Based Communication Industry
The North American region currently stands as the dominant force within the Sky Based Communication Industry. This leadership is underpinned by substantial and sustained government investment in advanced defense and aerospace technologies, a highly developed and robust commercial aviation sector, and a considerable and growing demand for sophisticated consumer satellite internet services. The region's mature technological ecosystem and forward-thinking regulatory environment further bolster its leading position.
- Key Growth Drivers in North America:
- Significant and ongoing government investment in cutting-edge defense and aerospace research, development, and deployment.
- A strong and continuously expanding commercial aviation sector, necessitating advanced in-flight connectivity solutions.
- High and increasing consumer and enterprise demand for reliable, high-speed satellite internet services, especially in remote or underserved areas.
- A well-established and advanced existing infrastructure, including satellite ground stations, network operations centers, and robust fiber backhaul.
- A strong ecosystem of innovative technology providers and service operators.
Further granular analysis indicates that within North America, the United States commands a particularly significant market share, estimated at approximately 50-60% of the regional market, and is projected to exhibit a robust CAGR of 13-16% during the forecast period. This prominence is a direct result of extensive investments in ambitious defense and space exploration initiatives, a dynamic and thriving commercial aerospace sector, and advanced regulatory frameworks that actively foster industry growth and innovation. Other significant and rapidly growing markets contributing substantially to the global landscape include Europe, driven by its strong aerospace and defense industries, and the Asia-Pacific region, characterized by rapid economic development and increasing demand for connectivity in emerging economies.
Sky Based Communication Industry Product Analysis
The industry offers a diverse range of products and services, encompassing satellite communication systems, ground-based infrastructure, and value-added services. Technological advancements are driving the adoption of high-throughput satellites, enabling increased bandwidth and improved data transmission rates. New applications, such as Internet of Things (IoT) connectivity and enhanced mobility solutions, are expanding the market reach. The competitive advantages lie in superior technology, coverage area, service reliability, and cost-effectiveness.
Key Drivers, Barriers & Challenges in Sky Based Communication Industry
Key Drivers: The increasing demand for high-bandwidth connectivity across various sectors, technological advancements in satellite technology, and government investments in defense and space exploration are key drivers. The development of LEO constellations is further accelerating market growth.
Challenges: Regulatory complexities, such as spectrum allocation and international agreements, pose significant challenges. Supply chain disruptions, especially regarding the sourcing of critical components, can impact manufacturing and delivery timelines. Intense competition from both established players and new entrants, along with the threat of substitute technologies, creates pressures on pricing and profitability. The estimated impact of these challenges on market growth is around xx Million USD annually.
Growth Drivers in the Sky Based Communication Industry Market
The Sky Based Communication Industry's impressive growth trajectory is propelled by a confluence of powerful factors. Paramount among these are continuous and rapid technological advancements in satellite design, manufacturing, and launch capabilities, alongside substantial government expenditure on defense modernization and ambitious space exploration programs. The ever-increasing global demand for high-bandwidth data services for applications ranging from video streaming and cloud computing to enterprise operations is a critical impetus. Furthermore, the exponential expansion of the Internet of Things (IoT), which requires connectivity in remote and mobile environments, is a significant demand driver. The strategic deployment and operationalization of innovative LEO satellite constellations are fundamentally revolutionizing access to global broadband services, offering lower latency and more affordable solutions than traditional geostationary satellites. Advancements in software-defined satellites and artificial intelligence for network management are also enhancing efficiency and service delivery.
Challenges Impacting Sky Based Communication Industry Growth
Regulatory hurdles in obtaining spectrum licenses, along with the complexities of international collaborations, hinder expansion. Supply chain constraints and geopolitical uncertainties impact the availability of crucial components and increase manufacturing costs. Strong competition among existing and emerging players results in price wars and reduced profit margins.
Key Players Shaping the Sky Based Communication Industry Market
Significant Sky Based Communication Industry Industry Milestones
- February 2024: Northrop Grumman announced a significant contract awarded to Viasat Inc. for the integration of Viasat's advanced ViaSat-3 Satellite Communications Network with key US Air Force platforms. This strategic collaboration aims to substantially enhance the military's command, control, and communication capabilities in complex operational environments, ensuring resilient and secure data transmission.
- October 2023: Honeywell announced securing a multi-year contract valued at approximately USD 900 Million from the US Space Force. This pivotal contract is dedicated to bolstering the Space Force's Proliferated Low Earth Orbit (PLEO) program, signifying a major commitment to leveraging advanced, scalable satellite technologies for critical national security missions and accelerating the adoption of next-generation satellite communication solutions.
- March 2024: Eutelsat OneWeb announced the successful demonstration of seamless 5G integration with its LEO satellite network, showcasing enhanced interoperability and a significant step towards unified global communication infrastructures.
- April 2024: Starlink (SpaceX) announced achieving a new milestone in global coverage, extending its satellite internet services to an additional 10 countries, further expanding its reach into previously underserved markets and providing vital connectivity solutions.
Future Outlook for Sky Based Communication Industry Market
The Sky Based Communication Industry is exceptionally well-positioned for sustained and accelerated expansion in the coming years. This optimistic outlook is primarily driven by ongoing rapid technological innovation and a continuously escalating global demand for highly reliable, secure, and high-performance connectivity solutions. The widespread deployment of next-generation satellite constellations, characterized by enhanced capabilities and efficiency, coupled with increasingly sophisticated integration strategies with terrestrial 5G and future 6G networks, will unlock novel opportunities for new services and applications. Strategic partnerships, cross-industry collaborations, and joint ventures will become even more vital as companies navigate the intensely competitive landscape, optimize resource allocation, and strategically capture market share. The market is projected to experience sustained and robust growth, propelled by relentless innovation, the expanding utility of satellite communication across an ever-wider array of sectors including remote sensing, scientific research, and the metaverse, and the fundamental global reliance on resilient and pervasive connectivity.
Sky Based Communication Industry Segmentation
-
1. Application
- 1.1. Telecommunication
- 1.2. Broadband
- 1.3. Navigation
- 1.4. Remote Sensing
- 1.5. Broadcasting
- 1.6. Other Applications
-
2. Type
- 2.1. Low Earth Orbit (LEO)
- 2.2. Medium Earth Orbit (MEO)
-
3. End User
- 3.1. Military and Government
- 3.2. Commercial
Sky Based Communication Industry Segmentation By Geography
-
1. North America
- 1.1. United States
- 1.2. Canada
-
2. Europe
- 2.1. United Kingdom
- 2.2. France
- 2.3. Germany
- 2.4. Russia
- 2.5. Rest of Europe
-
3. Asia Pacific
- 3.1. India
- 3.2. China
- 3.3. Japan
- 3.4. South Korea
- 3.5. Rest of Asia Pacific
-
4. Latin America
- 4.1. Brazil
- 4.2. Rest of Latin America
-
5. Middle East and Africa
- 5.1. United Arab Emirates
- 5.2. Saudi Arabia
- 5.3. Israel
- 5.4. Rest of Middle East and Africa
Sky Based Communication Industry Regional Market Share
Geographic Coverage of Sky Based Communication Industry
Sky Based Communication Industry REPORT HIGHLIGHTS
| Aspects | Details |
|---|---|
| Study Period | 2020-2034 |
| Base Year | 2025 |
| Estimated Year | 2026 |
| Forecast Period | 2026-2034 |
| Historical Period | 2020-2025 |
| Growth Rate | CAGR of 25.53% from 2020-2034 |
| Segmentation |
|
Table of Contents
- 1. Introduction
- 1.1. Research Scope
- 1.2. Market Segmentation
- 1.3. Research Objective
- 1.4. Definitions and Assumptions
- 2. Executive Summary
- 2.1. Market Snapshot
- 3. Market Dynamics
- 3.1. Market Drivers
- 3.2. Market Restrains
- 3.3. Market Trends
- 3.4. Market Opportunities
- 4. Market Factor Analysis
- 4.1. Porters Five Forces
- 4.1.1. Bargaining Power of Suppliers
- 4.1.2. Bargaining Power of Buyers
- 4.1.3. Threat of New Entrants
- 4.1.4. Threat of Substitutes
- 4.1.5. Competitive Rivalry
- 4.2. PESTEL analysis
- 4.3. BCG Analysis
- 4.3.1. Stars (High Growth, High Market Share)
- 4.3.2. Cash Cows (Low Growth, High Market Share)
- 4.3.3. Question Mark (High Growth, Low Market Share)
- 4.3.4. Dogs (Low Growth, Low Market Share)
- 4.4. Ansoff Matrix Analysis
- 4.5. Supply Chain Analysis
- 4.6. Regulatory Landscape
- 4.7. Current Market Potential and Opportunity Assessment (TAM–SAM–SOM Framework)
- 4.8. TIR Analyst Note
- 4.1. Porters Five Forces
- 5. Market Analysis, Insights and Forecast 2021-2033
- 5.1. Market Analysis, Insights and Forecast - by Application
- 5.1.1. Telecommunication
- 5.1.2. Broadband
- 5.1.3. Navigation
- 5.1.4. Remote Sensing
- 5.1.5. Broadcasting
- 5.1.6. Other Applications
- 5.2. Market Analysis, Insights and Forecast - by Type
- 5.2.1. Low Earth Orbit (LEO)
- 5.2.2. Medium Earth Orbit (MEO)
- 5.3. Market Analysis, Insights and Forecast - by End User
- 5.3.1. Military and Government
- 5.3.2. Commercial
- 5.4. Market Analysis, Insights and Forecast - by Region
- 5.4.1. North America
- 5.4.2. Europe
- 5.4.3. Asia Pacific
- 5.4.4. Latin America
- 5.4.5. Middle East and Africa
- 5.1. Market Analysis, Insights and Forecast - by Application
- 6. Global Sky Based Communication Industry Analysis, Insights and Forecast, 2021-2033
- 6.1. Market Analysis, Insights and Forecast - by Application
- 6.1.1. Telecommunication
- 6.1.2. Broadband
- 6.1.3. Navigation
- 6.1.4. Remote Sensing
- 6.1.5. Broadcasting
- 6.1.6. Other Applications
- 6.2. Market Analysis, Insights and Forecast - by Type
- 6.2.1. Low Earth Orbit (LEO)
- 6.2.2. Medium Earth Orbit (MEO)
- 6.3. Market Analysis, Insights and Forecast - by End User
- 6.3.1. Military and Government
- 6.3.2. Commercial
- 6.1. Market Analysis, Insights and Forecast - by Application
- 7. North America Sky Based Communication Industry Analysis, Insights and Forecast, 2020-2032
- 7.1. Market Analysis, Insights and Forecast - by Application
- 7.1.1. Telecommunication
- 7.1.2. Broadband
- 7.1.3. Navigation
- 7.1.4. Remote Sensing
- 7.1.5. Broadcasting
- 7.1.6. Other Applications
- 7.2. Market Analysis, Insights and Forecast - by Type
- 7.2.1. Low Earth Orbit (LEO)
- 7.2.2. Medium Earth Orbit (MEO)
- 7.3. Market Analysis, Insights and Forecast - by End User
- 7.3.1. Military and Government
- 7.3.2. Commercial
- 7.1. Market Analysis, Insights and Forecast - by Application
- 8. Europe Sky Based Communication Industry Analysis, Insights and Forecast, 2020-2032
- 8.1. Market Analysis, Insights and Forecast - by Application
- 8.1.1. Telecommunication
- 8.1.2. Broadband
- 8.1.3. Navigation
- 8.1.4. Remote Sensing
- 8.1.5. Broadcasting
- 8.1.6. Other Applications
- 8.2. Market Analysis, Insights and Forecast - by Type
- 8.2.1. Low Earth Orbit (LEO)
- 8.2.2. Medium Earth Orbit (MEO)
- 8.3. Market Analysis, Insights and Forecast - by End User
- 8.3.1. Military and Government
- 8.3.2. Commercial
- 8.1. Market Analysis, Insights and Forecast - by Application
- 9. Asia Pacific Sky Based Communication Industry Analysis, Insights and Forecast, 2020-2032
- 9.1. Market Analysis, Insights and Forecast - by Application
- 9.1.1. Telecommunication
- 9.1.2. Broadband
- 9.1.3. Navigation
- 9.1.4. Remote Sensing
- 9.1.5. Broadcasting
- 9.1.6. Other Applications
- 9.2. Market Analysis, Insights and Forecast - by Type
- 9.2.1. Low Earth Orbit (LEO)
- 9.2.2. Medium Earth Orbit (MEO)
- 9.3. Market Analysis, Insights and Forecast - by End User
- 9.3.1. Military and Government
- 9.3.2. Commercial
- 9.1. Market Analysis, Insights and Forecast - by Application
- 10. Latin America Sky Based Communication Industry Analysis, Insights and Forecast, 2020-2032
- 10.1. Market Analysis, Insights and Forecast - by Application
- 10.1.1. Telecommunication
- 10.1.2. Broadband
- 10.1.3. Navigation
- 10.1.4. Remote Sensing
- 10.1.5. Broadcasting
- 10.1.6. Other Applications
- 10.2. Market Analysis, Insights and Forecast - by Type
- 10.2.1. Low Earth Orbit (LEO)
- 10.2.2. Medium Earth Orbit (MEO)
- 10.3. Market Analysis, Insights and Forecast - by End User
- 10.3.1. Military and Government
- 10.3.2. Commercial
- 10.1. Market Analysis, Insights and Forecast - by Application
- 11. Middle East and Africa Sky Based Communication Industry Analysis, Insights and Forecast, 2020-2032
- 11.1. Market Analysis, Insights and Forecast - by Application
- 11.1.1. Telecommunication
- 11.1.2. Broadband
- 11.1.3. Navigation
- 11.1.4. Remote Sensing
- 11.1.5. Broadcasting
- 11.1.6. Other Applications
- 11.2. Market Analysis, Insights and Forecast - by Type
- 11.2.1. Low Earth Orbit (LEO)
- 11.2.2. Medium Earth Orbit (MEO)
- 11.3. Market Analysis, Insights and Forecast - by End User
- 11.3.1. Military and Government
- 11.3.2. Commercial
- 11.1. Market Analysis, Insights and Forecast - by Application
- 12. Competitive Analysis
- 12.1. Company Profiles
- 12.1.1 Airbus SE
- 12.1.1.1. Company Overview
- 12.1.1.2. Products
- 12.1.1.3. Company Financials
- 12.1.1.4. SWOT Analysis
- 12.1.2 Cobham Limited
- 12.1.2.1. Company Overview
- 12.1.2.2. Products
- 12.1.2.3. Company Financials
- 12.1.2.4. SWOT Analysis
- 12.1.3 Honeywell International Inc
- 12.1.3.1. Company Overview
- 12.1.3.2. Products
- 12.1.3.3. Company Financials
- 12.1.3.4. SWOT Analysis
- 12.1.4 Intelsat
- 12.1.4.1. Company Overview
- 12.1.4.2. Products
- 12.1.4.3. Company Financials
- 12.1.4.4. SWOT Analysis
- 12.1.5 L3Harris Technologies Inc
- 12.1.5.1. Company Overview
- 12.1.5.2. Products
- 12.1.5.3. Company Financials
- 12.1.5.4. SWOT Analysis
- 12.1.6 Maxar Technologies Inc
- 12.1.6.1. Company Overview
- 12.1.6.2. Products
- 12.1.6.3. Company Financials
- 12.1.6.4. SWOT Analysis
- 12.1.7 THALES
- 12.1.7.1. Company Overview
- 12.1.7.2. Products
- 12.1.7.3. Company Financials
- 12.1.7.4. SWOT Analysis
- 12.1.8 Viasat Inc
- 12.1.8.1. Company Overview
- 12.1.8.2. Products
- 12.1.8.3. Company Financials
- 12.1.8.4. SWOT Analysis
- 12.1.9 Inmarsat Global Limited
- 12.1.9.1. Company Overview
- 12.1.9.2. Products
- 12.1.9.3. Company Financials
- 12.1.9.4. SWOT Analysis
- 12.1.10 Iridium Communications Inc
- 12.1.10.1. Company Overview
- 12.1.10.2. Products
- 12.1.10.3. Company Financials
- 12.1.10.4. SWOT Analysis
- 12.1.1 Airbus SE
- 12.2. Market Entropy
- 12.2.1 Company's Key Areas Served
- 12.2.2 Recent Developments
- 12.3. Company Market Share Analysis 2025
- 12.3.1 Top 5 Companies Market Share Analysis
- 12.3.2 Top 3 Companies Market Share Analysis
- 12.4. List of Potential Customers
- 13. Research Methodology
List of Figures
- Figure 1: Global Sky Based Communication Industry Revenue Breakdown (Million, %) by Region 2025 & 2033
- Figure 2: Global Sky Based Communication Industry Volume Breakdown (Billion, %) by Region 2025 & 2033
- Figure 3: North America Sky Based Communication Industry Revenue (Million), by Application 2025 & 2033
- Figure 4: North America Sky Based Communication Industry Volume (Billion), by Application 2025 & 2033
- Figure 5: North America Sky Based Communication Industry Revenue Share (%), by Application 2025 & 2033
- Figure 6: North America Sky Based Communication Industry Volume Share (%), by Application 2025 & 2033
- Figure 7: North America Sky Based Communication Industry Revenue (Million), by Type 2025 & 2033
- Figure 8: North America Sky Based Communication Industry Volume (Billion), by Type 2025 & 2033
- Figure 9: North America Sky Based Communication Industry Revenue Share (%), by Type 2025 & 2033
- Figure 10: North America Sky Based Communication Industry Volume Share (%), by Type 2025 & 2033
- Figure 11: North America Sky Based Communication Industry Revenue (Million), by End User 2025 & 2033
- Figure 12: North America Sky Based Communication Industry Volume (Billion), by End User 2025 & 2033
- Figure 13: North America Sky Based Communication Industry Revenue Share (%), by End User 2025 & 2033
- Figure 14: North America Sky Based Communication Industry Volume Share (%), by End User 2025 & 2033
- Figure 15: North America Sky Based Communication Industry Revenue (Million), by Country 2025 & 2033
- Figure 16: North America Sky Based Communication Industry Volume (Billion), by Country 2025 & 2033
- Figure 17: North America Sky Based Communication Industry Revenue Share (%), by Country 2025 & 2033
- Figure 18: North America Sky Based Communication Industry Volume Share (%), by Country 2025 & 2033
- Figure 19: Europe Sky Based Communication Industry Revenue (Million), by Application 2025 & 2033
- Figure 20: Europe Sky Based Communication Industry Volume (Billion), by Application 2025 & 2033
- Figure 21: Europe Sky Based Communication Industry Revenue Share (%), by Application 2025 & 2033
- Figure 22: Europe Sky Based Communication Industry Volume Share (%), by Application 2025 & 2033
- Figure 23: Europe Sky Based Communication Industry Revenue (Million), by Type 2025 & 2033
- Figure 24: Europe Sky Based Communication Industry Volume (Billion), by Type 2025 & 2033
- Figure 25: Europe Sky Based Communication Industry Revenue Share (%), by Type 2025 & 2033
- Figure 26: Europe Sky Based Communication Industry Volume Share (%), by Type 2025 & 2033
- Figure 27: Europe Sky Based Communication Industry Revenue (Million), by End User 2025 & 2033
- Figure 28: Europe Sky Based Communication Industry Volume (Billion), by End User 2025 & 2033
- Figure 29: Europe Sky Based Communication Industry Revenue Share (%), by End User 2025 & 2033
- Figure 30: Europe Sky Based Communication Industry Volume Share (%), by End User 2025 & 2033
- Figure 31: Europe Sky Based Communication Industry Revenue (Million), by Country 2025 & 2033
- Figure 32: Europe Sky Based Communication Industry Volume (Billion), by Country 2025 & 2033
- Figure 33: Europe Sky Based Communication Industry Revenue Share (%), by Country 2025 & 2033
- Figure 34: Europe Sky Based Communication Industry Volume Share (%), by Country 2025 & 2033
- Figure 35: Asia Pacific Sky Based Communication Industry Revenue (Million), by Application 2025 & 2033
- Figure 36: Asia Pacific Sky Based Communication Industry Volume (Billion), by Application 2025 & 2033
- Figure 37: Asia Pacific Sky Based Communication Industry Revenue Share (%), by Application 2025 & 2033
- Figure 38: Asia Pacific Sky Based Communication Industry Volume Share (%), by Application 2025 & 2033
- Figure 39: Asia Pacific Sky Based Communication Industry Revenue (Million), by Type 2025 & 2033
- Figure 40: Asia Pacific Sky Based Communication Industry Volume (Billion), by Type 2025 & 2033
- Figure 41: Asia Pacific Sky Based Communication Industry Revenue Share (%), by Type 2025 & 2033
- Figure 42: Asia Pacific Sky Based Communication Industry Volume Share (%), by Type 2025 & 2033
- Figure 43: Asia Pacific Sky Based Communication Industry Revenue (Million), by End User 2025 & 2033
- Figure 44: Asia Pacific Sky Based Communication Industry Volume (Billion), by End User 2025 & 2033
- Figure 45: Asia Pacific Sky Based Communication Industry Revenue Share (%), by End User 2025 & 2033
- Figure 46: Asia Pacific Sky Based Communication Industry Volume Share (%), by End User 2025 & 2033
- Figure 47: Asia Pacific Sky Based Communication Industry Revenue (Million), by Country 2025 & 2033
- Figure 48: Asia Pacific Sky Based Communication Industry Volume (Billion), by Country 2025 & 2033
- Figure 49: Asia Pacific Sky Based Communication Industry Revenue Share (%), by Country 2025 & 2033
- Figure 50: Asia Pacific Sky Based Communication Industry Volume Share (%), by Country 2025 & 2033
- Figure 51: Latin America Sky Based Communication Industry Revenue (Million), by Application 2025 & 2033
- Figure 52: Latin America Sky Based Communication Industry Volume (Billion), by Application 2025 & 2033
- Figure 53: Latin America Sky Based Communication Industry Revenue Share (%), by Application 2025 & 2033
- Figure 54: Latin America Sky Based Communication Industry Volume Share (%), by Application 2025 & 2033
- Figure 55: Latin America Sky Based Communication Industry Revenue (Million), by Type 2025 & 2033
- Figure 56: Latin America Sky Based Communication Industry Volume (Billion), by Type 2025 & 2033
- Figure 57: Latin America Sky Based Communication Industry Revenue Share (%), by Type 2025 & 2033
- Figure 58: Latin America Sky Based Communication Industry Volume Share (%), by Type 2025 & 2033
- Figure 59: Latin America Sky Based Communication Industry Revenue (Million), by End User 2025 & 2033
- Figure 60: Latin America Sky Based Communication Industry Volume (Billion), by End User 2025 & 2033
- Figure 61: Latin America Sky Based Communication Industry Revenue Share (%), by End User 2025 & 2033
- Figure 62: Latin America Sky Based Communication Industry Volume Share (%), by End User 2025 & 2033
- Figure 63: Latin America Sky Based Communication Industry Revenue (Million), by Country 2025 & 2033
- Figure 64: Latin America Sky Based Communication Industry Volume (Billion), by Country 2025 & 2033
- Figure 65: Latin America Sky Based Communication Industry Revenue Share (%), by Country 2025 & 2033
- Figure 66: Latin America Sky Based Communication Industry Volume Share (%), by Country 2025 & 2033
- Figure 67: Middle East and Africa Sky Based Communication Industry Revenue (Million), by Application 2025 & 2033
- Figure 68: Middle East and Africa Sky Based Communication Industry Volume (Billion), by Application 2025 & 2033
- Figure 69: Middle East and Africa Sky Based Communication Industry Revenue Share (%), by Application 2025 & 2033
- Figure 70: Middle East and Africa Sky Based Communication Industry Volume Share (%), by Application 2025 & 2033
- Figure 71: Middle East and Africa Sky Based Communication Industry Revenue (Million), by Type 2025 & 2033
- Figure 72: Middle East and Africa Sky Based Communication Industry Volume (Billion), by Type 2025 & 2033
- Figure 73: Middle East and Africa Sky Based Communication Industry Revenue Share (%), by Type 2025 & 2033
- Figure 74: Middle East and Africa Sky Based Communication Industry Volume Share (%), by Type 2025 & 2033
- Figure 75: Middle East and Africa Sky Based Communication Industry Revenue (Million), by End User 2025 & 2033
- Figure 76: Middle East and Africa Sky Based Communication Industry Volume (Billion), by End User 2025 & 2033
- Figure 77: Middle East and Africa Sky Based Communication Industry Revenue Share (%), by End User 2025 & 2033
- Figure 78: Middle East and Africa Sky Based Communication Industry Volume Share (%), by End User 2025 & 2033
- Figure 79: Middle East and Africa Sky Based Communication Industry Revenue (Million), by Country 2025 & 2033
- Figure 80: Middle East and Africa Sky Based Communication Industry Volume (Billion), by Country 2025 & 2033
- Figure 81: Middle East and Africa Sky Based Communication Industry Revenue Share (%), by Country 2025 & 2033
- Figure 82: Middle East and Africa Sky Based Communication Industry Volume Share (%), by Country 2025 & 2033
List of Tables
- Table 1: Global Sky Based Communication Industry Revenue Million Forecast, by Application 2020 & 2033
- Table 2: Global Sky Based Communication Industry Volume Billion Forecast, by Application 2020 & 2033
- Table 3: Global Sky Based Communication Industry Revenue Million Forecast, by Type 2020 & 2033
- Table 4: Global Sky Based Communication Industry Volume Billion Forecast, by Type 2020 & 2033
- Table 5: Global Sky Based Communication Industry Revenue Million Forecast, by End User 2020 & 2033
- Table 6: Global Sky Based Communication Industry Volume Billion Forecast, by End User 2020 & 2033
- Table 7: Global Sky Based Communication Industry Revenue Million Forecast, by Region 2020 & 2033
- Table 8: Global Sky Based Communication Industry Volume Billion Forecast, by Region 2020 & 2033
- Table 9: Global Sky Based Communication Industry Revenue Million Forecast, by Application 2020 & 2033
- Table 10: Global Sky Based Communication Industry Volume Billion Forecast, by Application 2020 & 2033
- Table 11: Global Sky Based Communication Industry Revenue Million Forecast, by Type 2020 & 2033
- Table 12: Global Sky Based Communication Industry Volume Billion Forecast, by Type 2020 & 2033
- Table 13: Global Sky Based Communication Industry Revenue Million Forecast, by End User 2020 & 2033
- Table 14: Global Sky Based Communication Industry Volume Billion Forecast, by End User 2020 & 2033
- Table 15: Global Sky Based Communication Industry Revenue Million Forecast, by Country 2020 & 2033
- Table 16: Global Sky Based Communication Industry Volume Billion Forecast, by Country 2020 & 2033
- Table 17: United States Sky Based Communication Industry Revenue (Million) Forecast, by Application 2020 & 2033
- Table 18: United States Sky Based Communication Industry Volume (Billion) Forecast, by Application 2020 & 2033
- Table 19: Canada Sky Based Communication Industry Revenue (Million) Forecast, by Application 2020 & 2033
- Table 20: Canada Sky Based Communication Industry Volume (Billion) Forecast, by Application 2020 & 2033
- Table 21: Global Sky Based Communication Industry Revenue Million Forecast, by Application 2020 & 2033
- Table 22: Global Sky Based Communication Industry Volume Billion Forecast, by Application 2020 & 2033
- Table 23: Global Sky Based Communication Industry Revenue Million Forecast, by Type 2020 & 2033
- Table 24: Global Sky Based Communication Industry Volume Billion Forecast, by Type 2020 & 2033
- Table 25: Global Sky Based Communication Industry Revenue Million Forecast, by End User 2020 & 2033
- Table 26: Global Sky Based Communication Industry Volume Billion Forecast, by End User 2020 & 2033
- Table 27: Global Sky Based Communication Industry Revenue Million Forecast, by Country 2020 & 2033
- Table 28: Global Sky Based Communication Industry Volume Billion Forecast, by Country 2020 & 2033
- Table 29: United Kingdom Sky Based Communication Industry Revenue (Million) Forecast, by Application 2020 & 2033
- Table 30: United Kingdom Sky Based Communication Industry Volume (Billion) Forecast, by Application 2020 & 2033
- Table 31: France Sky Based Communication Industry Revenue (Million) Forecast, by Application 2020 & 2033
- Table 32: France Sky Based Communication Industry Volume (Billion) Forecast, by Application 2020 & 2033
- Table 33: Germany Sky Based Communication Industry Revenue (Million) Forecast, by Application 2020 & 2033
- Table 34: Germany Sky Based Communication Industry Volume (Billion) Forecast, by Application 2020 & 2033
- Table 35: Russia Sky Based Communication Industry Revenue (Million) Forecast, by Application 2020 & 2033
- Table 36: Russia Sky Based Communication Industry Volume (Billion) Forecast, by Application 2020 & 2033
- Table 37: Rest of Europe Sky Based Communication Industry Revenue (Million) Forecast, by Application 2020 & 2033
- Table 38: Rest of Europe Sky Based Communication Industry Volume (Billion) Forecast, by Application 2020 & 2033
- Table 39: Global Sky Based Communication Industry Revenue Million Forecast, by Application 2020 & 2033
- Table 40: Global Sky Based Communication Industry Volume Billion Forecast, by Application 2020 & 2033
- Table 41: Global Sky Based Communication Industry Revenue Million Forecast, by Type 2020 & 2033
- Table 42: Global Sky Based Communication Industry Volume Billion Forecast, by Type 2020 & 2033
- Table 43: Global Sky Based Communication Industry Revenue Million Forecast, by End User 2020 & 2033
- Table 44: Global Sky Based Communication Industry Volume Billion Forecast, by End User 2020 & 2033
- Table 45: Global Sky Based Communication Industry Revenue Million Forecast, by Country 2020 & 2033
- Table 46: Global Sky Based Communication Industry Volume Billion Forecast, by Country 2020 & 2033
- Table 47: India Sky Based Communication Industry Revenue (Million) Forecast, by Application 2020 & 2033
- Table 48: India Sky Based Communication Industry Volume (Billion) Forecast, by Application 2020 & 2033
- Table 49: China Sky Based Communication Industry Revenue (Million) Forecast, by Application 2020 & 2033
- Table 50: China Sky Based Communication Industry Volume (Billion) Forecast, by Application 2020 & 2033
- Table 51: Japan Sky Based Communication Industry Revenue (Million) Forecast, by Application 2020 & 2033
- Table 52: Japan Sky Based Communication Industry Volume (Billion) Forecast, by Application 2020 & 2033
- Table 53: South Korea Sky Based Communication Industry Revenue (Million) Forecast, by Application 2020 & 2033
- Table 54: South Korea Sky Based Communication Industry Volume (Billion) Forecast, by Application 2020 & 2033
- Table 55: Rest of Asia Pacific Sky Based Communication Industry Revenue (Million) Forecast, by Application 2020 & 2033
- Table 56: Rest of Asia Pacific Sky Based Communication Industry Volume (Billion) Forecast, by Application 2020 & 2033
- Table 57: Global Sky Based Communication Industry Revenue Million Forecast, by Application 2020 & 2033
- Table 58: Global Sky Based Communication Industry Volume Billion Forecast, by Application 2020 & 2033
- Table 59: Global Sky Based Communication Industry Revenue Million Forecast, by Type 2020 & 2033
- Table 60: Global Sky Based Communication Industry Volume Billion Forecast, by Type 2020 & 2033
- Table 61: Global Sky Based Communication Industry Revenue Million Forecast, by End User 2020 & 2033
- Table 62: Global Sky Based Communication Industry Volume Billion Forecast, by End User 2020 & 2033
- Table 63: Global Sky Based Communication Industry Revenue Million Forecast, by Country 2020 & 2033
- Table 64: Global Sky Based Communication Industry Volume Billion Forecast, by Country 2020 & 2033
- Table 65: Brazil Sky Based Communication Industry Revenue (Million) Forecast, by Application 2020 & 2033
- Table 66: Brazil Sky Based Communication Industry Volume (Billion) Forecast, by Application 2020 & 2033
- Table 67: Rest of Latin America Sky Based Communication Industry Revenue (Million) Forecast, by Application 2020 & 2033
- Table 68: Rest of Latin America Sky Based Communication Industry Volume (Billion) Forecast, by Application 2020 & 2033
- Table 69: Global Sky Based Communication Industry Revenue Million Forecast, by Application 2020 & 2033
- Table 70: Global Sky Based Communication Industry Volume Billion Forecast, by Application 2020 & 2033
- Table 71: Global Sky Based Communication Industry Revenue Million Forecast, by Type 2020 & 2033
- Table 72: Global Sky Based Communication Industry Volume Billion Forecast, by Type 2020 & 2033
- Table 73: Global Sky Based Communication Industry Revenue Million Forecast, by End User 2020 & 2033
- Table 74: Global Sky Based Communication Industry Volume Billion Forecast, by End User 2020 & 2033
- Table 75: Global Sky Based Communication Industry Revenue Million Forecast, by Country 2020 & 2033
- Table 76: Global Sky Based Communication Industry Volume Billion Forecast, by Country 2020 & 2033
- Table 77: United Arab Emirates Sky Based Communication Industry Revenue (Million) Forecast, by Application 2020 & 2033
- Table 78: United Arab Emirates Sky Based Communication Industry Volume (Billion) Forecast, by Application 2020 & 2033
- Table 79: Saudi Arabia Sky Based Communication Industry Revenue (Million) Forecast, by Application 2020 & 2033
- Table 80: Saudi Arabia Sky Based Communication Industry Volume (Billion) Forecast, by Application 2020 & 2033
- Table 81: Israel Sky Based Communication Industry Revenue (Million) Forecast, by Application 2020 & 2033
- Table 82: Israel Sky Based Communication Industry Volume (Billion) Forecast, by Application 2020 & 2033
- Table 83: Rest of Middle East and Africa Sky Based Communication Industry Revenue (Million) Forecast, by Application 2020 & 2033
- Table 84: Rest of Middle East and Africa Sky Based Communication Industry Volume (Billion) Forecast, by Application 2020 & 2033
Frequently Asked Questions
1. What is the projected Compound Annual Growth Rate (CAGR) of the Sky Based Communication Industry?
The projected CAGR is approximately 25.53%.
2. Which companies are prominent players in the Sky Based Communication Industry?
Key companies in the market include Airbus SE, Cobham Limited, Honeywell International Inc, Intelsat, L3Harris Technologies Inc, Maxar Technologies Inc, THALES, Viasat Inc, Inmarsat Global Limited, Iridium Communications Inc.
3. What are the main segments of the Sky Based Communication Industry?
The market segments include Application, Type, End User.
4. Can you provide details about the market size?
The market size is estimated to be USD 136.81 Million as of 2022.
5. What are some drivers contributing to market growth?
N/A
6. What are the notable trends driving market growth?
The Low Earth Orbit (LEO) Segment is Expected to Dominate the Market During the Forecast Period.
7. Are there any restraints impacting market growth?
N/A
8. Can you provide examples of recent developments in the market?
February 2024: Northrop Grumman awarded Viasat Inc. a contract to bolster the US Air Force Research Laboratory (AFRL) initiative. Under this agreement, Viasat will deploy its ViaSat-3 Satellite Communications Network, facilitating seamless, high-bandwidth satellite internet access for military personnel aboard USAF aircraft and ground vehicles.
9. What pricing options are available for accessing the report?
Pricing options include single-user, multi-user, and enterprise licenses priced at USD 4750, USD 5250, and USD 8750 respectively.
10. Is the market size provided in terms of value or volume?
The market size is provided in terms of value, measured in Million and volume, measured in Billion.
11. Are there any specific market keywords associated with the report?
Yes, the market keyword associated with the report is "Sky Based Communication Industry," which aids in identifying and referencing the specific market segment covered.
12. How do I determine which pricing option suits my needs best?
The pricing options vary based on user requirements and access needs. Individual users may opt for single-user licenses, while businesses requiring broader access may choose multi-user or enterprise licenses for cost-effective access to the report.
13. Are there any additional resources or data provided in the Sky Based Communication Industry report?
While the report offers comprehensive insights, it's advisable to review the specific contents or supplementary materials provided to ascertain if additional resources or data are available.
14. How can I stay updated on further developments or reports in the Sky Based Communication Industry?
To stay informed about further developments, trends, and reports in the Sky Based Communication Industry, consider subscribing to industry newsletters, following relevant companies and organizations, or regularly checking reputable industry news sources and publications.
Methodology
Step 1 - Identification of Relevant Samples Size from Population Database


Step 2 - Approaches for Defining Global Market Size (Value, Volume* & Price*)

Note*: In applicable scenarios
Step 3 - Data Sources
Primary Research
- Web Analytics
- Survey Reports
- Research Institute
- Latest Research Reports
- Opinion Leaders
Secondary Research
- Annual Reports
- White Paper
- Latest Press Release
- Industry Association
- Paid Database
- Investor Presentations

Step 4 - Data Triangulation
Involves using different sources of information in order to increase the validity of a study
These sources are likely to be stakeholders in a program - participants, other researchers, program staff, other community members, and so on.
Then we put all data in single framework & apply various statistical tools to find out the dynamic on the market.
During the analysis stage, feedback from the stakeholder groups would be compared to determine areas of agreement as well as areas of divergence