

Key Insights
The Global Smart Agricultural Weather Station market is projected for significant expansion, driven by the escalating demand for precision agriculture and optimized crop management. The market is forecast to reach a size of USD 2.5 billion by 2025, exhibiting a Compound Annual Growth Rate (CAGR) of approximately 8% from the base year 2025 through 2033. This growth is accelerated by the integration of IoT and AI in agriculture, facilitating real-time data collection and analysis for enhanced irrigation, pest management, and fertilization strategies. The imperative to boost agricultural efficiency and sustainability amid climate change and rising global food demand further fuels market expansion. Farmers are increasingly acknowledging the economic and environmental advantages of smart weather stations in mitigating weather-related risks, leading to improved crop yields and superior produce quality.
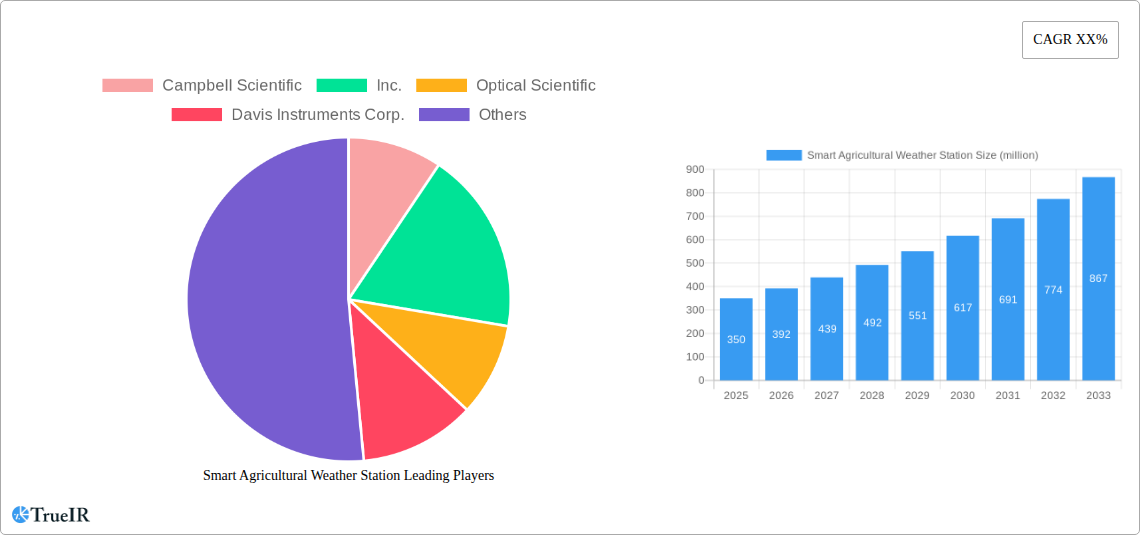
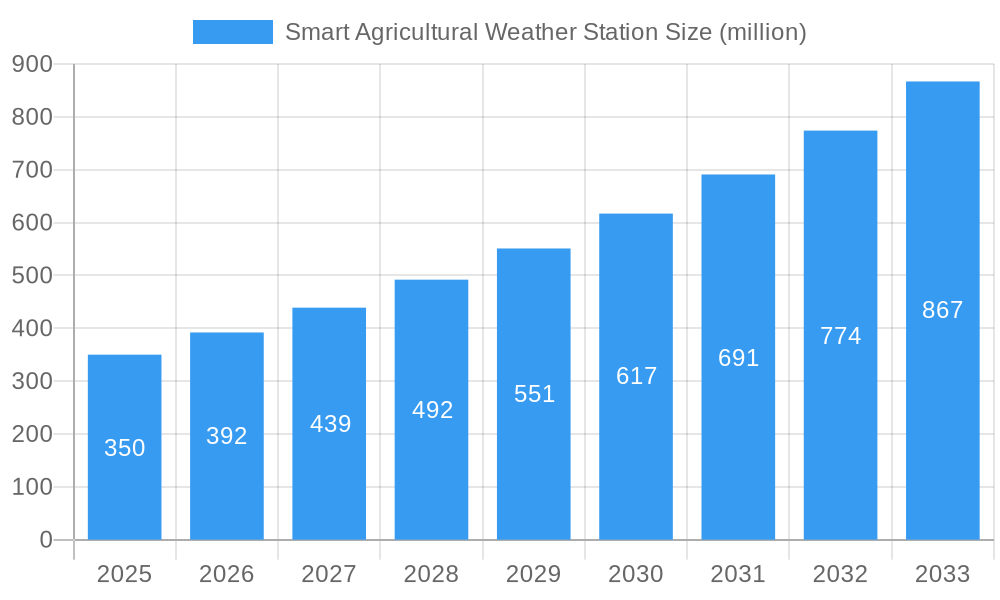
Smart Agricultural Weather Station Market Size (In Billion)
Key market segments include agriculture, forestry, and animal husbandry, with agriculture representing the largest sector. Both portable and fixed agricultural weather stations are experiencing robust demand. Portable units provide adaptability for varied farm sizes and dynamic field conditions, while fixed stations ensure continuous, high-precision monitoring. Leading innovators such as Campbell Scientific, Inc., Davis Instruments Corp., and Sencrop are driving advancements with solutions featuring solar power, cellular connectivity, and integrated data analytics platforms. Geographically, the Asia Pacific region, particularly China and India, is anticipated to be a primary growth driver due to rapid agricultural modernization and supportive government initiatives for smart farming. North America and Europe remain substantial markets, characterized by established precision agriculture practices and advanced technological adoption. Barriers such as initial investment and the requirement for technical expertise are being overcome through the development of more intuitive interfaces and the widespread availability of cloud-based data services.
Smart Agricultural Weather Station Company Market Share
Smart Agricultural Weather Station Market Structure & Competitive Landscape
The global Smart Agricultural Weather Station market, projected to reach over 1,500 million USD by 2033, exhibits a moderately concentrated structure. Key players like Campbell Scientific, Inc., Davis Instruments Corp., and RainWise, Inc. command significant market share due to their long-standing presence and robust product portfolios. Innovation drivers are primarily fueled by advancements in IoT technology, sensor accuracy, and data analytics, enabling precision agriculture and enhancing crop yield predictions. Regulatory impacts, while generally supportive of agricultural technology adoption, can vary by region, influencing deployment strategies. Product substitutes include manual weather monitoring and less sophisticated data loggers, though these lack the real-time, interconnected capabilities of smart stations. End-user segmentation reveals agriculture as the dominant application, followed by forestry and animal husbandry, each with specific data needs. Mergers and acquisitions (M&A) activity, though not currently at massive volumes, is a growing trend as larger technology firms seek to expand into the agri-tech space and smaller innovators are acquired for their specialized expertise. Anticipated M&A volumes in the forecast period are expected to reach over 100 million USD annually.
Smart Agricultural Weather Station Market Trends & Opportunities
The Smart Agricultural Weather Station market is poised for substantial growth, with an estimated market size exceeding 1,500 million USD by 2033. This growth is underpinned by a Compound Annual Growth Rate (CAGR) of approximately 8.5% during the forecast period of 2025–2033. Technological shifts are central to this expansion, with the integration of advanced sensors for hyper-local weather monitoring, soil moisture analysis, and pest/disease forecasting becoming standard. The proliferation of IoT connectivity and cloud-based platforms is enabling seamless data collection, analysis, and actionable insights for farmers. Consumer preferences are increasingly driven by the demand for sustainable agricultural practices, reduced resource wastage, and improved crop yields, all of which smart weather stations directly support. Market penetration rates for smart weather stations in developed agricultural economies are expected to exceed 60% by 2033, creating significant opportunities for both established and emerging players. The competitive dynamics are evolving, with a growing emphasis on integrated solutions that combine weather data with farm management software, AI-driven advisory services, and traceability features. This trend presents opportunities for strategic partnerships and the development of comprehensive digital agriculture ecosystems. The increasing adoption of precision farming techniques globally is a primary catalyst, as farmers recognize the economic and environmental benefits of optimizing irrigation, fertilization, and pest control based on real-time weather data. Furthermore, the growing awareness of climate change impacts and the need for resilient agricultural systems are driving demand for advanced weather monitoring solutions. The development of more affordable and user-friendly smart weather stations is also crucial for expanding market reach into developing agricultural regions, further fueling growth. The continuous miniaturization and cost reduction of sensor technology, coupled with advancements in wireless communication protocols, are making these systems more accessible to a wider range of agricultural operations, from large commercial farms to smaller family-run enterprises.
Dominant Markets & Segments in Smart Agricultural Weather Station
The Agriculture segment firmly dominates the Smart Agricultural Weather Station market, driven by its direct impact on crop yield, resource management, and risk mitigation. Within this segment, the Fixed Agricultural Weather Station type holds a commanding position, accounting for an estimated 75% of the market. This dominance is attributed to its ability to provide continuous, reliable data critical for long-term farm planning, irrigation scheduling, and disease forecasting. The key growth drivers in this segment include the global push for food security, the increasing adoption of precision agriculture technologies, and government initiatives promoting sustainable farming practices. Infrastructure development, such as improved internet connectivity in rural areas, further facilitates the deployment and utilization of fixed stations. Policies supporting smart farming, including subsidies for technology adoption and incentives for data-driven decision-making, are also significant growth catalysts. Countries like the United States, China, and those within the European Union are leading the charge in market penetration due to their advanced agricultural sectors and proactive adoption of new technologies.
- Agriculture Application: This segment represents the largest share due to the direct correlation between weather data and crop health, yield, and resource optimization.
- Key Growth Drivers:
- Increasing demand for high-value crops.
- Need for efficient water and fertilizer management.
- Early detection and mitigation of crop diseases and pests.
- Supportive government policies and subsidies for agri-tech adoption.
- Key Growth Drivers:
- Fixed Agricultural Weather Station Type: Preferred for its continuous data stream and reliability in monitoring long-term weather patterns essential for farm operations.
- Key Growth Drivers:
- Demand for hyper-local, real-time weather data for critical farm decisions.
- Integration with farm management software for automated decision-making.
- Improved sensor accuracy and durability for outdoor environments.
- Growing investment in smart farm infrastructure.
- Key Growth Drivers:
- Forestry Application: Growing adoption for fire risk assessment, pest monitoring, and resource management in forest ecosystems.
- Key Growth Drivers:
- Increased focus on climate change impacts and forest resilience.
- Demand for accurate data for wildfire prediction and prevention.
- Technological advancements in remote sensing and data integration.
- Key Growth Drivers:
- Animal Husbandry Application: Essential for monitoring environmental conditions affecting livestock health, welfare, and productivity.
- Key Growth Drivers:
- Focus on animal welfare and optimizing living conditions.
- Need for data to manage disease outbreaks and environmental stress.
- Integration with smart barn systems for automated climate control.
- Key Growth Drivers:
Smart Agricultural Weather Station Product Analysis
Smart Agricultural Weather Stations are revolutionizing farming through advanced sensor technology and seamless data integration. Innovations focus on increased accuracy for parameters like temperature, humidity, wind speed, precipitation, and solar radiation, alongside advanced capabilities for soil moisture, leaf wetness, and atmospheric pressure. Competitive advantages lie in their ability to provide real-time, hyper-local weather insights, enabling precision irrigation, optimized pest and disease management, and improved crop yield forecasting. The integration with IoT platforms and cloud analytics allows for data-driven decision-making, predictive modeling, and remote monitoring, offering significant ROI for agricultural operations.
Key Drivers, Barriers & Challenges in Smart Agricultural Weather Station
Key Drivers: The Smart Agricultural Weather Station market is propelled by several key drivers. Technological advancements in sensor accuracy, miniaturization, and IoT connectivity are making these systems more accessible and powerful. The growing global demand for food, coupled with the need for sustainable agricultural practices to enhance crop yields and reduce resource wastage, is a significant economic driver. Supportive government policies and initiatives promoting precision agriculture and digital farming further fuel adoption. The increasing awareness among farmers about the benefits of data-driven decision-making for risk mitigation and operational efficiency is also a crucial factor.
Barriers & Challenges: Despite strong growth, the market faces certain barriers and challenges. The initial cost of advanced smart weather stations can be a restraint for smallholder farmers or those in developing regions. Supply chain issues related to sensor components and electronic manufacturing can impact availability and lead times. Regulatory hurdles, particularly concerning data privacy and ownership, may arise as data collection becomes more extensive. Competitive pressures from established players and emerging startups can lead to price wars and affect profit margins. Educating farmers on the effective utilization of the collected data and ensuring user-friendly interfaces are also critical challenges to overcome for wider market penetration.
Growth Drivers in the Smart Agricultural Weather Station Market
The Smart Agricultural Weather Station market is experiencing robust growth driven by a confluence of technological, economic, and policy factors. The relentless advancement in IoT and sensor technology is leading to more accurate, reliable, and affordable weather monitoring solutions. Economically, the increasing global demand for food security necessitates optimized agricultural output, where precise weather data plays a pivotal role in maximizing crop yields and minimizing losses due to adverse weather conditions. Furthermore, the growing emphasis on sustainable agriculture and resource management, particularly water and fertilizer, makes smart weather stations indispensable tools for efficient operations. Government initiatives and subsidies aimed at promoting precision agriculture and digital transformation in the farming sector are creating a favorable policy environment.
Challenges Impacting Smart Agricultural Weather Station Growth
Several challenges can impede the growth trajectory of the Smart Agricultural Weather Station market. A significant barrier remains the initial investment cost associated with sophisticated systems, which can be prohibitive for smaller farms or those in developing economies. Supply chain disruptions for critical electronic components and sensors can lead to production delays and increased costs. Regulatory complexities regarding data privacy, data ownership, and interoperability standards can create uncertainty and slow down adoption. Intense competitive pressures among a growing number of manufacturers may lead to price erosion, impacting profitability. Moreover, the effective integration of data with existing farm management systems and ensuring user-friendly interfaces for farmers require ongoing development and support.
Key Players Shaping the Smart Agricultural Weather Station Market
- Campbell Scientific, Inc.
- Optical Scientific, Inc.
- Davis Instruments Corp.
- Netatmo
- RainWise, Inc.
- Agricolus
- Cordulus
- Agrii
- Sencrop
- Kestrel Instruments
- Environdata
- Rika Sensors
- NiuBoL
- Darrera
- Ambient
- AcuRite
- Shandong Fengtu Internet of Things Technology Co.,Ltd.
- Wuhan Fuyuan Feike Electronic Technology Co.,Ltd.
- Zhejiang Top Cloud-Agri Technology Co.,Ltd.
Significant Smart Agricultural Weather Station Industry Milestones
- 2019: Increased adoption of cloud-based data platforms for remote weather station management and analysis.
- 2020: Introduction of more affordable, connected portable weather stations for broader market accessibility.
- 2021: Major advancements in AI-driven predictive analytics for weather-related crop disease forecasting integrated with weather station data.
- 2022: Growing focus on hyper-local weather sensing capabilities, including specialized sensors for microclimates.
- 2023: Strategic partnerships between weather station manufacturers and farm management software providers to offer integrated solutions.
- 2024: Enhanced integration of soil moisture and nutrient sensors with agricultural weather stations for a holistic farm monitoring approach.
Future Outlook for Smart Agricultural Weather Station Market
The future outlook for the Smart Agricultural Weather Station market is exceptionally bright, fueled by continued technological innovation and the imperative for sustainable, efficient agriculture. Growth catalysts include the widespread adoption of 5G technology, enabling faster and more reliable data transmission, and the increasing sophistication of AI algorithms for advanced predictive insights. The market is expected to see a surge in demand for integrated smart farming solutions that combine weather data with other farm operations, creating a comprehensive digital ecosystem. Opportunities lie in expanding into emerging agricultural markets and developing specialized solutions for niche applications within forestry and animal husbandry. The market's trajectory indicates a sustained period of growth, driven by the undeniable benefits of data-driven precision agriculture.
Smart Agricultural Weather Station Segmentation
-
1. Application
- 1.1. Agriculture
- 1.2. Forestry
- 1.3. Animal Husbandry
-
2. Types
- 2.1. Portable Agricultural Weather Station
- 2.2. Fixed Agricultural Weather Station
Smart Agricultural Weather Station Segmentation By Geography
-
1. North America
- 1.1. United States
- 1.2. Canada
- 1.3. Mexico
-
2. South America
- 2.1. Brazil
- 2.2. Argentina
- 2.3. Rest of South America
-
3. Europe
- 3.1. United Kingdom
- 3.2. Germany
- 3.3. France
- 3.4. Italy
- 3.5. Spain
- 3.6. Russia
- 3.7. Benelux
- 3.8. Nordics
- 3.9. Rest of Europe
-
4. Middle East & Africa
- 4.1. Turkey
- 4.2. Israel
- 4.3. GCC
- 4.4. North Africa
- 4.5. South Africa
- 4.6. Rest of Middle East & Africa
-
5. Asia Pacific
- 5.1. China
- 5.2. India
- 5.3. Japan
- 5.4. South Korea
- 5.5. ASEAN
- 5.6. Oceania
- 5.7. Rest of Asia Pacific
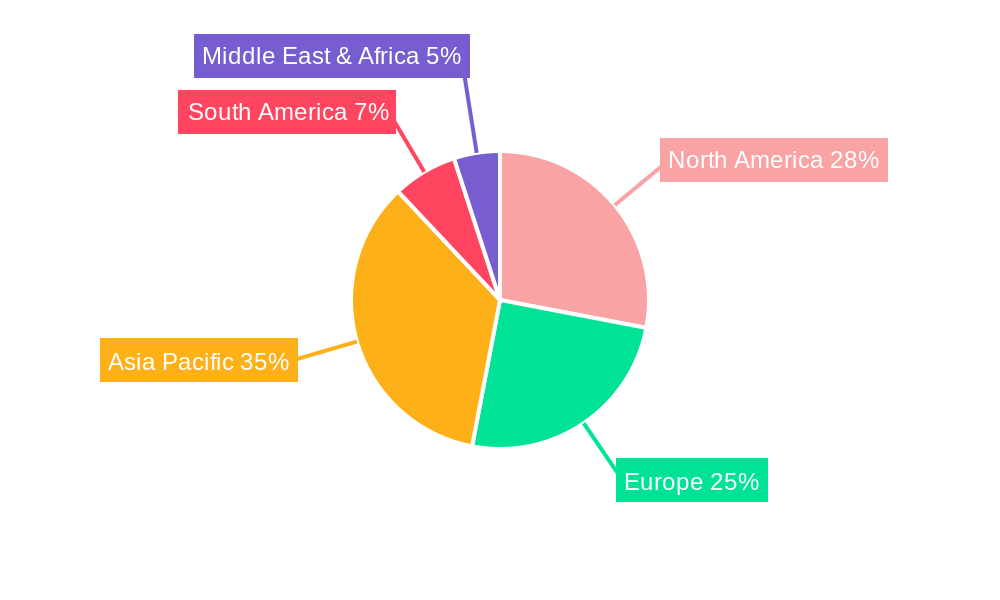
Smart Agricultural Weather Station Regional Market Share
Geographic Coverage of Smart Agricultural Weather Station
Smart Agricultural Weather Station REPORT HIGHLIGHTS
| Aspects | Details |
|---|---|
| Study Period | 2020-2034 |
| Base Year | 2025 |
| Estimated Year | 2026 |
| Forecast Period | 2026-2034 |
| Historical Period | 2020-2025 |
| Growth Rate | CAGR of 8% from 2020-2034 |
| Segmentation |
|
Table of Contents
- 1. Introduction
- 1.1. Research Scope
- 1.2. Market Segmentation
- 1.3. Research Methodology
- 1.4. Definitions and Assumptions
- 2. Executive Summary
- 2.1. Introduction
- 3. Market Dynamics
- 3.1. Introduction
- 3.2. Market Drivers
- 3.3. Market Restrains
- 3.4. Market Trends
- 4. Market Factor Analysis
- 4.1. Porters Five Forces
- 4.2. Supply/Value Chain
- 4.3. PESTEL analysis
- 4.4. Market Entropy
- 4.5. Patent/Trademark Analysis
- 5. Global Smart Agricultural Weather Station Analysis, Insights and Forecast, 2020-2032
- 5.1. Market Analysis, Insights and Forecast - by Application
- 5.1.1. Agriculture
- 5.1.2. Forestry
- 5.1.3. Animal Husbandry
- 5.2. Market Analysis, Insights and Forecast - by Types
- 5.2.1. Portable Agricultural Weather Station
- 5.2.2. Fixed Agricultural Weather Station
- 5.3. Market Analysis, Insights and Forecast - by Region
- 5.3.1. North America
- 5.3.2. South America
- 5.3.3. Europe
- 5.3.4. Middle East & Africa
- 5.3.5. Asia Pacific
- 5.1. Market Analysis, Insights and Forecast - by Application
- 6. North America Smart Agricultural Weather Station Analysis, Insights and Forecast, 2020-2032
- 6.1. Market Analysis, Insights and Forecast - by Application
- 6.1.1. Agriculture
- 6.1.2. Forestry
- 6.1.3. Animal Husbandry
- 6.2. Market Analysis, Insights and Forecast - by Types
- 6.2.1. Portable Agricultural Weather Station
- 6.2.2. Fixed Agricultural Weather Station
- 6.1. Market Analysis, Insights and Forecast - by Application
- 7. South America Smart Agricultural Weather Station Analysis, Insights and Forecast, 2020-2032
- 7.1. Market Analysis, Insights and Forecast - by Application
- 7.1.1. Agriculture
- 7.1.2. Forestry
- 7.1.3. Animal Husbandry
- 7.2. Market Analysis, Insights and Forecast - by Types
- 7.2.1. Portable Agricultural Weather Station
- 7.2.2. Fixed Agricultural Weather Station
- 7.1. Market Analysis, Insights and Forecast - by Application
- 8. Europe Smart Agricultural Weather Station Analysis, Insights and Forecast, 2020-2032
- 8.1. Market Analysis, Insights and Forecast - by Application
- 8.1.1. Agriculture
- 8.1.2. Forestry
- 8.1.3. Animal Husbandry
- 8.2. Market Analysis, Insights and Forecast - by Types
- 8.2.1. Portable Agricultural Weather Station
- 8.2.2. Fixed Agricultural Weather Station
- 8.1. Market Analysis, Insights and Forecast - by Application
- 9. Middle East & Africa Smart Agricultural Weather Station Analysis, Insights and Forecast, 2020-2032
- 9.1. Market Analysis, Insights and Forecast - by Application
- 9.1.1. Agriculture
- 9.1.2. Forestry
- 9.1.3. Animal Husbandry
- 9.2. Market Analysis, Insights and Forecast - by Types
- 9.2.1. Portable Agricultural Weather Station
- 9.2.2. Fixed Agricultural Weather Station
- 9.1. Market Analysis, Insights and Forecast - by Application
- 10. Asia Pacific Smart Agricultural Weather Station Analysis, Insights and Forecast, 2020-2032
- 10.1. Market Analysis, Insights and Forecast - by Application
- 10.1.1. Agriculture
- 10.1.2. Forestry
- 10.1.3. Animal Husbandry
- 10.2. Market Analysis, Insights and Forecast - by Types
- 10.2.1. Portable Agricultural Weather Station
- 10.2.2. Fixed Agricultural Weather Station
- 10.1. Market Analysis, Insights and Forecast - by Application
- 11. Competitive Analysis
- 11.1. Global Market Share Analysis 2025
- 11.2. Company Profiles
- 11.2.1 Campbell Scientific
- 11.2.1.1. Overview
- 11.2.1.2. Products
- 11.2.1.3. SWOT Analysis
- 11.2.1.4. Recent Developments
- 11.2.1.5. Financials (Based on Availability)
- 11.2.2 Inc.
- 11.2.2.1. Overview
- 11.2.2.2. Products
- 11.2.2.3. SWOT Analysis
- 11.2.2.4. Recent Developments
- 11.2.2.5. Financials (Based on Availability)
- 11.2.3 Optical Scientific
- 11.2.3.1. Overview
- 11.2.3.2. Products
- 11.2.3.3. SWOT Analysis
- 11.2.3.4. Recent Developments
- 11.2.3.5. Financials (Based on Availability)
- 11.2.4 Inc.
- 11.2.4.1. Overview
- 11.2.4.2. Products
- 11.2.4.3. SWOT Analysis
- 11.2.4.4. Recent Developments
- 11.2.4.5. Financials (Based on Availability)
- 11.2.5 Davis Instruments Corp.
- 11.2.5.1. Overview
- 11.2.5.2. Products
- 11.2.5.3. SWOT Analysis
- 11.2.5.4. Recent Developments
- 11.2.5.5. Financials (Based on Availability)
- 11.2.6 Netatmo
- 11.2.6.1. Overview
- 11.2.6.2. Products
- 11.2.6.3. SWOT Analysis
- 11.2.6.4. Recent Developments
- 11.2.6.5. Financials (Based on Availability)
- 11.2.7 RainWise
- 11.2.7.1. Overview
- 11.2.7.2. Products
- 11.2.7.3. SWOT Analysis
- 11.2.7.4. Recent Developments
- 11.2.7.5. Financials (Based on Availability)
- 11.2.8 Inc.
- 11.2.8.1. Overview
- 11.2.8.2. Products
- 11.2.8.3. SWOT Analysis
- 11.2.8.4. Recent Developments
- 11.2.8.5. Financials (Based on Availability)
- 11.2.9 Agricolus
- 11.2.9.1. Overview
- 11.2.9.2. Products
- 11.2.9.3. SWOT Analysis
- 11.2.9.4. Recent Developments
- 11.2.9.5. Financials (Based on Availability)
- 11.2.10 Cordulus
- 11.2.10.1. Overview
- 11.2.10.2. Products
- 11.2.10.3. SWOT Analysis
- 11.2.10.4. Recent Developments
- 11.2.10.5. Financials (Based on Availability)
- 11.2.11 Agrii
- 11.2.11.1. Overview
- 11.2.11.2. Products
- 11.2.11.3. SWOT Analysis
- 11.2.11.4. Recent Developments
- 11.2.11.5. Financials (Based on Availability)
- 11.2.12 Sencrop
- 11.2.12.1. Overview
- 11.2.12.2. Products
- 11.2.12.3. SWOT Analysis
- 11.2.12.4. Recent Developments
- 11.2.12.5. Financials (Based on Availability)
- 11.2.13 Kestrel Instruments
- 11.2.13.1. Overview
- 11.2.13.2. Products
- 11.2.13.3. SWOT Analysis
- 11.2.13.4. Recent Developments
- 11.2.13.5. Financials (Based on Availability)
- 11.2.14 Environdata
- 11.2.14.1. Overview
- 11.2.14.2. Products
- 11.2.14.3. SWOT Analysis
- 11.2.14.4. Recent Developments
- 11.2.14.5. Financials (Based on Availability)
- 11.2.15 Rika Sensors
- 11.2.15.1. Overview
- 11.2.15.2. Products
- 11.2.15.3. SWOT Analysis
- 11.2.15.4. Recent Developments
- 11.2.15.5. Financials (Based on Availability)
- 11.2.16 NiuBoL
- 11.2.16.1. Overview
- 11.2.16.2. Products
- 11.2.16.3. SWOT Analysis
- 11.2.16.4. Recent Developments
- 11.2.16.5. Financials (Based on Availability)
- 11.2.17 Darrera
- 11.2.17.1. Overview
- 11.2.17.2. Products
- 11.2.17.3. SWOT Analysis
- 11.2.17.4. Recent Developments
- 11.2.17.5. Financials (Based on Availability)
- 11.2.18 Ambient
- 11.2.18.1. Overview
- 11.2.18.2. Products
- 11.2.18.3. SWOT Analysis
- 11.2.18.4. Recent Developments
- 11.2.18.5. Financials (Based on Availability)
- 11.2.19 AcuRite
- 11.2.19.1. Overview
- 11.2.19.2. Products
- 11.2.19.3. SWOT Analysis
- 11.2.19.4. Recent Developments
- 11.2.19.5. Financials (Based on Availability)
- 11.2.20 Shandong Fengtu Internet of Things Technology Co.
- 11.2.20.1. Overview
- 11.2.20.2. Products
- 11.2.20.3. SWOT Analysis
- 11.2.20.4. Recent Developments
- 11.2.20.5. Financials (Based on Availability)
- 11.2.21 Ltd.
- 11.2.21.1. Overview
- 11.2.21.2. Products
- 11.2.21.3. SWOT Analysis
- 11.2.21.4. Recent Developments
- 11.2.21.5. Financials (Based on Availability)
- 11.2.22 Wuhan Fuyuan Feike Electronic Technology Co.
- 11.2.22.1. Overview
- 11.2.22.2. Products
- 11.2.22.3. SWOT Analysis
- 11.2.22.4. Recent Developments
- 11.2.22.5. Financials (Based on Availability)
- 11.2.23 Ltd.
- 11.2.23.1. Overview
- 11.2.23.2. Products
- 11.2.23.3. SWOT Analysis
- 11.2.23.4. Recent Developments
- 11.2.23.5. Financials (Based on Availability)
- 11.2.24 Zhejiang Top Cloud-Agri Technology Co.
- 11.2.24.1. Overview
- 11.2.24.2. Products
- 11.2.24.3. SWOT Analysis
- 11.2.24.4. Recent Developments
- 11.2.24.5. Financials (Based on Availability)
- 11.2.25 Ltd.
- 11.2.25.1. Overview
- 11.2.25.2. Products
- 11.2.25.3. SWOT Analysis
- 11.2.25.4. Recent Developments
- 11.2.25.5. Financials (Based on Availability)
- 11.2.1 Campbell Scientific
List of Figures
- Figure 1: Global Smart Agricultural Weather Station Revenue Breakdown (billion, %) by Region 2025 & 2033
- Figure 2: Global Smart Agricultural Weather Station Volume Breakdown (K, %) by Region 2025 & 2033
- Figure 3: North America Smart Agricultural Weather Station Revenue (billion), by Application 2025 & 2033
- Figure 4: North America Smart Agricultural Weather Station Volume (K), by Application 2025 & 2033
- Figure 5: North America Smart Agricultural Weather Station Revenue Share (%), by Application 2025 & 2033
- Figure 6: North America Smart Agricultural Weather Station Volume Share (%), by Application 2025 & 2033
- Figure 7: North America Smart Agricultural Weather Station Revenue (billion), by Types 2025 & 2033
- Figure 8: North America Smart Agricultural Weather Station Volume (K), by Types 2025 & 2033
- Figure 9: North America Smart Agricultural Weather Station Revenue Share (%), by Types 2025 & 2033
- Figure 10: North America Smart Agricultural Weather Station Volume Share (%), by Types 2025 & 2033
- Figure 11: North America Smart Agricultural Weather Station Revenue (billion), by Country 2025 & 2033
- Figure 12: North America Smart Agricultural Weather Station Volume (K), by Country 2025 & 2033
- Figure 13: North America Smart Agricultural Weather Station Revenue Share (%), by Country 2025 & 2033
- Figure 14: North America Smart Agricultural Weather Station Volume Share (%), by Country 2025 & 2033
- Figure 15: South America Smart Agricultural Weather Station Revenue (billion), by Application 2025 & 2033
- Figure 16: South America Smart Agricultural Weather Station Volume (K), by Application 2025 & 2033
- Figure 17: South America Smart Agricultural Weather Station Revenue Share (%), by Application 2025 & 2033
- Figure 18: South America Smart Agricultural Weather Station Volume Share (%), by Application 2025 & 2033
- Figure 19: South America Smart Agricultural Weather Station Revenue (billion), by Types 2025 & 2033
- Figure 20: South America Smart Agricultural Weather Station Volume (K), by Types 2025 & 2033
- Figure 21: South America Smart Agricultural Weather Station Revenue Share (%), by Types 2025 & 2033
- Figure 22: South America Smart Agricultural Weather Station Volume Share (%), by Types 2025 & 2033
- Figure 23: South America Smart Agricultural Weather Station Revenue (billion), by Country 2025 & 2033
- Figure 24: South America Smart Agricultural Weather Station Volume (K), by Country 2025 & 2033
- Figure 25: South America Smart Agricultural Weather Station Revenue Share (%), by Country 2025 & 2033
- Figure 26: South America Smart Agricultural Weather Station Volume Share (%), by Country 2025 & 2033
- Figure 27: Europe Smart Agricultural Weather Station Revenue (billion), by Application 2025 & 2033
- Figure 28: Europe Smart Agricultural Weather Station Volume (K), by Application 2025 & 2033
- Figure 29: Europe Smart Agricultural Weather Station Revenue Share (%), by Application 2025 & 2033
- Figure 30: Europe Smart Agricultural Weather Station Volume Share (%), by Application 2025 & 2033
- Figure 31: Europe Smart Agricultural Weather Station Revenue (billion), by Types 2025 & 2033
- Figure 32: Europe Smart Agricultural Weather Station Volume (K), by Types 2025 & 2033
- Figure 33: Europe Smart Agricultural Weather Station Revenue Share (%), by Types 2025 & 2033
- Figure 34: Europe Smart Agricultural Weather Station Volume Share (%), by Types 2025 & 2033
- Figure 35: Europe Smart Agricultural Weather Station Revenue (billion), by Country 2025 & 2033
- Figure 36: Europe Smart Agricultural Weather Station Volume (K), by Country 2025 & 2033
- Figure 37: Europe Smart Agricultural Weather Station Revenue Share (%), by Country 2025 & 2033
- Figure 38: Europe Smart Agricultural Weather Station Volume Share (%), by Country 2025 & 2033
- Figure 39: Middle East & Africa Smart Agricultural Weather Station Revenue (billion), by Application 2025 & 2033
- Figure 40: Middle East & Africa Smart Agricultural Weather Station Volume (K), by Application 2025 & 2033
- Figure 41: Middle East & Africa Smart Agricultural Weather Station Revenue Share (%), by Application 2025 & 2033
- Figure 42: Middle East & Africa Smart Agricultural Weather Station Volume Share (%), by Application 2025 & 2033
- Figure 43: Middle East & Africa Smart Agricultural Weather Station Revenue (billion), by Types 2025 & 2033
- Figure 44: Middle East & Africa Smart Agricultural Weather Station Volume (K), by Types 2025 & 2033
- Figure 45: Middle East & Africa Smart Agricultural Weather Station Revenue Share (%), by Types 2025 & 2033
- Figure 46: Middle East & Africa Smart Agricultural Weather Station Volume Share (%), by Types 2025 & 2033
- Figure 47: Middle East & Africa Smart Agricultural Weather Station Revenue (billion), by Country 2025 & 2033
- Figure 48: Middle East & Africa Smart Agricultural Weather Station Volume (K), by Country 2025 & 2033
- Figure 49: Middle East & Africa Smart Agricultural Weather Station Revenue Share (%), by Country 2025 & 2033
- Figure 50: Middle East & Africa Smart Agricultural Weather Station Volume Share (%), by Country 2025 & 2033
- Figure 51: Asia Pacific Smart Agricultural Weather Station Revenue (billion), by Application 2025 & 2033
- Figure 52: Asia Pacific Smart Agricultural Weather Station Volume (K), by Application 2025 & 2033
- Figure 53: Asia Pacific Smart Agricultural Weather Station Revenue Share (%), by Application 2025 & 2033
- Figure 54: Asia Pacific Smart Agricultural Weather Station Volume Share (%), by Application 2025 & 2033
- Figure 55: Asia Pacific Smart Agricultural Weather Station Revenue (billion), by Types 2025 & 2033
- Figure 56: Asia Pacific Smart Agricultural Weather Station Volume (K), by Types 2025 & 2033
- Figure 57: Asia Pacific Smart Agricultural Weather Station Revenue Share (%), by Types 2025 & 2033
- Figure 58: Asia Pacific Smart Agricultural Weather Station Volume Share (%), by Types 2025 & 2033
- Figure 59: Asia Pacific Smart Agricultural Weather Station Revenue (billion), by Country 2025 & 2033
- Figure 60: Asia Pacific Smart Agricultural Weather Station Volume (K), by Country 2025 & 2033
- Figure 61: Asia Pacific Smart Agricultural Weather Station Revenue Share (%), by Country 2025 & 2033
- Figure 62: Asia Pacific Smart Agricultural Weather Station Volume Share (%), by Country 2025 & 2033
List of Tables
- Table 1: Global Smart Agricultural Weather Station Revenue billion Forecast, by Application 2020 & 2033
- Table 2: Global Smart Agricultural Weather Station Volume K Forecast, by Application 2020 & 2033
- Table 3: Global Smart Agricultural Weather Station Revenue billion Forecast, by Types 2020 & 2033
- Table 4: Global Smart Agricultural Weather Station Volume K Forecast, by Types 2020 & 2033
- Table 5: Global Smart Agricultural Weather Station Revenue billion Forecast, by Region 2020 & 2033
- Table 6: Global Smart Agricultural Weather Station Volume K Forecast, by Region 2020 & 2033
- Table 7: Global Smart Agricultural Weather Station Revenue billion Forecast, by Application 2020 & 2033
- Table 8: Global Smart Agricultural Weather Station Volume K Forecast, by Application 2020 & 2033
- Table 9: Global Smart Agricultural Weather Station Revenue billion Forecast, by Types 2020 & 2033
- Table 10: Global Smart Agricultural Weather Station Volume K Forecast, by Types 2020 & 2033
- Table 11: Global Smart Agricultural Weather Station Revenue billion Forecast, by Country 2020 & 2033
- Table 12: Global Smart Agricultural Weather Station Volume K Forecast, by Country 2020 & 2033
- Table 13: United States Smart Agricultural Weather Station Revenue (billion) Forecast, by Application 2020 & 2033
- Table 14: United States Smart Agricultural Weather Station Volume (K) Forecast, by Application 2020 & 2033
- Table 15: Canada Smart Agricultural Weather Station Revenue (billion) Forecast, by Application 2020 & 2033
- Table 16: Canada Smart Agricultural Weather Station Volume (K) Forecast, by Application 2020 & 2033
- Table 17: Mexico Smart Agricultural Weather Station Revenue (billion) Forecast, by Application 2020 & 2033
- Table 18: Mexico Smart Agricultural Weather Station Volume (K) Forecast, by Application 2020 & 2033
- Table 19: Global Smart Agricultural Weather Station Revenue billion Forecast, by Application 2020 & 2033
- Table 20: Global Smart Agricultural Weather Station Volume K Forecast, by Application 2020 & 2033
- Table 21: Global Smart Agricultural Weather Station Revenue billion Forecast, by Types 2020 & 2033
- Table 22: Global Smart Agricultural Weather Station Volume K Forecast, by Types 2020 & 2033
- Table 23: Global Smart Agricultural Weather Station Revenue billion Forecast, by Country 2020 & 2033
- Table 24: Global Smart Agricultural Weather Station Volume K Forecast, by Country 2020 & 2033
- Table 25: Brazil Smart Agricultural Weather Station Revenue (billion) Forecast, by Application 2020 & 2033
- Table 26: Brazil Smart Agricultural Weather Station Volume (K) Forecast, by Application 2020 & 2033
- Table 27: Argentina Smart Agricultural Weather Station Revenue (billion) Forecast, by Application 2020 & 2033
- Table 28: Argentina Smart Agricultural Weather Station Volume (K) Forecast, by Application 2020 & 2033
- Table 29: Rest of South America Smart Agricultural Weather Station Revenue (billion) Forecast, by Application 2020 & 2033
- Table 30: Rest of South America Smart Agricultural Weather Station Volume (K) Forecast, by Application 2020 & 2033
- Table 31: Global Smart Agricultural Weather Station Revenue billion Forecast, by Application 2020 & 2033
- Table 32: Global Smart Agricultural Weather Station Volume K Forecast, by Application 2020 & 2033
- Table 33: Global Smart Agricultural Weather Station Revenue billion Forecast, by Types 2020 & 2033
- Table 34: Global Smart Agricultural Weather Station Volume K Forecast, by Types 2020 & 2033
- Table 35: Global Smart Agricultural Weather Station Revenue billion Forecast, by Country 2020 & 2033
- Table 36: Global Smart Agricultural Weather Station Volume K Forecast, by Country 2020 & 2033
- Table 37: United Kingdom Smart Agricultural Weather Station Revenue (billion) Forecast, by Application 2020 & 2033
- Table 38: United Kingdom Smart Agricultural Weather Station Volume (K) Forecast, by Application 2020 & 2033
- Table 39: Germany Smart Agricultural Weather Station Revenue (billion) Forecast, by Application 2020 & 2033
- Table 40: Germany Smart Agricultural Weather Station Volume (K) Forecast, by Application 2020 & 2033
- Table 41: France Smart Agricultural Weather Station Revenue (billion) Forecast, by Application 2020 & 2033
- Table 42: France Smart Agricultural Weather Station Volume (K) Forecast, by Application 2020 & 2033
- Table 43: Italy Smart Agricultural Weather Station Revenue (billion) Forecast, by Application 2020 & 2033
- Table 44: Italy Smart Agricultural Weather Station Volume (K) Forecast, by Application 2020 & 2033
- Table 45: Spain Smart Agricultural Weather Station Revenue (billion) Forecast, by Application 2020 & 2033
- Table 46: Spain Smart Agricultural Weather Station Volume (K) Forecast, by Application 2020 & 2033
- Table 47: Russia Smart Agricultural Weather Station Revenue (billion) Forecast, by Application 2020 & 2033
- Table 48: Russia Smart Agricultural Weather Station Volume (K) Forecast, by Application 2020 & 2033
- Table 49: Benelux Smart Agricultural Weather Station Revenue (billion) Forecast, by Application 2020 & 2033
- Table 50: Benelux Smart Agricultural Weather Station Volume (K) Forecast, by Application 2020 & 2033
- Table 51: Nordics Smart Agricultural Weather Station Revenue (billion) Forecast, by Application 2020 & 2033
- Table 52: Nordics Smart Agricultural Weather Station Volume (K) Forecast, by Application 2020 & 2033
- Table 53: Rest of Europe Smart Agricultural Weather Station Revenue (billion) Forecast, by Application 2020 & 2033
- Table 54: Rest of Europe Smart Agricultural Weather Station Volume (K) Forecast, by Application 2020 & 2033
- Table 55: Global Smart Agricultural Weather Station Revenue billion Forecast, by Application 2020 & 2033
- Table 56: Global Smart Agricultural Weather Station Volume K Forecast, by Application 2020 & 2033
- Table 57: Global Smart Agricultural Weather Station Revenue billion Forecast, by Types 2020 & 2033
- Table 58: Global Smart Agricultural Weather Station Volume K Forecast, by Types 2020 & 2033
- Table 59: Global Smart Agricultural Weather Station Revenue billion Forecast, by Country 2020 & 2033
- Table 60: Global Smart Agricultural Weather Station Volume K Forecast, by Country 2020 & 2033
- Table 61: Turkey Smart Agricultural Weather Station Revenue (billion) Forecast, by Application 2020 & 2033
- Table 62: Turkey Smart Agricultural Weather Station Volume (K) Forecast, by Application 2020 & 2033
- Table 63: Israel Smart Agricultural Weather Station Revenue (billion) Forecast, by Application 2020 & 2033
- Table 64: Israel Smart Agricultural Weather Station Volume (K) Forecast, by Application 2020 & 2033
- Table 65: GCC Smart Agricultural Weather Station Revenue (billion) Forecast, by Application 2020 & 2033
- Table 66: GCC Smart Agricultural Weather Station Volume (K) Forecast, by Application 2020 & 2033
- Table 67: North Africa Smart Agricultural Weather Station Revenue (billion) Forecast, by Application 2020 & 2033
- Table 68: North Africa Smart Agricultural Weather Station Volume (K) Forecast, by Application 2020 & 2033
- Table 69: South Africa Smart Agricultural Weather Station Revenue (billion) Forecast, by Application 2020 & 2033
- Table 70: South Africa Smart Agricultural Weather Station Volume (K) Forecast, by Application 2020 & 2033
- Table 71: Rest of Middle East & Africa Smart Agricultural Weather Station Revenue (billion) Forecast, by Application 2020 & 2033
- Table 72: Rest of Middle East & Africa Smart Agricultural Weather Station Volume (K) Forecast, by Application 2020 & 2033
- Table 73: Global Smart Agricultural Weather Station Revenue billion Forecast, by Application 2020 & 2033
- Table 74: Global Smart Agricultural Weather Station Volume K Forecast, by Application 2020 & 2033
- Table 75: Global Smart Agricultural Weather Station Revenue billion Forecast, by Types 2020 & 2033
- Table 76: Global Smart Agricultural Weather Station Volume K Forecast, by Types 2020 & 2033
- Table 77: Global Smart Agricultural Weather Station Revenue billion Forecast, by Country 2020 & 2033
- Table 78: Global Smart Agricultural Weather Station Volume K Forecast, by Country 2020 & 2033
- Table 79: China Smart Agricultural Weather Station Revenue (billion) Forecast, by Application 2020 & 2033
- Table 80: China Smart Agricultural Weather Station Volume (K) Forecast, by Application 2020 & 2033
- Table 81: India Smart Agricultural Weather Station Revenue (billion) Forecast, by Application 2020 & 2033
- Table 82: India Smart Agricultural Weather Station Volume (K) Forecast, by Application 2020 & 2033
- Table 83: Japan Smart Agricultural Weather Station Revenue (billion) Forecast, by Application 2020 & 2033
- Table 84: Japan Smart Agricultural Weather Station Volume (K) Forecast, by Application 2020 & 2033
- Table 85: South Korea Smart Agricultural Weather Station Revenue (billion) Forecast, by Application 2020 & 2033
- Table 86: South Korea Smart Agricultural Weather Station Volume (K) Forecast, by Application 2020 & 2033
- Table 87: ASEAN Smart Agricultural Weather Station Revenue (billion) Forecast, by Application 2020 & 2033
- Table 88: ASEAN Smart Agricultural Weather Station Volume (K) Forecast, by Application 2020 & 2033
- Table 89: Oceania Smart Agricultural Weather Station Revenue (billion) Forecast, by Application 2020 & 2033
- Table 90: Oceania Smart Agricultural Weather Station Volume (K) Forecast, by Application 2020 & 2033
- Table 91: Rest of Asia Pacific Smart Agricultural Weather Station Revenue (billion) Forecast, by Application 2020 & 2033
- Table 92: Rest of Asia Pacific Smart Agricultural Weather Station Volume (K) Forecast, by Application 2020 & 2033
Frequently Asked Questions
1. What is the projected Compound Annual Growth Rate (CAGR) of the Smart Agricultural Weather Station?
The projected CAGR is approximately 8%.
2. Which companies are prominent players in the Smart Agricultural Weather Station?
Key companies in the market include Campbell Scientific, Inc., Optical Scientific, Inc., Davis Instruments Corp., Netatmo, RainWise, Inc., Agricolus, Cordulus, Agrii, Sencrop, Kestrel Instruments, Environdata, Rika Sensors, NiuBoL, Darrera, Ambient, AcuRite, Shandong Fengtu Internet of Things Technology Co., Ltd., Wuhan Fuyuan Feike Electronic Technology Co., Ltd., Zhejiang Top Cloud-Agri Technology Co., Ltd..
3. What are the main segments of the Smart Agricultural Weather Station?
The market segments include Application, Types.
4. Can you provide details about the market size?
The market size is estimated to be USD 2.5 billion as of 2022.
5. What are some drivers contributing to market growth?
N/A
6. What are the notable trends driving market growth?
N/A
7. Are there any restraints impacting market growth?
N/A
8. Can you provide examples of recent developments in the market?
N/A
9. What pricing options are available for accessing the report?
Pricing options include single-user, multi-user, and enterprise licenses priced at USD 4350.00, USD 6525.00, and USD 8700.00 respectively.
10. Is the market size provided in terms of value or volume?
The market size is provided in terms of value, measured in billion and volume, measured in K.
11. Are there any specific market keywords associated with the report?
Yes, the market keyword associated with the report is "Smart Agricultural Weather Station," which aids in identifying and referencing the specific market segment covered.
12. How do I determine which pricing option suits my needs best?
The pricing options vary based on user requirements and access needs. Individual users may opt for single-user licenses, while businesses requiring broader access may choose multi-user or enterprise licenses for cost-effective access to the report.
13. Are there any additional resources or data provided in the Smart Agricultural Weather Station report?
While the report offers comprehensive insights, it's advisable to review the specific contents or supplementary materials provided to ascertain if additional resources or data are available.
14. How can I stay updated on further developments or reports in the Smart Agricultural Weather Station?
To stay informed about further developments, trends, and reports in the Smart Agricultural Weather Station, consider subscribing to industry newsletters, following relevant companies and organizations, or regularly checking reputable industry news sources and publications.
Methodology
Step 1 - Identification of Relevant Samples Size from Population Database


Step 2 - Approaches for Defining Global Market Size (Value, Volume* & Price*)

Note*: In applicable scenarios
Step 3 - Data Sources
Primary Research
- Web Analytics
- Survey Reports
- Research Institute
- Latest Research Reports
- Opinion Leaders
Secondary Research
- Annual Reports
- White Paper
- Latest Press Release
- Industry Association
- Paid Database
- Investor Presentations

Step 4 - Data Triangulation
Involves using different sources of information in order to increase the validity of a study
These sources are likely to be stakeholders in a program - participants, other researchers, program staff, other community members, and so on.
Then we put all data in single framework & apply various statistical tools to find out the dynamic on the market.
During the analysis stage, feedback from the stakeholder groups would be compared to determine areas of agreement as well as areas of divergence