

Key Insights
The global tissue engineering market is projected for substantial expansion, anticipated to reach $22.75 billion by 2025, exhibiting a robust Compound Annual Growth Rate (CAGR) of 14.6%. This growth is driven by advancements in regenerative medicine, increasing prevalence of chronic diseases, and demand for orthopedic and cardiovascular treatments. The market is segmented by material type, including synthetic and biologically derived materials, with synthetic materials expected to lead due to their versatility and cost-effectiveness. Key applications span orthopedics, musculoskeletal & spine, neurology, cardiology & vascular, and skin & integumentary. The rising incidence of osteoarthritis, degenerative disc disease, and cardiovascular ailments fuels demand for superior tissue-engineered solutions. Increased R&D investment and supportive government initiatives are accelerating market adoption.
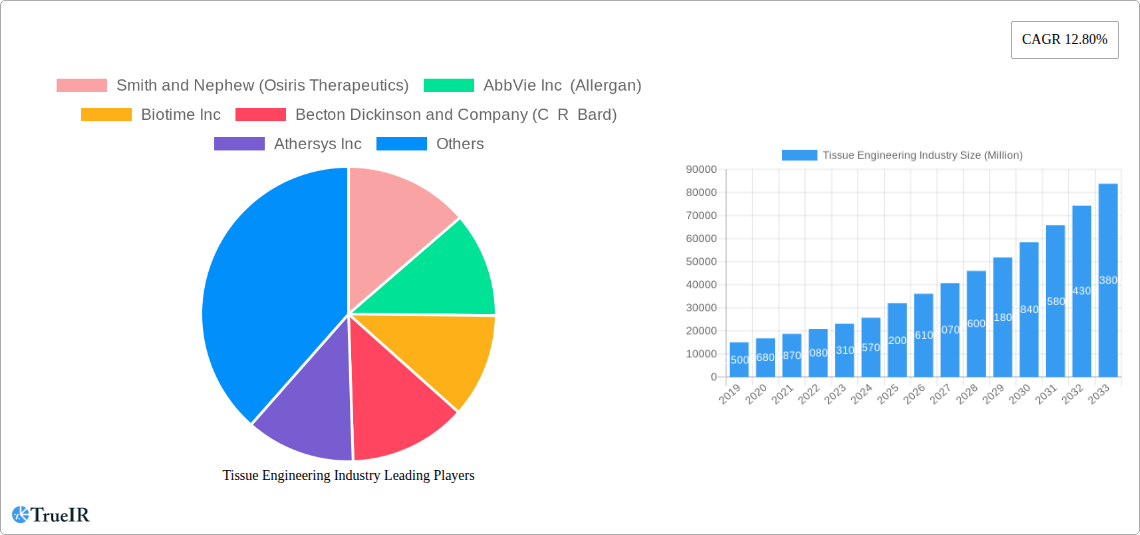
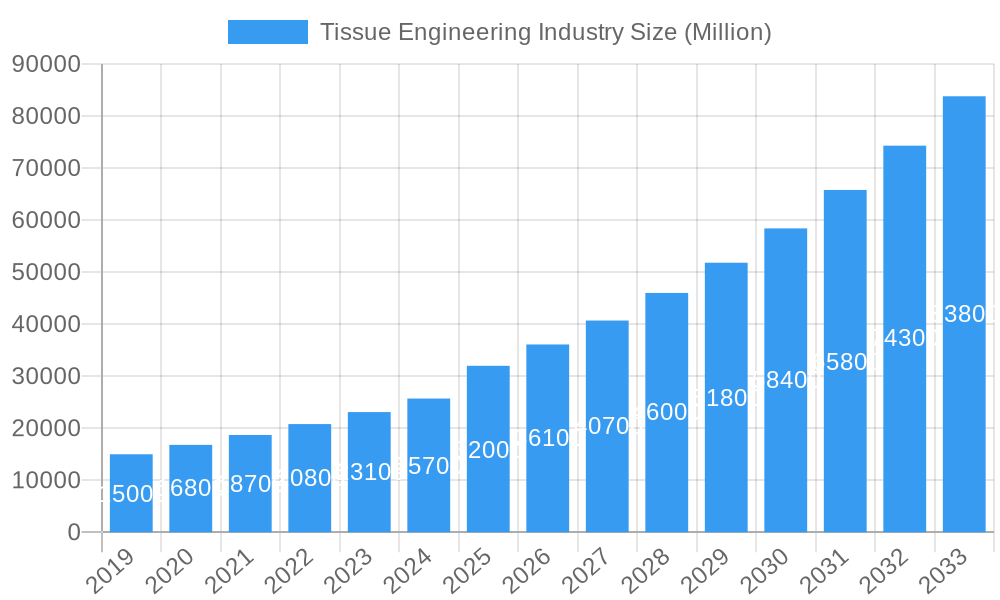
Tissue Engineering Industry Market Size (In Billion)
The competitive landscape features key players like Smith and Nephew, AbbVie Inc, and Zimmer Biomet, engaged in product innovation and strategic collaborations. North America is expected to dominate market share due to advanced healthcare infrastructure and high R&D investment. The Asia Pacific region is poised for the fastest growth, driven by a large patient population, rising healthcare expenditure, and expanding medical tourism in China and India. Challenges include high product costs and stringent regulatory processes. However, innovations in bioprinting, stem cell therapy, and scaffold development, coupled with growing awareness of tissue engineering benefits, will drive future market growth and therapeutic advancements.
Tissue Engineering Industry Company Market Share
Gain comprehensive insights into the Tissue Engineering Industry market dynamics, key players, and emerging opportunities. This analysis focuses on the base year 2025, with projections extending to 2033.
Tissue Engineering Industry Market Structure & Competitive Landscape
The tissue engineering industry exhibits a moderately concentrated market structure, characterized by a blend of established global players and emerging innovators. Key companies like Smith and Nephew (Osiris Therapeutics), AbbVie Inc (Allergan), Biotime Inc, Becton Dickinson and Company (C R Bard), Athersys Inc, Bio Tissue Technologies, Organogenesis, B Braun Melsungen AG, Tissue Regenix Group plc, Zimmer Biomet, Acell Inc, and Integra Lifesciences are driving innovation and market expansion. The competitive landscape is shaped by robust R&D investments, strategic partnerships, and increasing adoption of advanced biomaterials. Innovation drivers include the demand for novel treatments for chronic diseases, advancements in stem cell technology, and sophisticated scaffold designs. Regulatory frameworks, though evolving, play a crucial role in product development and market entry, creating both opportunities and barriers. Product substitutes, such as traditional implants and therapies, are gradually being displaced by the superior efficacy and regenerative potential of engineered tissues. End-user segmentation is diverse, spanning orthopedics, cardiology, neurology, and skin regeneration. Mergers and acquisitions (M&A) are a significant trend, with an estimated volume of over 500 Million in M&A activities annually over the historical period, as companies seek to consolidate market share, acquire new technologies, and expand their product portfolios. Concentration ratios are estimated to be in the range of 0.5 to 0.7 for the top five players, indicating a competitive yet consolidated market.
Tissue Engineering Industry Market Trends & Opportunities
The tissue engineering market is poised for significant expansion, projected to reach a valuation exceeding 20 Billion by the end of the forecast period. This growth trajectory is fueled by an increasing global burden of chronic diseases, an aging population, and a growing preference for regenerative therapies over traditional surgical interventions. Technological advancements are at the forefront, with breakthroughs in 3D bioprinting, scaffold fabrication using novel synthetic and biologically derived materials, and sophisticated cell culturing techniques enabling the creation of increasingly complex and functional tissues. Consumer preferences are shifting towards minimally invasive procedures and faster recovery times, which tissue-engineered products are well-positioned to deliver. The market penetration rate for advanced tissue-engineered solutions is currently estimated at 25%, with substantial room for growth across various therapeutic areas. The compound annual growth rate (CAGR) is projected to be a robust 12.5% over the forecast period (2025-2033). Emerging opportunities lie in the development of personalized medicine approaches, where patient-specific cells and scaffolds can be utilized for tailored treatments. Furthermore, the integration of artificial intelligence and machine learning in designing and optimizing tissue constructs promises to accelerate product development and improve therapeutic outcomes. The expansion into underdeveloped regions and the increasing focus on rare disease treatments also represent lucrative avenues for market players. The rising awareness among healthcare professionals and patients about the benefits of tissue engineering will further bolster market adoption and drive sustained growth.
Dominant Markets & Segments in Tissue Engineering Industry
The Orthopedics and Musculoskeletal & Spine applications dominate the tissue engineering market, accounting for an estimated 45% of the global share. This dominance is driven by the high prevalence of orthopedic injuries, degenerative joint diseases, and spinal conditions. The demand for bone grafts, cartilage repair, and ligament reconstruction is substantial, with the market size in this segment alone projected to exceed 9 Billion by 2033. The Synthetic Materials segment is a significant contributor, with an estimated 40% market share, due to their versatility, controlled degradation rates, and ability to be precisely engineered into complex structures. Biologically Derived Materials, including decellularized matrices and growth factors, represent another crucial segment, holding an estimated 35% market share, owing to their inherent biocompatibility and signaling properties.
Key Growth Drivers in Dominant Segments:
Orthopedics & Musculoskeletal & Spine:
- Increasing incidence of sports injuries and age-related musculoskeletal disorders.
- Advancements in biomaterials and scaffold technologies for enhanced bone and cartilage regeneration.
- Growing acceptance of regenerative therapies for faster patient recovery and improved functional outcomes.
- Favorable reimbursement policies for advanced orthopedic treatments in developed economies.
- Significant R&D investments by key players in developing novel solutions for spinal fusion and joint repair.
Synthetic Materials:
- Superior control over material properties (e.g., porosity, mechanical strength, degradation rate).
- Cost-effectiveness and scalability of manufacturing processes.
- Development of biodegradable synthetic polymers that mimic natural tissue structures.
- Increasing use in combination with cells and growth factors to create sophisticated tissue constructs.
Biologically Derived Materials:
- Inherent biocompatibility and ability to promote cell adhesion, proliferation, and differentiation.
- Presence of native extracellular matrix components that provide crucial biological cues.
- Advancements in decellularization techniques for creating acellular scaffolds.
- Growing research into the use of extracellular vesicles and growth factors for enhanced regeneration.
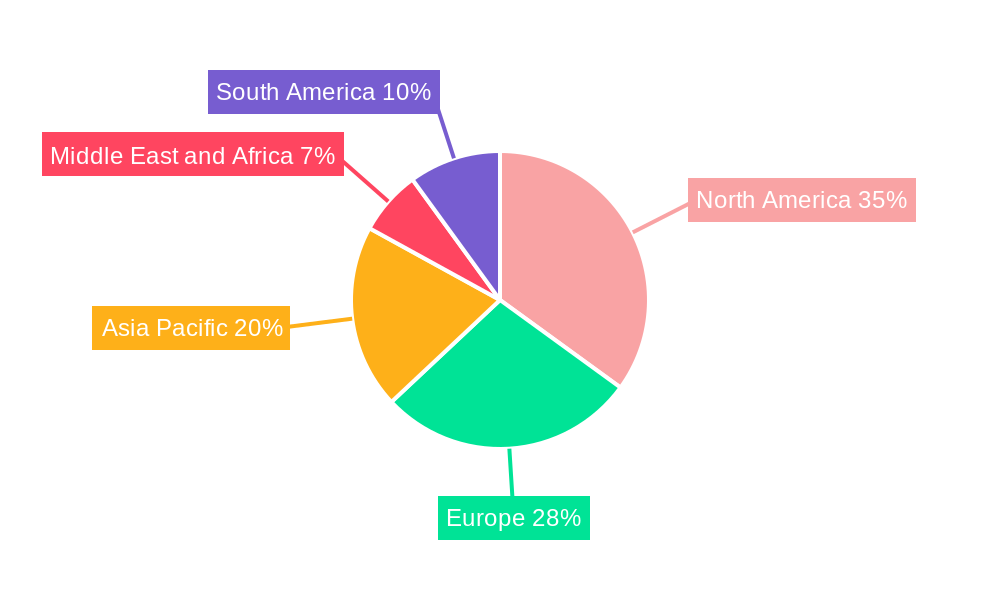
North America currently leads the global tissue engineering market, with an estimated market share of 38%, driven by substantial healthcare expenditure, a high incidence of chronic diseases, and a well-established research infrastructure. The United States, in particular, remains a focal point for innovation and adoption of new technologies.
Tissue Engineering Industry Product Analysis
The tissue engineering industry is witnessing a surge in innovative products designed to address unmet medical needs. Companies are focusing on developing advanced scaffolds that mimic the native extracellular matrix, utilizing a combination of synthetic polymers and naturally derived materials to optimize cell integration and tissue regeneration. Product innovations are particularly prominent in areas like cardiovascular patches for cardiac repair, skin grafts for burn victims and chronic wounds, and nerve conduits for neurological damage. Competitive advantages are derived from superior biocompatibility, biodegradability, mechanical strength, and the ability to deliver targeted growth factors or cells. The integration of nanotechnology and 3D bioprinting is enabling the creation of highly personalized and complex tissue constructs, pushing the boundaries of regenerative medicine and offering improved patient outcomes.
Key Drivers, Barriers & Challenges in Tissue Engineering Industry
Key Drivers:
- Technological Advancements: Breakthroughs in stem cell research, biomaterials science, and 3D bioprinting are enabling the development of more effective and sophisticated tissue-engineered products.
- Increasing Disease Prevalence: A rising global burden of chronic diseases like diabetes, cardiovascular diseases, and orthopedic conditions creates a substantial demand for regenerative solutions.
- Aging Population: The demographic shift towards an older population leads to a higher incidence of age-related degenerative diseases requiring advanced therapeutic interventions.
- Government Funding & Support: Increased governmental initiatives and funding for regenerative medicine research are accelerating innovation and product development.
Barriers & Challenges:
- Regulatory Hurdles: The complex and stringent regulatory pathways for novel tissue-engineered products can lead to extended approval timelines and significant development costs, estimated to add 10-20% to development expenses.
- High Development Costs: The research, development, and clinical testing of tissue-engineered products are capital-intensive, requiring substantial investment, often exceeding 50 Million per product.
- Supply Chain Complexity: Ensuring the consistent availability of high-quality cells, biomaterials, and growth factors presents significant supply chain challenges.
- Reimbursement Policies: Inconsistent and sometimes insufficient reimbursement policies for novel tissue engineering treatments can hinder widespread adoption by healthcare providers and patients.
- Manufacturing Scalability: Scaling up the production of complex, patient-specific tissue-engineered products while maintaining quality and cost-effectiveness remains a significant challenge.
Growth Drivers in the Tissue Engineering Industry Market
Key growth drivers for the tissue engineering industry are multifaceted, encompassing rapid advancements in biomaterials science, particularly in developing biodegradable and biocompatible scaffolds that mimic native tissue architecture. Technological leaps in 3D bioprinting and microfluidics are enabling the precise fabrication of complex tissue structures, accelerating therapeutic development. The increasing global prevalence of chronic diseases, such as diabetes, cardiovascular ailments, and degenerative joint disorders, is creating a substantial unmet medical need, driving demand for regenerative solutions. Furthermore, an aging global population is contributing to a rise in age-related conditions, further fueling the market. Supportive government policies and increasing R&D investments by both public and private sectors are also critical catalysts, fostering innovation and accelerating the translation of research into clinical applications.
Challenges Impacting Tissue Engineering Industry Growth
Several significant challenges are impacting the growth of the tissue engineering industry. Regulatory complexities and the lengthy approval processes for novel regenerative therapies remain a major hurdle, often requiring extensive preclinical and clinical data, which can add years and millions of dollars to development timelines. The high cost of research and development, coupled with the manufacturing scalability issues for complex engineered tissues, can limit accessibility and affordability. Supply chain intricacies, including the sourcing and quality control of specialized cells, growth factors, and biomaterials, present ongoing operational challenges. Additionally, establishing comprehensive reimbursement pathways and gaining widespread acceptance from healthcare payers and providers for these innovative treatments is crucial for market penetration. Competitive pressures from existing traditional therapies and the need for robust clinical evidence to demonstrate superiority also pose significant restraints.
Key Players Shaping the Tissue Engineering Industry Market
- Smith and Nephew
- Osiris Therapeutics
- AbbVie Inc
- Allergan
- Biotime Inc
- Becton Dickinson and Company
- C R Bard
- Athersys Inc
- Bio Tissue Technologies
- Organogenesis
- B Braun Melsungen AG
- Tissue Regenix Group plc
- Zimmer Biomet
- Acell Inc
- Integra Lifesciences
Significant Tissue Engineering Industry Industry Milestones
- May 2022: Rousselot, Darling Ingredients' health brand, launched Quali-Pure HGP 2000, a new endotoxin-controlled, pharmaceutical-grade gelatin specifically designed for vaccines and wound healing applications. This development enhances the safety and efficacy of wound care and vaccine delivery systems.
- February 2022: Orthofix Medical launched Opus BA, a synthetic bioactive bone graft solution for cervical and lumbar spine fusion procedures. This innovation provides surgeons with a reliable and effective alternative to autograft and allograft bone, improving surgical outcomes and patient recovery.
Future Outlook for Tissue Engineering Industry Market
The future outlook for the tissue engineering industry is exceptionally promising, driven by continuous technological innovation and increasing clinical validation. Strategic opportunities lie in expanding the application of 3D bioprinting for organoid development and complex tissue constructs, which could revolutionize drug discovery and personalized medicine. The growing focus on regenerative therapies for neurological disorders, cardiac repair, and autoimmune diseases presents vast untapped potential. Partnerships between academic research institutions and industry leaders will continue to accelerate the translation of groundbreaking discoveries into commercially viable products. Furthermore, the increasing global demand for advanced wound care solutions and the development of off-the-shelf tissue-engineered products are expected to drive significant market expansion and improve patient access to life-changing treatments, with market growth projected to continue at a strong CAGR of 12.5%.
Tissue Engineering Industry Segmentation
-
1. Material
- 1.1. Synthetic Materials
- 1.2. Biologically Derived Materials
- 1.3. Others
-
2. Application
- 2.1. Orthopedics
- 2.2. Musculoskeletal & Spine
- 2.3. Neurology
- 2.4. Cardiology & Vascular
- 2.5. Skin & Integumentary
- 2.6. Others
Tissue Engineering Industry Segmentation By Geography
-
1. North America
- 1.1. United States
- 1.2. Canada
- 1.3. Mexico
-
2. Europe
- 2.1. Germany
- 2.2. United Kingdom
- 2.3. France
- 2.4. Italy
- 2.5. Spain
- 2.6. Rest of Europe
-
3. Asia Pacific
- 3.1. China
- 3.2. Japan
- 3.3. India
- 3.4. Australia
- 3.5. South Korea
- 3.6. Rest of Asia Pacific
-
4. Middle East and Africa
- 4.1. GCC
- 4.2. South Africa
- 4.3. Rest of Middle East and Africa
-
5. South America
- 5.1. Brazil
- 5.2. Argentina
- 5.3. Rest of South America
Tissue Engineering Industry Regional Market Share
Geographic Coverage of Tissue Engineering Industry
Tissue Engineering Industry REPORT HIGHLIGHTS
| Aspects | Details |
|---|---|
| Study Period | 2020-2034 |
| Base Year | 2025 |
| Estimated Year | 2026 |
| Forecast Period | 2026-2034 |
| Historical Period | 2020-2025 |
| Growth Rate | CAGR of 14.6% from 2020-2034 |
| Segmentation |
|
Table of Contents
- 1. Introduction
- 1.1. Research Scope
- 1.2. Market Segmentation
- 1.3. Research Objective
- 1.4. Definitions and Assumptions
- 2. Executive Summary
- 2.1. Market Snapshot
- 3. Market Dynamics
- 3.1. Market Drivers
- 3.2. Market Restrains
- 3.3. Market Trends
- 3.4. Market Opportunities
- 4. Market Factor Analysis
- 4.1. Porters Five Forces
- 4.1.1. Bargaining Power of Suppliers
- 4.1.2. Bargaining Power of Buyers
- 4.1.3. Threat of New Entrants
- 4.1.4. Threat of Substitutes
- 4.1.5. Competitive Rivalry
- 4.2. PESTEL analysis
- 4.3. BCG Analysis
- 4.3.1. Stars (High Growth, High Market Share)
- 4.3.2. Cash Cows (Low Growth, High Market Share)
- 4.3.3. Question Mark (High Growth, Low Market Share)
- 4.3.4. Dogs (Low Growth, Low Market Share)
- 4.4. Ansoff Matrix Analysis
- 4.5. Supply Chain Analysis
- 4.6. Regulatory Landscape
- 4.7. Current Market Potential and Opportunity Assessment (TAM–SAM–SOM Framework)
- 4.8. TIR Analyst Note
- 4.1. Porters Five Forces
- 5. Market Analysis, Insights and Forecast 2021-2033
- 5.1. Market Analysis, Insights and Forecast - by Material
- 5.1.1. Synthetic Materials
- 5.1.2. Biologically Derived Materials
- 5.1.3. Others
- 5.2. Market Analysis, Insights and Forecast - by Application
- 5.2.1. Orthopedics
- 5.2.2. Musculoskeletal & Spine
- 5.2.3. Neurology
- 5.2.4. Cardiology & Vascular
- 5.2.5. Skin & Integumentary
- 5.2.6. Others
- 5.3. Market Analysis, Insights and Forecast - by Region
- 5.3.1. North America
- 5.3.2. Europe
- 5.3.3. Asia Pacific
- 5.3.4. Middle East and Africa
- 5.3.5. South America
- 5.1. Market Analysis, Insights and Forecast - by Material
- 6. Global Tissue Engineering Industry Analysis, Insights and Forecast, 2021-2033
- 6.1. Market Analysis, Insights and Forecast - by Material
- 6.1.1. Synthetic Materials
- 6.1.2. Biologically Derived Materials
- 6.1.3. Others
- 6.2. Market Analysis, Insights and Forecast - by Application
- 6.2.1. Orthopedics
- 6.2.2. Musculoskeletal & Spine
- 6.2.3. Neurology
- 6.2.4. Cardiology & Vascular
- 6.2.5. Skin & Integumentary
- 6.2.6. Others
- 6.1. Market Analysis, Insights and Forecast - by Material
- 7. North America Tissue Engineering Industry Analysis, Insights and Forecast, 2020-2032
- 7.1. Market Analysis, Insights and Forecast - by Material
- 7.1.1. Synthetic Materials
- 7.1.2. Biologically Derived Materials
- 7.1.3. Others
- 7.2. Market Analysis, Insights and Forecast - by Application
- 7.2.1. Orthopedics
- 7.2.2. Musculoskeletal & Spine
- 7.2.3. Neurology
- 7.2.4. Cardiology & Vascular
- 7.2.5. Skin & Integumentary
- 7.2.6. Others
- 7.1. Market Analysis, Insights and Forecast - by Material
- 8. Europe Tissue Engineering Industry Analysis, Insights and Forecast, 2020-2032
- 8.1. Market Analysis, Insights and Forecast - by Material
- 8.1.1. Synthetic Materials
- 8.1.2. Biologically Derived Materials
- 8.1.3. Others
- 8.2. Market Analysis, Insights and Forecast - by Application
- 8.2.1. Orthopedics
- 8.2.2. Musculoskeletal & Spine
- 8.2.3. Neurology
- 8.2.4. Cardiology & Vascular
- 8.2.5. Skin & Integumentary
- 8.2.6. Others
- 8.1. Market Analysis, Insights and Forecast - by Material
- 9. Asia Pacific Tissue Engineering Industry Analysis, Insights and Forecast, 2020-2032
- 9.1. Market Analysis, Insights and Forecast - by Material
- 9.1.1. Synthetic Materials
- 9.1.2. Biologically Derived Materials
- 9.1.3. Others
- 9.2. Market Analysis, Insights and Forecast - by Application
- 9.2.1. Orthopedics
- 9.2.2. Musculoskeletal & Spine
- 9.2.3. Neurology
- 9.2.4. Cardiology & Vascular
- 9.2.5. Skin & Integumentary
- 9.2.6. Others
- 9.1. Market Analysis, Insights and Forecast - by Material
- 10. Middle East and Africa Tissue Engineering Industry Analysis, Insights and Forecast, 2020-2032
- 10.1. Market Analysis, Insights and Forecast - by Material
- 10.1.1. Synthetic Materials
- 10.1.2. Biologically Derived Materials
- 10.1.3. Others
- 10.2. Market Analysis, Insights and Forecast - by Application
- 10.2.1. Orthopedics
- 10.2.2. Musculoskeletal & Spine
- 10.2.3. Neurology
- 10.2.4. Cardiology & Vascular
- 10.2.5. Skin & Integumentary
- 10.2.6. Others
- 10.1. Market Analysis, Insights and Forecast - by Material
- 11. South America Tissue Engineering Industry Analysis, Insights and Forecast, 2020-2032
- 11.1. Market Analysis, Insights and Forecast - by Material
- 11.1.1. Synthetic Materials
- 11.1.2. Biologically Derived Materials
- 11.1.3. Others
- 11.2. Market Analysis, Insights and Forecast - by Application
- 11.2.1. Orthopedics
- 11.2.2. Musculoskeletal & Spine
- 11.2.3. Neurology
- 11.2.4. Cardiology & Vascular
- 11.2.5. Skin & Integumentary
- 11.2.6. Others
- 11.1. Market Analysis, Insights and Forecast - by Material
- 12. Competitive Analysis
- 12.1. Company Profiles
- 12.1.1 Smith and Nephew (Osiris Therapeutics)
- 12.1.1.1. Company Overview
- 12.1.1.2. Products
- 12.1.1.3. Company Financials
- 12.1.1.4. SWOT Analysis
- 12.1.2 AbbVie Inc (Allergan)
- 12.1.2.1. Company Overview
- 12.1.2.2. Products
- 12.1.2.3. Company Financials
- 12.1.2.4. SWOT Analysis
- 12.1.3 Biotime Inc
- 12.1.3.1. Company Overview
- 12.1.3.2. Products
- 12.1.3.3. Company Financials
- 12.1.3.4. SWOT Analysis
- 12.1.4 Becton Dickinson and Company (C R Bard)
- 12.1.4.1. Company Overview
- 12.1.4.2. Products
- 12.1.4.3. Company Financials
- 12.1.4.4. SWOT Analysis
- 12.1.5 Athersys Inc
- 12.1.5.1. Company Overview
- 12.1.5.2. Products
- 12.1.5.3. Company Financials
- 12.1.5.4. SWOT Analysis
- 12.1.6 Bio Tissue Technologies
- 12.1.6.1. Company Overview
- 12.1.6.2. Products
- 12.1.6.3. Company Financials
- 12.1.6.4. SWOT Analysis
- 12.1.7 Organogenesis
- 12.1.7.1. Company Overview
- 12.1.7.2. Products
- 12.1.7.3. Company Financials
- 12.1.7.4. SWOT Analysis
- 12.1.8 B Braun Melsungen AG
- 12.1.8.1. Company Overview
- 12.1.8.2. Products
- 12.1.8.3. Company Financials
- 12.1.8.4. SWOT Analysis
- 12.1.9 Tissue Regenix Group plc*List Not Exhaustive
- 12.1.9.1. Company Overview
- 12.1.9.2. Products
- 12.1.9.3. Company Financials
- 12.1.9.4. SWOT Analysis
- 12.1.10 Zimmer Biomet
- 12.1.10.1. Company Overview
- 12.1.10.2. Products
- 12.1.10.3. Company Financials
- 12.1.10.4. SWOT Analysis
- 12.1.11 Acell Inc
- 12.1.11.1. Company Overview
- 12.1.11.2. Products
- 12.1.11.3. Company Financials
- 12.1.11.4. SWOT Analysis
- 12.1.12 Integra Lifesciences
- 12.1.12.1. Company Overview
- 12.1.12.2. Products
- 12.1.12.3. Company Financials
- 12.1.12.4. SWOT Analysis
- 12.1.1 Smith and Nephew (Osiris Therapeutics)
- 12.2. Market Entropy
- 12.2.1 Company's Key Areas Served
- 12.2.2 Recent Developments
- 12.3. Company Market Share Analysis 2025
- 12.3.1 Top 5 Companies Market Share Analysis
- 12.3.2 Top 3 Companies Market Share Analysis
- 12.4. List of Potential Customers
- 13. Research Methodology
List of Figures
- Figure 1: Global Tissue Engineering Industry Revenue Breakdown (billion, %) by Region 2025 & 2033
- Figure 2: Global Tissue Engineering Industry Volume Breakdown (K Unit, %) by Region 2025 & 2033
- Figure 3: North America Tissue Engineering Industry Revenue (billion), by Material 2025 & 2033
- Figure 4: North America Tissue Engineering Industry Volume (K Unit), by Material 2025 & 2033
- Figure 5: North America Tissue Engineering Industry Revenue Share (%), by Material 2025 & 2033
- Figure 6: North America Tissue Engineering Industry Volume Share (%), by Material 2025 & 2033
- Figure 7: North America Tissue Engineering Industry Revenue (billion), by Application 2025 & 2033
- Figure 8: North America Tissue Engineering Industry Volume (K Unit), by Application 2025 & 2033
- Figure 9: North America Tissue Engineering Industry Revenue Share (%), by Application 2025 & 2033
- Figure 10: North America Tissue Engineering Industry Volume Share (%), by Application 2025 & 2033
- Figure 11: North America Tissue Engineering Industry Revenue (billion), by Country 2025 & 2033
- Figure 12: North America Tissue Engineering Industry Volume (K Unit), by Country 2025 & 2033
- Figure 13: North America Tissue Engineering Industry Revenue Share (%), by Country 2025 & 2033
- Figure 14: North America Tissue Engineering Industry Volume Share (%), by Country 2025 & 2033
- Figure 15: Europe Tissue Engineering Industry Revenue (billion), by Material 2025 & 2033
- Figure 16: Europe Tissue Engineering Industry Volume (K Unit), by Material 2025 & 2033
- Figure 17: Europe Tissue Engineering Industry Revenue Share (%), by Material 2025 & 2033
- Figure 18: Europe Tissue Engineering Industry Volume Share (%), by Material 2025 & 2033
- Figure 19: Europe Tissue Engineering Industry Revenue (billion), by Application 2025 & 2033
- Figure 20: Europe Tissue Engineering Industry Volume (K Unit), by Application 2025 & 2033
- Figure 21: Europe Tissue Engineering Industry Revenue Share (%), by Application 2025 & 2033
- Figure 22: Europe Tissue Engineering Industry Volume Share (%), by Application 2025 & 2033
- Figure 23: Europe Tissue Engineering Industry Revenue (billion), by Country 2025 & 2033
- Figure 24: Europe Tissue Engineering Industry Volume (K Unit), by Country 2025 & 2033
- Figure 25: Europe Tissue Engineering Industry Revenue Share (%), by Country 2025 & 2033
- Figure 26: Europe Tissue Engineering Industry Volume Share (%), by Country 2025 & 2033
- Figure 27: Asia Pacific Tissue Engineering Industry Revenue (billion), by Material 2025 & 2033
- Figure 28: Asia Pacific Tissue Engineering Industry Volume (K Unit), by Material 2025 & 2033
- Figure 29: Asia Pacific Tissue Engineering Industry Revenue Share (%), by Material 2025 & 2033
- Figure 30: Asia Pacific Tissue Engineering Industry Volume Share (%), by Material 2025 & 2033
- Figure 31: Asia Pacific Tissue Engineering Industry Revenue (billion), by Application 2025 & 2033
- Figure 32: Asia Pacific Tissue Engineering Industry Volume (K Unit), by Application 2025 & 2033
- Figure 33: Asia Pacific Tissue Engineering Industry Revenue Share (%), by Application 2025 & 2033
- Figure 34: Asia Pacific Tissue Engineering Industry Volume Share (%), by Application 2025 & 2033
- Figure 35: Asia Pacific Tissue Engineering Industry Revenue (billion), by Country 2025 & 2033
- Figure 36: Asia Pacific Tissue Engineering Industry Volume (K Unit), by Country 2025 & 2033
- Figure 37: Asia Pacific Tissue Engineering Industry Revenue Share (%), by Country 2025 & 2033
- Figure 38: Asia Pacific Tissue Engineering Industry Volume Share (%), by Country 2025 & 2033
- Figure 39: Middle East and Africa Tissue Engineering Industry Revenue (billion), by Material 2025 & 2033
- Figure 40: Middle East and Africa Tissue Engineering Industry Volume (K Unit), by Material 2025 & 2033
- Figure 41: Middle East and Africa Tissue Engineering Industry Revenue Share (%), by Material 2025 & 2033
- Figure 42: Middle East and Africa Tissue Engineering Industry Volume Share (%), by Material 2025 & 2033
- Figure 43: Middle East and Africa Tissue Engineering Industry Revenue (billion), by Application 2025 & 2033
- Figure 44: Middle East and Africa Tissue Engineering Industry Volume (K Unit), by Application 2025 & 2033
- Figure 45: Middle East and Africa Tissue Engineering Industry Revenue Share (%), by Application 2025 & 2033
- Figure 46: Middle East and Africa Tissue Engineering Industry Volume Share (%), by Application 2025 & 2033
- Figure 47: Middle East and Africa Tissue Engineering Industry Revenue (billion), by Country 2025 & 2033
- Figure 48: Middle East and Africa Tissue Engineering Industry Volume (K Unit), by Country 2025 & 2033
- Figure 49: Middle East and Africa Tissue Engineering Industry Revenue Share (%), by Country 2025 & 2033
- Figure 50: Middle East and Africa Tissue Engineering Industry Volume Share (%), by Country 2025 & 2033
- Figure 51: South America Tissue Engineering Industry Revenue (billion), by Material 2025 & 2033
- Figure 52: South America Tissue Engineering Industry Volume (K Unit), by Material 2025 & 2033
- Figure 53: South America Tissue Engineering Industry Revenue Share (%), by Material 2025 & 2033
- Figure 54: South America Tissue Engineering Industry Volume Share (%), by Material 2025 & 2033
- Figure 55: South America Tissue Engineering Industry Revenue (billion), by Application 2025 & 2033
- Figure 56: South America Tissue Engineering Industry Volume (K Unit), by Application 2025 & 2033
- Figure 57: South America Tissue Engineering Industry Revenue Share (%), by Application 2025 & 2033
- Figure 58: South America Tissue Engineering Industry Volume Share (%), by Application 2025 & 2033
- Figure 59: South America Tissue Engineering Industry Revenue (billion), by Country 2025 & 2033
- Figure 60: South America Tissue Engineering Industry Volume (K Unit), by Country 2025 & 2033
- Figure 61: South America Tissue Engineering Industry Revenue Share (%), by Country 2025 & 2033
- Figure 62: South America Tissue Engineering Industry Volume Share (%), by Country 2025 & 2033
List of Tables
- Table 1: Global Tissue Engineering Industry Revenue billion Forecast, by Material 2020 & 2033
- Table 2: Global Tissue Engineering Industry Volume K Unit Forecast, by Material 2020 & 2033
- Table 3: Global Tissue Engineering Industry Revenue billion Forecast, by Application 2020 & 2033
- Table 4: Global Tissue Engineering Industry Volume K Unit Forecast, by Application 2020 & 2033
- Table 5: Global Tissue Engineering Industry Revenue billion Forecast, by Region 2020 & 2033
- Table 6: Global Tissue Engineering Industry Volume K Unit Forecast, by Region 2020 & 2033
- Table 7: Global Tissue Engineering Industry Revenue billion Forecast, by Material 2020 & 2033
- Table 8: Global Tissue Engineering Industry Volume K Unit Forecast, by Material 2020 & 2033
- Table 9: Global Tissue Engineering Industry Revenue billion Forecast, by Application 2020 & 2033
- Table 10: Global Tissue Engineering Industry Volume K Unit Forecast, by Application 2020 & 2033
- Table 11: Global Tissue Engineering Industry Revenue billion Forecast, by Country 2020 & 2033
- Table 12: Global Tissue Engineering Industry Volume K Unit Forecast, by Country 2020 & 2033
- Table 13: United States Tissue Engineering Industry Revenue (billion) Forecast, by Application 2020 & 2033
- Table 14: United States Tissue Engineering Industry Volume (K Unit) Forecast, by Application 2020 & 2033
- Table 15: Canada Tissue Engineering Industry Revenue (billion) Forecast, by Application 2020 & 2033
- Table 16: Canada Tissue Engineering Industry Volume (K Unit) Forecast, by Application 2020 & 2033
- Table 17: Mexico Tissue Engineering Industry Revenue (billion) Forecast, by Application 2020 & 2033
- Table 18: Mexico Tissue Engineering Industry Volume (K Unit) Forecast, by Application 2020 & 2033
- Table 19: Global Tissue Engineering Industry Revenue billion Forecast, by Material 2020 & 2033
- Table 20: Global Tissue Engineering Industry Volume K Unit Forecast, by Material 2020 & 2033
- Table 21: Global Tissue Engineering Industry Revenue billion Forecast, by Application 2020 & 2033
- Table 22: Global Tissue Engineering Industry Volume K Unit Forecast, by Application 2020 & 2033
- Table 23: Global Tissue Engineering Industry Revenue billion Forecast, by Country 2020 & 2033
- Table 24: Global Tissue Engineering Industry Volume K Unit Forecast, by Country 2020 & 2033
- Table 25: Germany Tissue Engineering Industry Revenue (billion) Forecast, by Application 2020 & 2033
- Table 26: Germany Tissue Engineering Industry Volume (K Unit) Forecast, by Application 2020 & 2033
- Table 27: United Kingdom Tissue Engineering Industry Revenue (billion) Forecast, by Application 2020 & 2033
- Table 28: United Kingdom Tissue Engineering Industry Volume (K Unit) Forecast, by Application 2020 & 2033
- Table 29: France Tissue Engineering Industry Revenue (billion) Forecast, by Application 2020 & 2033
- Table 30: France Tissue Engineering Industry Volume (K Unit) Forecast, by Application 2020 & 2033
- Table 31: Italy Tissue Engineering Industry Revenue (billion) Forecast, by Application 2020 & 2033
- Table 32: Italy Tissue Engineering Industry Volume (K Unit) Forecast, by Application 2020 & 2033
- Table 33: Spain Tissue Engineering Industry Revenue (billion) Forecast, by Application 2020 & 2033
- Table 34: Spain Tissue Engineering Industry Volume (K Unit) Forecast, by Application 2020 & 2033
- Table 35: Rest of Europe Tissue Engineering Industry Revenue (billion) Forecast, by Application 2020 & 2033
- Table 36: Rest of Europe Tissue Engineering Industry Volume (K Unit) Forecast, by Application 2020 & 2033
- Table 37: Global Tissue Engineering Industry Revenue billion Forecast, by Material 2020 & 2033
- Table 38: Global Tissue Engineering Industry Volume K Unit Forecast, by Material 2020 & 2033
- Table 39: Global Tissue Engineering Industry Revenue billion Forecast, by Application 2020 & 2033
- Table 40: Global Tissue Engineering Industry Volume K Unit Forecast, by Application 2020 & 2033
- Table 41: Global Tissue Engineering Industry Revenue billion Forecast, by Country 2020 & 2033
- Table 42: Global Tissue Engineering Industry Volume K Unit Forecast, by Country 2020 & 2033
- Table 43: China Tissue Engineering Industry Revenue (billion) Forecast, by Application 2020 & 2033
- Table 44: China Tissue Engineering Industry Volume (K Unit) Forecast, by Application 2020 & 2033
- Table 45: Japan Tissue Engineering Industry Revenue (billion) Forecast, by Application 2020 & 2033
- Table 46: Japan Tissue Engineering Industry Volume (K Unit) Forecast, by Application 2020 & 2033
- Table 47: India Tissue Engineering Industry Revenue (billion) Forecast, by Application 2020 & 2033
- Table 48: India Tissue Engineering Industry Volume (K Unit) Forecast, by Application 2020 & 2033
- Table 49: Australia Tissue Engineering Industry Revenue (billion) Forecast, by Application 2020 & 2033
- Table 50: Australia Tissue Engineering Industry Volume (K Unit) Forecast, by Application 2020 & 2033
- Table 51: South Korea Tissue Engineering Industry Revenue (billion) Forecast, by Application 2020 & 2033
- Table 52: South Korea Tissue Engineering Industry Volume (K Unit) Forecast, by Application 2020 & 2033
- Table 53: Rest of Asia Pacific Tissue Engineering Industry Revenue (billion) Forecast, by Application 2020 & 2033
- Table 54: Rest of Asia Pacific Tissue Engineering Industry Volume (K Unit) Forecast, by Application 2020 & 2033
- Table 55: Global Tissue Engineering Industry Revenue billion Forecast, by Material 2020 & 2033
- Table 56: Global Tissue Engineering Industry Volume K Unit Forecast, by Material 2020 & 2033
- Table 57: Global Tissue Engineering Industry Revenue billion Forecast, by Application 2020 & 2033
- Table 58: Global Tissue Engineering Industry Volume K Unit Forecast, by Application 2020 & 2033
- Table 59: Global Tissue Engineering Industry Revenue billion Forecast, by Country 2020 & 2033
- Table 60: Global Tissue Engineering Industry Volume K Unit Forecast, by Country 2020 & 2033
- Table 61: GCC Tissue Engineering Industry Revenue (billion) Forecast, by Application 2020 & 2033
- Table 62: GCC Tissue Engineering Industry Volume (K Unit) Forecast, by Application 2020 & 2033
- Table 63: South Africa Tissue Engineering Industry Revenue (billion) Forecast, by Application 2020 & 2033
- Table 64: South Africa Tissue Engineering Industry Volume (K Unit) Forecast, by Application 2020 & 2033
- Table 65: Rest of Middle East and Africa Tissue Engineering Industry Revenue (billion) Forecast, by Application 2020 & 2033
- Table 66: Rest of Middle East and Africa Tissue Engineering Industry Volume (K Unit) Forecast, by Application 2020 & 2033
- Table 67: Global Tissue Engineering Industry Revenue billion Forecast, by Material 2020 & 2033
- Table 68: Global Tissue Engineering Industry Volume K Unit Forecast, by Material 2020 & 2033
- Table 69: Global Tissue Engineering Industry Revenue billion Forecast, by Application 2020 & 2033
- Table 70: Global Tissue Engineering Industry Volume K Unit Forecast, by Application 2020 & 2033
- Table 71: Global Tissue Engineering Industry Revenue billion Forecast, by Country 2020 & 2033
- Table 72: Global Tissue Engineering Industry Volume K Unit Forecast, by Country 2020 & 2033
- Table 73: Brazil Tissue Engineering Industry Revenue (billion) Forecast, by Application 2020 & 2033
- Table 74: Brazil Tissue Engineering Industry Volume (K Unit) Forecast, by Application 2020 & 2033
- Table 75: Argentina Tissue Engineering Industry Revenue (billion) Forecast, by Application 2020 & 2033
- Table 76: Argentina Tissue Engineering Industry Volume (K Unit) Forecast, by Application 2020 & 2033
- Table 77: Rest of South America Tissue Engineering Industry Revenue (billion) Forecast, by Application 2020 & 2033
- Table 78: Rest of South America Tissue Engineering Industry Volume (K Unit) Forecast, by Application 2020 & 2033
Frequently Asked Questions
1. What is the projected Compound Annual Growth Rate (CAGR) of the Tissue Engineering Industry?
The projected CAGR is approximately 14.6%.
2. Which companies are prominent players in the Tissue Engineering Industry?
Key companies in the market include Smith and Nephew (Osiris Therapeutics), AbbVie Inc (Allergan), Biotime Inc, Becton Dickinson and Company (C R Bard), Athersys Inc, Bio Tissue Technologies, Organogenesis, B Braun Melsungen AG, Tissue Regenix Group plc*List Not Exhaustive, Zimmer Biomet, Acell Inc, Integra Lifesciences.
3. What are the main segments of the Tissue Engineering Industry?
The market segments include Material, Application.
4. Can you provide details about the market size?
The market size is estimated to be USD 22.75 billion as of 2022.
5. What are some drivers contributing to market growth?
Increase Incidences of Chronic Diseases. Road Accidents. and Trauma Injuries; Technological Advancements in 3D Tissue Engineering; Increase in Funding and Research for Tissue Regeneration.
6. What are the notable trends driving market growth?
Orthopedic Segment is Expected to Show the Fastest Growth During the Forecast Period.
7. Are there any restraints impacting market growth?
High Cost of Treatments Related to Tissue Engineering; Lack of Awareness Regarding Tissue Engineering.
8. Can you provide examples of recent developments in the market?
In May 2022, Rousselot, Darling Ingredients' health brand, has launched Quali-Pure HGP 2000, a new endotoxin-controlled, pharmaceutical-grade gelatin specifically designed for vaccines and wound healing applications.
9. What pricing options are available for accessing the report?
Pricing options include single-user, multi-user, and enterprise licenses priced at USD 4750, USD 5250, and USD 8750 respectively.
10. Is the market size provided in terms of value or volume?
The market size is provided in terms of value, measured in billion and volume, measured in K Unit.
11. Are there any specific market keywords associated with the report?
Yes, the market keyword associated with the report is "Tissue Engineering Industry," which aids in identifying and referencing the specific market segment covered.
12. How do I determine which pricing option suits my needs best?
The pricing options vary based on user requirements and access needs. Individual users may opt for single-user licenses, while businesses requiring broader access may choose multi-user or enterprise licenses for cost-effective access to the report.
13. Are there any additional resources or data provided in the Tissue Engineering Industry report?
While the report offers comprehensive insights, it's advisable to review the specific contents or supplementary materials provided to ascertain if additional resources or data are available.
14. How can I stay updated on further developments or reports in the Tissue Engineering Industry?
To stay informed about further developments, trends, and reports in the Tissue Engineering Industry, consider subscribing to industry newsletters, following relevant companies and organizations, or regularly checking reputable industry news sources and publications.
Methodology
Step 1 - Identification of Relevant Samples Size from Population Database


Step 2 - Approaches for Defining Global Market Size (Value, Volume* & Price*)

Note*: In applicable scenarios
Step 3 - Data Sources
Primary Research
- Web Analytics
- Survey Reports
- Research Institute
- Latest Research Reports
- Opinion Leaders
Secondary Research
- Annual Reports
- White Paper
- Latest Press Release
- Industry Association
- Paid Database
- Investor Presentations

Step 4 - Data Triangulation
Involves using different sources of information in order to increase the validity of a study
These sources are likely to be stakeholders in a program - participants, other researchers, program staff, other community members, and so on.
Then we put all data in single framework & apply various statistical tools to find out the dynamic on the market.
During the analysis stage, feedback from the stakeholder groups would be compared to determine areas of agreement as well as areas of divergence