

Key Insights
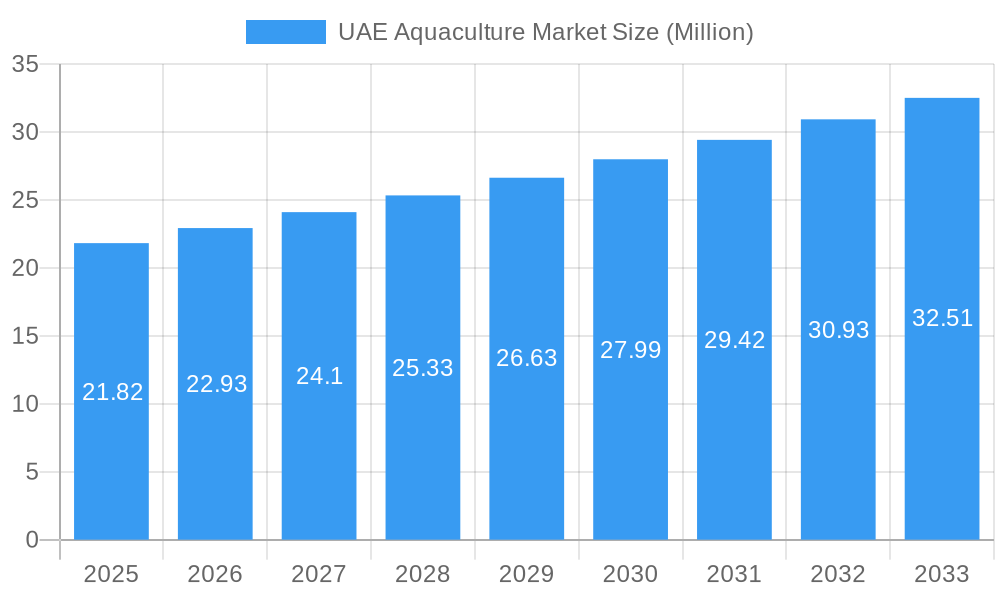
The UAE aquaculture market, valued at $21.82 million in 2025, is projected to experience robust growth, exhibiting a compound annual growth rate (CAGR) of 5.10% from 2025 to 2033. This expansion is driven by several key factors. Increasing consumer demand for seafood, coupled with a growing awareness of the health benefits associated with fish consumption, fuels market expansion. Government initiatives promoting sustainable aquaculture practices and investments in advanced aquaculture technologies further contribute to this growth. The diversification of species cultivated, including tilapia, shrimp, salmon, and various pelagic and demersal fish, caters to evolving consumer preferences and enhances market resilience. Furthermore, the UAE's strategic location facilitates both import and export opportunities, contributing to market dynamism. While challenges such as fluctuating feed prices and the potential impact of environmental factors remain, the overall outlook for the UAE aquaculture market is positive, with significant potential for future expansion.
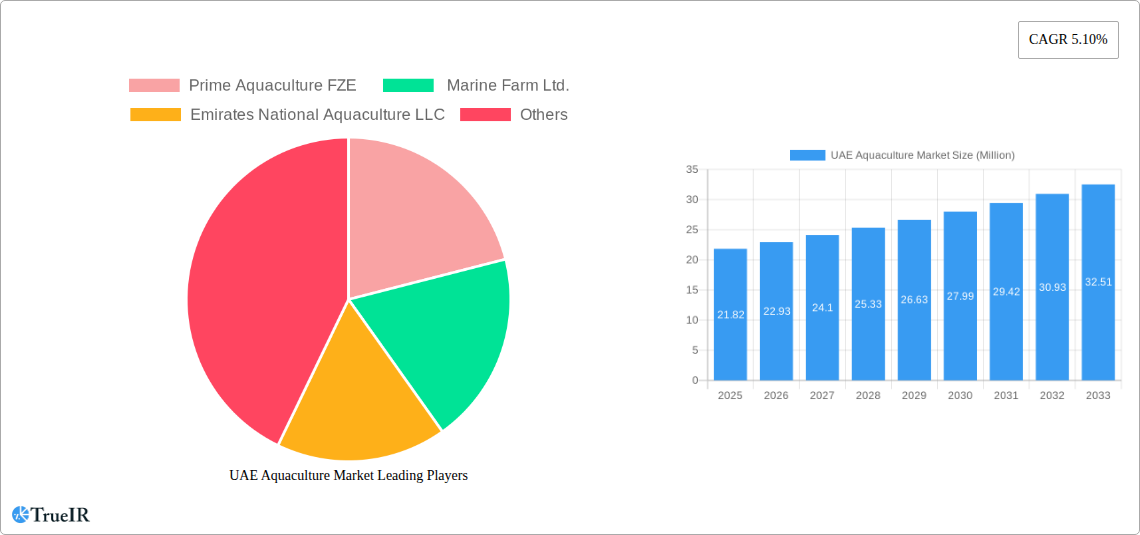
UAE Aquaculture Market Market Size (In Million)
The market segmentation reveals a diverse product portfolio, with tilapia, shrimp, and salmon among the leading contributors. The "Other Types" segment, encompassing a range of species, presents opportunities for diversification and innovation. Analysis of production, consumption, import, and export patterns across different fish types provides valuable insights into market dynamics and helps identify areas for targeted growth strategies. The leading companies – Prime Aquaculture FZE, Marine Farm Ltd., and Emirates National Aquaculture LLC – play a crucial role in shaping the market landscape through their production capabilities and market reach. The forecast period of 2025-2033 offers substantial opportunities for market players to capitalize on the growing demand for sustainably produced, high-quality seafood in the UAE. Future growth will likely be influenced by factors such as technological advancements, consumer preferences, and government policies supporting sustainable aquaculture.
UAE Aquaculture Market Company Market Share
UAE Aquaculture Market Report: 2019-2033
This comprehensive report provides a detailed analysis of the UAE aquaculture market, covering the period 2019-2033. It offers invaluable insights into market size, segmentation, competitive dynamics, and future growth projections, making it an essential resource for industry stakeholders, investors, and researchers. Leveraging high-volume keywords like "UAE Aquaculture Market," "Aquaculture Production," "Seafood Consumption," and "Recirculating Aquaculture Systems (RAS)," this report delivers crucial data for informed decision-making.
UAE Aquaculture Market Structure & Competitive Landscape
The UAE aquaculture market exhibits a moderately concentrated structure, with a few key players dominating specific segments. The market is characterized by increasing innovation driven by the need for sustainable seafood production and food security initiatives. Stringent regulatory frameworks influence market dynamics, shaping sustainable practices and ensuring product quality. Product substitutes, particularly imported seafood, create competitive pressures. End-users encompass diverse segments, including restaurants, retailers, and processors. M&A activity is on the rise, with a projected xx Million in deals closed between 2022 and 2024, consolidating market shares and driving innovation.
- Market Concentration: The Herfindahl-Hirschman Index (HHI) is estimated at xx, suggesting a moderately concentrated market.
- Innovation Drivers: Growing demand for sustainable seafood, technological advancements in RAS, and government support for aquaculture development.
- Regulatory Impacts: Strict regulations on environmental sustainability, food safety, and traceability significantly shape market practices.
- Product Substitutes: Imported seafood poses a significant competitive challenge.
- End-User Segmentation: Restaurants, hotels, retailers, food processors, and direct consumers.
- M&A Trends: Increasing consolidation through mergers and acquisitions, driven by the pursuit of economies of scale and technological integration.
UAE Aquaculture Market Market Trends & Opportunities
The UAE aquaculture market is experiencing robust growth, driven by rising seafood consumption, government initiatives promoting food security, and increasing investments in advanced aquaculture technologies. The market is projected to register a CAGR of xx% during the forecast period (2025-2033), reaching a value of xx Million by 2033. Technological advancements, particularly in RAS, are revolutionizing production efficiency and sustainability. Consumer preferences are shifting towards premium quality, locally-sourced seafood, creating opportunities for high-value aquaculture products. Competitive dynamics are influenced by both established players and new entrants adopting innovative technologies and sustainable practices. Market penetration of RAS technology is expected to increase from xx% in 2025 to xx% by 2033.
Dominant Markets & Segments in UAE Aquaculture Market
The UAE's aquaculture market shows significant growth across various segments. Shrimp farming is currently the most dominant segment by value, followed by tilapia and salmon.
- Key Growth Drivers:
- Government support and subsidies for the aquaculture industry.
- Increasing consumer demand for locally produced seafood.
- Investments in advanced aquaculture technologies such as RAS.
- Development of integrated aquaculture projects.
- Dominant Segments: Shrimp farming holds the largest market share by volume and value, driven by high consumer demand and successful RAS implementations. Tilapia and salmon farming are emerging as significant segments, particularly with the recent investments in RAS facilities.
Production Analysis, Consumption Analysis, Import/Export Analysis (Value & Volume), and Price Trend Analysis by Segment: (Values are in Million)
| Segment | Production (2024) | Consumption (2024) | Import (2024) | Export (2024) | Price Trend (2025-2033) | |----------------|--------------------|---------------------|-----------------|-----------------|-------------------------| | Tilapia | xx | xx | xx | xx | xx% increase | | Scallop | xx | xx | xx | xx | xx% increase | | Shrimp | xx | xx | xx | xx | xx% increase | | Lobsters | xx | xx | xx | xx | xx% increase | | Caviar | xx | xx | xx | xx | xx% increase | | Salmon | xx | xx | xx | xx | xx% increase | | Other Types | xx | xx | xx | xx | xx% increase | | Pelagic Fish | xx | xx | xx | xx | xx% increase | | Barracuda | xx | xx | xx | xx | xx% increase | | Demersal Fish | xx | xx | xx | xx | xx% increase | | Freshwater Fish | xx | xx | xx | xx | xx% increase |
UAE Aquaculture Market Product Analysis
The UAE aquaculture market showcases a diversity of products, ranging from traditional species like tilapia and shrimp to higher-value species such as salmon and lobster. Technological advancements in RAS are leading to improved product quality, increased yields, and enhanced sustainability. These innovations allow for the production of premium quality seafood while minimizing environmental impact, catering to the growing consumer demand for sustainable and high-quality products. The market is witnessing a trend towards diversification, with increased production of specialized species and value-added products.
Key Drivers, Barriers & Challenges in UAE Aquaculture Market
Key Drivers:
- Government initiatives promoting food security and sustainable aquaculture.
- Technological advancements in RAS, enhancing efficiency and sustainability.
- Rising consumer demand for locally-sourced, high-quality seafood.
Challenges:
- High initial investment costs for setting up RAS facilities.
- Limited availability of skilled labor in aquaculture.
- Competition from imported seafood, especially in price-sensitive segments.
- Water scarcity and resource management in the region. (Quantifiable impact: xx% reduction in potential output)
Growth Drivers in the UAE Aquaculture Market Market
The UAE aquaculture market is propelled by several factors: Government support through subsidies and initiatives focused on food security plays a crucial role. Technological advancements, particularly the adoption of RAS, significantly enhance production efficiency and sustainability. Rising consumer demand for premium, locally-sourced seafood creates opportunities for growth. These factors create a synergistic environment fostering the expansion of the UAE aquaculture sector.
Challenges Impacting UAE Aquaculture Market Growth
Several challenges hinder the growth of the UAE's aquaculture market. High initial investment costs for RAS technologies can limit entry for smaller players. Competition from imported seafood, often at lower prices, creates market pressure. Water scarcity and resource management remain critical considerations for sustainable aquaculture practices. These obstacles need addressing for continued market expansion.
Key Players Shaping the UAE Aquaculture Market Market
- Prime Aquaculture FZE
- Marine Farm Ltd.
- Emirates National Aquaculture LLC
Significant UAE Aquaculture Market Industry Milestones
- February 2022: Prime Aquaculture FZE, an Emirates National Aquaculture LLC subsidiary, commences construction of the region's first shrimp RAS in Jafza, aiming to meet growing regional demand and the National Food Security Strategy 2051.
- March 2022: A project to build a new RAS facility in Abu Dhabi is launched, targeting the production of 2,000 metric tons of premium Atlantic salmon annually, utilizing technology that reuses over 99.5% of process water.
- July 2022: The UAE Ministry of Climate Change and Environment partners with Abu Dhabi National Oil Company and Emirates National Oil Company to provide subsidies to fishermen, addressing rising costs and supporting the fisheries sector.
Future Outlook for UAE Aquaculture Market Market
The UAE aquaculture market is poised for significant growth driven by continued government support, technological innovation, and expanding consumer demand. Strategic investments in RAS and other sustainable aquaculture technologies will be key to unlocking the market's full potential. Diversification into high-value species and the development of value-added products will further drive market expansion, strengthening the UAE's food security and economic growth.
UAE Aquaculture Market Segmentation
-
1. Type (Pr
-
1.1. Pelagic Fish
- 1.1.1. Sardines
- 1.1.2. Mackerel
- 1.1.3. Tuna
- 1.1.4. Barracuda
-
1.2. Demersal Fish
- 1.2.1. Grouper
- 1.2.2. Trevally
- 1.2.3. Emperor
- 1.2.4. Pomfret
-
1.3. Freshwater Fish
- 1.3.1. Tilapia
- 1.4. Scallop
- 1.5. Shrimp
- 1.6. Lobsters
- 1.7. Caviar
- 1.8. Salmon
- 1.9. Other Types
-
1.1. Pelagic Fish
-
2. Type (Pr
-
2.1. Pelagic Fish
- 2.1.1. Sardines
- 2.1.2. Mackerel
- 2.1.3. Tuna
- 2.1.4. Barracuda
-
2.2. Demersal Fish
- 2.2.1. Grouper
- 2.2.2. Trevally
- 2.2.3. Emperor
- 2.2.4. Pomfret
-
2.3. Freshwater Fish
- 2.3.1. Tilapia
- 2.4. Scallop
- 2.5. Shrimp
- 2.6. Lobsters
- 2.7. Caviar
- 2.8. Salmon
- 2.9. Other Types
-
2.1. Pelagic Fish
UAE Aquaculture Market Segmentation By Geography
-
1. North America
- 1.1. United States
- 1.2. Canada
- 1.3. Mexico
-
2. South America
- 2.1. Brazil
- 2.2. Argentina
- 2.3. Rest of South America
-
3. Europe
- 3.1. United Kingdom
- 3.2. Germany
- 3.3. France
- 3.4. Italy
- 3.5. Spain
- 3.6. Russia
- 3.7. Benelux
- 3.8. Nordics
- 3.9. Rest of Europe
-
4. Middle East & Africa
- 4.1. Turkey
- 4.2. Israel
- 4.3. GCC
- 4.4. North Africa
- 4.5. South Africa
- 4.6. Rest of Middle East & Africa
-
5. Asia Pacific
- 5.1. China
- 5.2. India
- 5.3. Japan
- 5.4. South Korea
- 5.5. ASEAN
- 5.6. Oceania
- 5.7. Rest of Asia Pacific
UAE Aquaculture Market Regional Market Share
Geographic Coverage of UAE Aquaculture Market
UAE Aquaculture Market REPORT HIGHLIGHTS
| Aspects | Details |
|---|---|
| Study Period | 2020-2034 |
| Base Year | 2025 |
| Estimated Year | 2026 |
| Forecast Period | 2026-2034 |
| Historical Period | 2020-2025 |
| Growth Rate | CAGR of 5.10% from 2020-2034 |
| Segmentation |
|
Table of Contents
- 1. Introduction
- 1.1. Research Scope
- 1.2. Market Segmentation
- 1.3. Research Objective
- 1.4. Definitions and Assumptions
- 2. Executive Summary
- 2.1. Market Snapshot
- 3. Market Dynamics
- 3.1. Market Drivers
- 3.2. Market Restrains
- 3.3. Market Trends
- 3.4. Market Opportunities
- 4. Market Factor Analysis
- 4.1. Porters Five Forces
- 4.1.1. Bargaining Power of Suppliers
- 4.1.2. Bargaining Power of Buyers
- 4.1.3. Threat of New Entrants
- 4.1.4. Threat of Substitutes
- 4.1.5. Competitive Rivalry
- 4.2. PESTEL analysis
- 4.3. BCG Analysis
- 4.3.1. Stars (High Growth, High Market Share)
- 4.3.2. Cash Cows (Low Growth, High Market Share)
- 4.3.3. Question Mark (High Growth, Low Market Share)
- 4.3.4. Dogs (Low Growth, Low Market Share)
- 4.4. Ansoff Matrix Analysis
- 4.5. Supply Chain Analysis
- 4.6. Regulatory Landscape
- 4.7. Current Market Potential and Opportunity Assessment (TAM–SAM–SOM Framework)
- 4.8. TIR Analyst Note
- 4.1. Porters Five Forces
- 5. Market Analysis, Insights and Forecast 2021-2033
- 5.1. Market Analysis, Insights and Forecast - by Type (Pr
- 5.1.1. Pelagic Fish
- 5.1.1.1. Sardines
- 5.1.1.2. Mackerel
- 5.1.1.3. Tuna
- 5.1.1.4. Barracuda
- 5.1.2. Demersal Fish
- 5.1.2.1. Grouper
- 5.1.2.2. Trevally
- 5.1.2.3. Emperor
- 5.1.2.4. Pomfret
- 5.1.3. Freshwater Fish
- 5.1.3.1. Tilapia
- 5.1.4. Scallop
- 5.1.5. Shrimp
- 5.1.6. Lobsters
- 5.1.7. Caviar
- 5.1.8. Salmon
- 5.1.9. Other Types
- 5.1.1. Pelagic Fish
- 5.2. Market Analysis, Insights and Forecast - by Type (Pr
- 5.2.1. Pelagic Fish
- 5.2.1.1. Sardines
- 5.2.1.2. Mackerel
- 5.2.1.3. Tuna
- 5.2.1.4. Barracuda
- 5.2.2. Demersal Fish
- 5.2.2.1. Grouper
- 5.2.2.2. Trevally
- 5.2.2.3. Emperor
- 5.2.2.4. Pomfret
- 5.2.3. Freshwater Fish
- 5.2.3.1. Tilapia
- 5.2.4. Scallop
- 5.2.5. Shrimp
- 5.2.6. Lobsters
- 5.2.7. Caviar
- 5.2.8. Salmon
- 5.2.9. Other Types
- 5.2.1. Pelagic Fish
- 5.3. Market Analysis, Insights and Forecast - by Region
- 5.3.1. North America
- 5.3.2. South America
- 5.3.3. Europe
- 5.3.4. Middle East & Africa
- 5.3.5. Asia Pacific
- 5.1. Market Analysis, Insights and Forecast - by Type (Pr
- 6. Global UAE Aquaculture Market Analysis, Insights and Forecast, 2021-2033
- 6.1. Market Analysis, Insights and Forecast - by Type (Pr
- 6.1.1. Pelagic Fish
- 6.1.1.1. Sardines
- 6.1.1.2. Mackerel
- 6.1.1.3. Tuna
- 6.1.1.4. Barracuda
- 6.1.2. Demersal Fish
- 6.1.2.1. Grouper
- 6.1.2.2. Trevally
- 6.1.2.3. Emperor
- 6.1.2.4. Pomfret
- 6.1.3. Freshwater Fish
- 6.1.3.1. Tilapia
- 6.1.4. Scallop
- 6.1.5. Shrimp
- 6.1.6. Lobsters
- 6.1.7. Caviar
- 6.1.8. Salmon
- 6.1.9. Other Types
- 6.1.1. Pelagic Fish
- 6.2. Market Analysis, Insights and Forecast - by Type (Pr
- 6.2.1. Pelagic Fish
- 6.2.1.1. Sardines
- 6.2.1.2. Mackerel
- 6.2.1.3. Tuna
- 6.2.1.4. Barracuda
- 6.2.2. Demersal Fish
- 6.2.2.1. Grouper
- 6.2.2.2. Trevally
- 6.2.2.3. Emperor
- 6.2.2.4. Pomfret
- 6.2.3. Freshwater Fish
- 6.2.3.1. Tilapia
- 6.2.4. Scallop
- 6.2.5. Shrimp
- 6.2.6. Lobsters
- 6.2.7. Caviar
- 6.2.8. Salmon
- 6.2.9. Other Types
- 6.2.1. Pelagic Fish
- 6.1. Market Analysis, Insights and Forecast - by Type (Pr
- 7. North America UAE Aquaculture Market Analysis, Insights and Forecast, 2020-2032
- 7.1. Market Analysis, Insights and Forecast - by Type (Pr
- 7.1.1. Pelagic Fish
- 7.1.1.1. Sardines
- 7.1.1.2. Mackerel
- 7.1.1.3. Tuna
- 7.1.1.4. Barracuda
- 7.1.2. Demersal Fish
- 7.1.2.1. Grouper
- 7.1.2.2. Trevally
- 7.1.2.3. Emperor
- 7.1.2.4. Pomfret
- 7.1.3. Freshwater Fish
- 7.1.3.1. Tilapia
- 7.1.4. Scallop
- 7.1.5. Shrimp
- 7.1.6. Lobsters
- 7.1.7. Caviar
- 7.1.8. Salmon
- 7.1.9. Other Types
- 7.1.1. Pelagic Fish
- 7.2. Market Analysis, Insights and Forecast - by Type (Pr
- 7.2.1. Pelagic Fish
- 7.2.1.1. Sardines
- 7.2.1.2. Mackerel
- 7.2.1.3. Tuna
- 7.2.1.4. Barracuda
- 7.2.2. Demersal Fish
- 7.2.2.1. Grouper
- 7.2.2.2. Trevally
- 7.2.2.3. Emperor
- 7.2.2.4. Pomfret
- 7.2.3. Freshwater Fish
- 7.2.3.1. Tilapia
- 7.2.4. Scallop
- 7.2.5. Shrimp
- 7.2.6. Lobsters
- 7.2.7. Caviar
- 7.2.8. Salmon
- 7.2.9. Other Types
- 7.2.1. Pelagic Fish
- 7.1. Market Analysis, Insights and Forecast - by Type (Pr
- 8. South America UAE Aquaculture Market Analysis, Insights and Forecast, 2020-2032
- 8.1. Market Analysis, Insights and Forecast - by Type (Pr
- 8.1.1. Pelagic Fish
- 8.1.1.1. Sardines
- 8.1.1.2. Mackerel
- 8.1.1.3. Tuna
- 8.1.1.4. Barracuda
- 8.1.2. Demersal Fish
- 8.1.2.1. Grouper
- 8.1.2.2. Trevally
- 8.1.2.3. Emperor
- 8.1.2.4. Pomfret
- 8.1.3. Freshwater Fish
- 8.1.3.1. Tilapia
- 8.1.4. Scallop
- 8.1.5. Shrimp
- 8.1.6. Lobsters
- 8.1.7. Caviar
- 8.1.8. Salmon
- 8.1.9. Other Types
- 8.1.1. Pelagic Fish
- 8.2. Market Analysis, Insights and Forecast - by Type (Pr
- 8.2.1. Pelagic Fish
- 8.2.1.1. Sardines
- 8.2.1.2. Mackerel
- 8.2.1.3. Tuna
- 8.2.1.4. Barracuda
- 8.2.2. Demersal Fish
- 8.2.2.1. Grouper
- 8.2.2.2. Trevally
- 8.2.2.3. Emperor
- 8.2.2.4. Pomfret
- 8.2.3. Freshwater Fish
- 8.2.3.1. Tilapia
- 8.2.4. Scallop
- 8.2.5. Shrimp
- 8.2.6. Lobsters
- 8.2.7. Caviar
- 8.2.8. Salmon
- 8.2.9. Other Types
- 8.2.1. Pelagic Fish
- 8.1. Market Analysis, Insights and Forecast - by Type (Pr
- 9. Europe UAE Aquaculture Market Analysis, Insights and Forecast, 2020-2032
- 9.1. Market Analysis, Insights and Forecast - by Type (Pr
- 9.1.1. Pelagic Fish
- 9.1.1.1. Sardines
- 9.1.1.2. Mackerel
- 9.1.1.3. Tuna
- 9.1.1.4. Barracuda
- 9.1.2. Demersal Fish
- 9.1.2.1. Grouper
- 9.1.2.2. Trevally
- 9.1.2.3. Emperor
- 9.1.2.4. Pomfret
- 9.1.3. Freshwater Fish
- 9.1.3.1. Tilapia
- 9.1.4. Scallop
- 9.1.5. Shrimp
- 9.1.6. Lobsters
- 9.1.7. Caviar
- 9.1.8. Salmon
- 9.1.9. Other Types
- 9.1.1. Pelagic Fish
- 9.2. Market Analysis, Insights and Forecast - by Type (Pr
- 9.2.1. Pelagic Fish
- 9.2.1.1. Sardines
- 9.2.1.2. Mackerel
- 9.2.1.3. Tuna
- 9.2.1.4. Barracuda
- 9.2.2. Demersal Fish
- 9.2.2.1. Grouper
- 9.2.2.2. Trevally
- 9.2.2.3. Emperor
- 9.2.2.4. Pomfret
- 9.2.3. Freshwater Fish
- 9.2.3.1. Tilapia
- 9.2.4. Scallop
- 9.2.5. Shrimp
- 9.2.6. Lobsters
- 9.2.7. Caviar
- 9.2.8. Salmon
- 9.2.9. Other Types
- 9.2.1. Pelagic Fish
- 9.1. Market Analysis, Insights and Forecast - by Type (Pr
- 10. Middle East & Africa UAE Aquaculture Market Analysis, Insights and Forecast, 2020-2032
- 10.1. Market Analysis, Insights and Forecast - by Type (Pr
- 10.1.1. Pelagic Fish
- 10.1.1.1. Sardines
- 10.1.1.2. Mackerel
- 10.1.1.3. Tuna
- 10.1.1.4. Barracuda
- 10.1.2. Demersal Fish
- 10.1.2.1. Grouper
- 10.1.2.2. Trevally
- 10.1.2.3. Emperor
- 10.1.2.4. Pomfret
- 10.1.3. Freshwater Fish
- 10.1.3.1. Tilapia
- 10.1.4. Scallop
- 10.1.5. Shrimp
- 10.1.6. Lobsters
- 10.1.7. Caviar
- 10.1.8. Salmon
- 10.1.9. Other Types
- 10.1.1. Pelagic Fish
- 10.2. Market Analysis, Insights and Forecast - by Type (Pr
- 10.2.1. Pelagic Fish
- 10.2.1.1. Sardines
- 10.2.1.2. Mackerel
- 10.2.1.3. Tuna
- 10.2.1.4. Barracuda
- 10.2.2. Demersal Fish
- 10.2.2.1. Grouper
- 10.2.2.2. Trevally
- 10.2.2.3. Emperor
- 10.2.2.4. Pomfret
- 10.2.3. Freshwater Fish
- 10.2.3.1. Tilapia
- 10.2.4. Scallop
- 10.2.5. Shrimp
- 10.2.6. Lobsters
- 10.2.7. Caviar
- 10.2.8. Salmon
- 10.2.9. Other Types
- 10.2.1. Pelagic Fish
- 10.1. Market Analysis, Insights and Forecast - by Type (Pr
- 11. Asia Pacific UAE Aquaculture Market Analysis, Insights and Forecast, 2020-2032
- 11.1. Market Analysis, Insights and Forecast - by Type (Pr
- 11.1.1. Pelagic Fish
- 11.1.1.1. Sardines
- 11.1.1.2. Mackerel
- 11.1.1.3. Tuna
- 11.1.1.4. Barracuda
- 11.1.2. Demersal Fish
- 11.1.2.1. Grouper
- 11.1.2.2. Trevally
- 11.1.2.3. Emperor
- 11.1.2.4. Pomfret
- 11.1.3. Freshwater Fish
- 11.1.3.1. Tilapia
- 11.1.4. Scallop
- 11.1.5. Shrimp
- 11.1.6. Lobsters
- 11.1.7. Caviar
- 11.1.8. Salmon
- 11.1.9. Other Types
- 11.1.1. Pelagic Fish
- 11.2. Market Analysis, Insights and Forecast - by Type (Pr
- 11.2.1. Pelagic Fish
- 11.2.1.1. Sardines
- 11.2.1.2. Mackerel
- 11.2.1.3. Tuna
- 11.2.1.4. Barracuda
- 11.2.2. Demersal Fish
- 11.2.2.1. Grouper
- 11.2.2.2. Trevally
- 11.2.2.3. Emperor
- 11.2.2.4. Pomfret
- 11.2.3. Freshwater Fish
- 11.2.3.1. Tilapia
- 11.2.4. Scallop
- 11.2.5. Shrimp
- 11.2.6. Lobsters
- 11.2.7. Caviar
- 11.2.8. Salmon
- 11.2.9. Other Types
- 11.2.1. Pelagic Fish
- 11.1. Market Analysis, Insights and Forecast - by Type (Pr
- 12. Competitive Analysis
- 12.1. Company Profiles
- 12.1.1 Prime Aquaculture FZE
- 12.1.1.1. Company Overview
- 12.1.1.2. Products
- 12.1.1.3. Company Financials
- 12.1.1.4. SWOT Analysis
- 12.1.2 Marine Farm Ltd.
- 12.1.2.1. Company Overview
- 12.1.2.2. Products
- 12.1.2.3. Company Financials
- 12.1.2.4. SWOT Analysis
- 12.1.3 Emirates National Aquaculture LLC
- 12.1.3.1. Company Overview
- 12.1.3.2. Products
- 12.1.3.3. Company Financials
- 12.1.3.4. SWOT Analysis
- 12.1.1 Prime Aquaculture FZE
- 12.2. Market Entropy
- 12.2.1 Company's Key Areas Served
- 12.2.2 Recent Developments
- 12.3. Company Market Share Analysis 2025
- 12.3.1 Top 5 Companies Market Share Analysis
- 12.3.2 Top 3 Companies Market Share Analysis
- 12.4. List of Potential Customers
- 13. Research Methodology
List of Figures
- Figure 1: Global UAE Aquaculture Market Revenue Breakdown (Million, %) by Region 2025 & 2033
- Figure 2: North America UAE Aquaculture Market Revenue (Million), by Type (Pr 2025 & 2033
- Figure 3: North America UAE Aquaculture Market Revenue Share (%), by Type (Pr 2025 & 2033
- Figure 4: North America UAE Aquaculture Market Revenue (Million), by Type (Pr 2025 & 2033
- Figure 5: North America UAE Aquaculture Market Revenue Share (%), by Type (Pr 2025 & 2033
- Figure 6: North America UAE Aquaculture Market Revenue (Million), by Country 2025 & 2033
- Figure 7: North America UAE Aquaculture Market Revenue Share (%), by Country 2025 & 2033
- Figure 8: South America UAE Aquaculture Market Revenue (Million), by Type (Pr 2025 & 2033
- Figure 9: South America UAE Aquaculture Market Revenue Share (%), by Type (Pr 2025 & 2033
- Figure 10: South America UAE Aquaculture Market Revenue (Million), by Type (Pr 2025 & 2033
- Figure 11: South America UAE Aquaculture Market Revenue Share (%), by Type (Pr 2025 & 2033
- Figure 12: South America UAE Aquaculture Market Revenue (Million), by Country 2025 & 2033
- Figure 13: South America UAE Aquaculture Market Revenue Share (%), by Country 2025 & 2033
- Figure 14: Europe UAE Aquaculture Market Revenue (Million), by Type (Pr 2025 & 2033
- Figure 15: Europe UAE Aquaculture Market Revenue Share (%), by Type (Pr 2025 & 2033
- Figure 16: Europe UAE Aquaculture Market Revenue (Million), by Type (Pr 2025 & 2033
- Figure 17: Europe UAE Aquaculture Market Revenue Share (%), by Type (Pr 2025 & 2033
- Figure 18: Europe UAE Aquaculture Market Revenue (Million), by Country 2025 & 2033
- Figure 19: Europe UAE Aquaculture Market Revenue Share (%), by Country 2025 & 2033
- Figure 20: Middle East & Africa UAE Aquaculture Market Revenue (Million), by Type (Pr 2025 & 2033
- Figure 21: Middle East & Africa UAE Aquaculture Market Revenue Share (%), by Type (Pr 2025 & 2033
- Figure 22: Middle East & Africa UAE Aquaculture Market Revenue (Million), by Type (Pr 2025 & 2033
- Figure 23: Middle East & Africa UAE Aquaculture Market Revenue Share (%), by Type (Pr 2025 & 2033
- Figure 24: Middle East & Africa UAE Aquaculture Market Revenue (Million), by Country 2025 & 2033
- Figure 25: Middle East & Africa UAE Aquaculture Market Revenue Share (%), by Country 2025 & 2033
- Figure 26: Asia Pacific UAE Aquaculture Market Revenue (Million), by Type (Pr 2025 & 2033
- Figure 27: Asia Pacific UAE Aquaculture Market Revenue Share (%), by Type (Pr 2025 & 2033
- Figure 28: Asia Pacific UAE Aquaculture Market Revenue (Million), by Type (Pr 2025 & 2033
- Figure 29: Asia Pacific UAE Aquaculture Market Revenue Share (%), by Type (Pr 2025 & 2033
- Figure 30: Asia Pacific UAE Aquaculture Market Revenue (Million), by Country 2025 & 2033
- Figure 31: Asia Pacific UAE Aquaculture Market Revenue Share (%), by Country 2025 & 2033
List of Tables
- Table 1: Global UAE Aquaculture Market Revenue Million Forecast, by Type (Pr 2020 & 2033
- Table 2: Global UAE Aquaculture Market Revenue Million Forecast, by Type (Pr 2020 & 2033
- Table 3: Global UAE Aquaculture Market Revenue Million Forecast, by Region 2020 & 2033
- Table 4: Global UAE Aquaculture Market Revenue Million Forecast, by Type (Pr 2020 & 2033
- Table 5: Global UAE Aquaculture Market Revenue Million Forecast, by Type (Pr 2020 & 2033
- Table 6: Global UAE Aquaculture Market Revenue Million Forecast, by Country 2020 & 2033
- Table 7: United States UAE Aquaculture Market Revenue (Million) Forecast, by Application 2020 & 2033
- Table 8: Canada UAE Aquaculture Market Revenue (Million) Forecast, by Application 2020 & 2033
- Table 9: Mexico UAE Aquaculture Market Revenue (Million) Forecast, by Application 2020 & 2033
- Table 10: Global UAE Aquaculture Market Revenue Million Forecast, by Type (Pr 2020 & 2033
- Table 11: Global UAE Aquaculture Market Revenue Million Forecast, by Type (Pr 2020 & 2033
- Table 12: Global UAE Aquaculture Market Revenue Million Forecast, by Country 2020 & 2033
- Table 13: Brazil UAE Aquaculture Market Revenue (Million) Forecast, by Application 2020 & 2033
- Table 14: Argentina UAE Aquaculture Market Revenue (Million) Forecast, by Application 2020 & 2033
- Table 15: Rest of South America UAE Aquaculture Market Revenue (Million) Forecast, by Application 2020 & 2033
- Table 16: Global UAE Aquaculture Market Revenue Million Forecast, by Type (Pr 2020 & 2033
- Table 17: Global UAE Aquaculture Market Revenue Million Forecast, by Type (Pr 2020 & 2033
- Table 18: Global UAE Aquaculture Market Revenue Million Forecast, by Country 2020 & 2033
- Table 19: United Kingdom UAE Aquaculture Market Revenue (Million) Forecast, by Application 2020 & 2033
- Table 20: Germany UAE Aquaculture Market Revenue (Million) Forecast, by Application 2020 & 2033
- Table 21: France UAE Aquaculture Market Revenue (Million) Forecast, by Application 2020 & 2033
- Table 22: Italy UAE Aquaculture Market Revenue (Million) Forecast, by Application 2020 & 2033
- Table 23: Spain UAE Aquaculture Market Revenue (Million) Forecast, by Application 2020 & 2033
- Table 24: Russia UAE Aquaculture Market Revenue (Million) Forecast, by Application 2020 & 2033
- Table 25: Benelux UAE Aquaculture Market Revenue (Million) Forecast, by Application 2020 & 2033
- Table 26: Nordics UAE Aquaculture Market Revenue (Million) Forecast, by Application 2020 & 2033
- Table 27: Rest of Europe UAE Aquaculture Market Revenue (Million) Forecast, by Application 2020 & 2033
- Table 28: Global UAE Aquaculture Market Revenue Million Forecast, by Type (Pr 2020 & 2033
- Table 29: Global UAE Aquaculture Market Revenue Million Forecast, by Type (Pr 2020 & 2033
- Table 30: Global UAE Aquaculture Market Revenue Million Forecast, by Country 2020 & 2033
- Table 31: Turkey UAE Aquaculture Market Revenue (Million) Forecast, by Application 2020 & 2033
- Table 32: Israel UAE Aquaculture Market Revenue (Million) Forecast, by Application 2020 & 2033
- Table 33: GCC UAE Aquaculture Market Revenue (Million) Forecast, by Application 2020 & 2033
- Table 34: North Africa UAE Aquaculture Market Revenue (Million) Forecast, by Application 2020 & 2033
- Table 35: South Africa UAE Aquaculture Market Revenue (Million) Forecast, by Application 2020 & 2033
- Table 36: Rest of Middle East & Africa UAE Aquaculture Market Revenue (Million) Forecast, by Application 2020 & 2033
- Table 37: Global UAE Aquaculture Market Revenue Million Forecast, by Type (Pr 2020 & 2033
- Table 38: Global UAE Aquaculture Market Revenue Million Forecast, by Type (Pr 2020 & 2033
- Table 39: Global UAE Aquaculture Market Revenue Million Forecast, by Country 2020 & 2033
- Table 40: China UAE Aquaculture Market Revenue (Million) Forecast, by Application 2020 & 2033
- Table 41: India UAE Aquaculture Market Revenue (Million) Forecast, by Application 2020 & 2033
- Table 42: Japan UAE Aquaculture Market Revenue (Million) Forecast, by Application 2020 & 2033
- Table 43: South Korea UAE Aquaculture Market Revenue (Million) Forecast, by Application 2020 & 2033
- Table 44: ASEAN UAE Aquaculture Market Revenue (Million) Forecast, by Application 2020 & 2033
- Table 45: Oceania UAE Aquaculture Market Revenue (Million) Forecast, by Application 2020 & 2033
- Table 46: Rest of Asia Pacific UAE Aquaculture Market Revenue (Million) Forecast, by Application 2020 & 2033
Frequently Asked Questions
1. What is the projected Compound Annual Growth Rate (CAGR) of the UAE Aquaculture Market?
The projected CAGR is approximately 5.10%.
2. Which companies are prominent players in the UAE Aquaculture Market?
Key companies in the market include Prime Aquaculture FZE , Marine Farm Ltd., Emirates National Aquaculture LLC.
3. What are the main segments of the UAE Aquaculture Market?
The market segments include Type (Pr, Type (Pr.
4. Can you provide details about the market size?
The market size is estimated to be USD 21.82 Million as of 2022.
5. What are some drivers contributing to market growth?
Rising Consumption of Cashew Nuts in the Country; Favorable Government Initiatives.
6. What are the notable trends driving market growth?
Growing Demand for Fish and Seafood Products.
7. Are there any restraints impacting market growth?
Hazardous Climatic Condition Hinders Cashew Production; Stringent Regulations Related to Food Quality Standards.
8. Can you provide examples of recent developments in the market?
July 2022: The UAE Ministry of Climate Change and Environment partnered with Abu Dhabi National Oil company and Emirates National Oil company to provide subsidies to the fisherman to cope with the increasing cost and to boost the fisheries sector.
9. What pricing options are available for accessing the report?
Pricing options include single-user, multi-user, and enterprise licenses priced at USD 3800, USD 4500, and USD 5800 respectively.
10. Is the market size provided in terms of value or volume?
The market size is provided in terms of value, measured in Million.
11. Are there any specific market keywords associated with the report?
Yes, the market keyword associated with the report is "UAE Aquaculture Market," which aids in identifying and referencing the specific market segment covered.
12. How do I determine which pricing option suits my needs best?
The pricing options vary based on user requirements and access needs. Individual users may opt for single-user licenses, while businesses requiring broader access may choose multi-user or enterprise licenses for cost-effective access to the report.
13. Are there any additional resources or data provided in the UAE Aquaculture Market report?
While the report offers comprehensive insights, it's advisable to review the specific contents or supplementary materials provided to ascertain if additional resources or data are available.
14. How can I stay updated on further developments or reports in the UAE Aquaculture Market?
To stay informed about further developments, trends, and reports in the UAE Aquaculture Market, consider subscribing to industry newsletters, following relevant companies and organizations, or regularly checking reputable industry news sources and publications.
Methodology
Step 1 - Identification of Relevant Samples Size from Population Database


Step 2 - Approaches for Defining Global Market Size (Value, Volume* & Price*)

Note*: In applicable scenarios
Step 3 - Data Sources
Primary Research
- Web Analytics
- Survey Reports
- Research Institute
- Latest Research Reports
- Opinion Leaders
Secondary Research
- Annual Reports
- White Paper
- Latest Press Release
- Industry Association
- Paid Database
- Investor Presentations

Step 4 - Data Triangulation
Involves using different sources of information in order to increase the validity of a study
These sources are likely to be stakeholders in a program - participants, other researchers, program staff, other community members, and so on.
Then we put all data in single framework & apply various statistical tools to find out the dynamic on the market.
During the analysis stage, feedback from the stakeholder groups would be compared to determine areas of agreement as well as areas of divergence