

Key Insights
The US pet care and services industry is a robust and expanding market, projected to reach a significant size over the forecast period (2025-2033). The market's substantial growth is fueled by several key factors. Increasing pet ownership, particularly among millennials and Gen Z, is a primary driver. These demographics tend to view pets as family members, leading to higher spending on premium pet food, advanced grooming services, and specialized pet care. Furthermore, the rise in humanization of pets and increased awareness of pet health and wellness are contributing to market expansion. This translates into higher demand for veterinarian services, pet insurance, and specialized dietary pet foods. The segment featuring pet grooming, pet sitting, and boarding services is experiencing particularly strong growth, mirroring the busy lifestyles and increased mobility of pet owners. Competition within the industry is intense, with both large multinational corporations and smaller, specialized businesses vying for market share. The industry's competitive landscape reflects diversification in services offered, from basic necessities to highly specialized treatments and luxury goods.
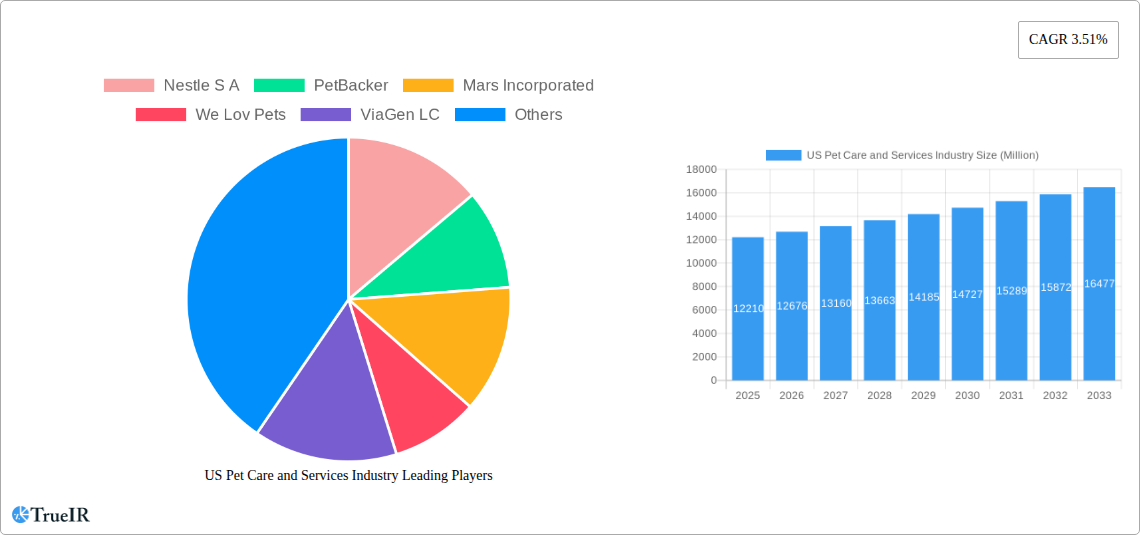
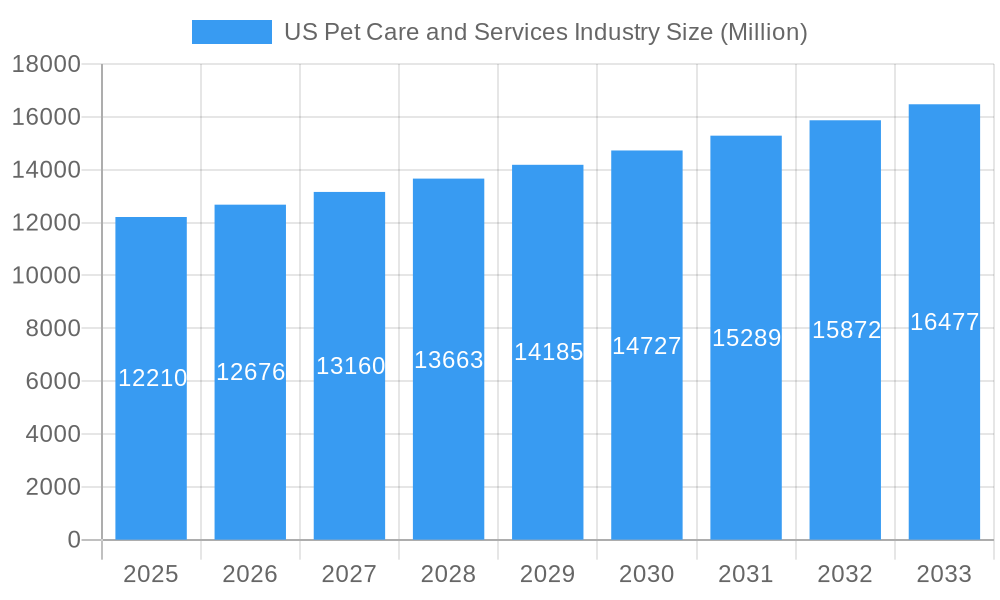
US Pet Care and Services Industry Market Size (In Billion)
The market's compound annual growth rate (CAGR) of 3.51% from 2019 to 2024 indicates consistent expansion. Projecting this growth forward, we can expect the market to show continued steady expansion throughout the forecast period. While economic downturns could potentially impact consumer spending on non-essential pet services, the strong emotional bond between pet owners and their animals suggests that core spending on pet food and essential veterinary care will remain relatively resilient. Geographic variations in market size and growth rates will likely persist, with more densely populated areas and regions with higher average household incomes potentially exhibiting faster growth. Understanding these regional nuances is crucial for businesses to effectively tailor their strategies and allocate resources. The ongoing trend towards premiumization—with owners increasingly willing to spend more on high-quality products and services for their pets—will continue to shape market dynamics in the coming years.
US Pet Care and Services Industry Company Market Share
US Pet Care and Services Industry Market Report: 2019-2033
This comprehensive report provides a detailed analysis of the US Pet Care and Services Industry, offering invaluable insights for investors, industry professionals, and stakeholders. With a study period spanning 2019-2033, a base year of 2025, and a forecast period of 2025-2033, this report leverages extensive market data to present a robust understanding of current trends and future projections. The US pet care market, valued at xx Million in 2024, is poised for significant growth, driven by increasing pet ownership and evolving consumer preferences.
US Pet Care and Services Industry Market Structure & Competitive Landscape
The US pet care market exhibits a moderately concentrated structure, with several large multinational corporations dominating the pet food and veterinary pharmaceutical segments. The concentration ratio (CR4) for pet food, for example, stands at approximately xx%, indicating significant market share held by the top four players. This high level of concentration is partly due to economies of scale, strong brand recognition, and extensive distribution networks. Key players such as Nestle S.A., Mars Incorporated, and Hill's Pet Nutrition Inc. leverage their global presence and extensive R&D capabilities to drive innovation and maintain market leadership.
However, the services sector displays a more fragmented landscape, with numerous small and medium-sized enterprises (SMEs) competing alongside larger national and regional players. This fragmentation provides opportunities for new entrants and acquisition targets.
Innovation Drivers: Key innovation drivers include the development of premium and specialized pet food catering to specific dietary needs and health conditions, the rise of technologically advanced pet care products (e.g., smart feeders, wearable trackers), and the increasing popularity of personalized pet services.
Regulatory Impacts: The regulatory environment, particularly concerning pet food labeling, safety standards, and animal welfare, significantly impacts industry operations. Compliance costs and evolving regulations contribute to the overall operating expenses for companies.
Product Substitutes: Substitutes for various pet care products exist (e.g., homemade pet food versus commercial brands). However, the convenience and quality control associated with commercial products often limit the appeal of substitutes.
End-User Segmentation: The market is segmented by pet type (dogs, cats, horses, and other animals), product type (pet food, grooming products, pet care accessories), and service type (grooming, pet transportation, boarding, sitting, walking).
M&A Trends: The industry witnesses significant merger and acquisition (M&A) activity. Over the historical period (2019-2024), an estimated xx Million deals were recorded, primarily focusing on consolidation within the pet food and veterinary services segments. The volume of M&A activity suggests the ongoing industry maturation and the pursuit of greater market share.
US Pet Care and Services Industry Market Trends & Opportunities
The US pet care market demonstrates robust growth, propelled by several key factors. The rising humanization of pets translates into increased spending on premium pet food, specialized healthcare services, and innovative products. Technological advancements, like telemedicine for pets and AI-powered pet monitoring devices, create new market opportunities. Shifting consumer preferences towards natural, organic, and ethically sourced pet products influence product development and branding strategies.
The compound annual growth rate (CAGR) for the overall US pet care market is projected to be xx% during the forecast period (2025-2033), driven primarily by the robust growth in the pet food segment (projected CAGR of xx%) and the steadily increasing demand for pet services (projected CAGR of xx%).
Market penetration rates for premium pet food are increasing, reflecting consumers' willingness to invest in high-quality products for their pets. Similarly, the penetration of pet insurance is rising steadily, driven by rising pet healthcare costs and increased awareness of pet insurance benefits. Competitive dynamics are characterized by the interplay between established industry giants, agile startups, and niche players specializing in specific pet types or services. The market exhibits healthy competition, encouraging innovation and driving overall value for consumers.
Dominant Markets & Segments in US Pet Care and Services Industry
By Pet Type:
- Dogs: Remains the dominant segment, driven by high pet ownership, strong consumer spending, and a wide array of available products and services.
- Cats: A significant segment, with increasing demand for premium cat food and specialized cat-related products.
- Horses: A niche segment but with a high average spend per pet.
- Other Animals: (birds, reptiles, small mammals) represent a growing, albeit smaller, market segment.
By Product Type:
- Pet Food: Dominates the market, accounting for xx Million in revenue in 2024, representing the largest revenue generator.
- Grooming Products: A growing segment fuelled by increasing consumer awareness of pet grooming and hygiene.
- Pet Care: Encompasses a vast range of products, including toys, bedding, accessories, and healthcare items.
By Service Type:
- Grooming: A high-growth area characterized by increasing consumer demand for professional grooming services.
- Pet Sitting/Walking: A rapidly expanding segment, driven by increasing pet ownership among working professionals and busy lifestyles.
- Pet Boarding: A crucial part of the market, offering solutions for pet owners during absences.
- Pet Transportation: Presents opportunities for specialized services, especially for long-distance travel.
Key growth drivers for these dominant segments include rising disposable incomes, changing lifestyles (increased pet ownership among urban dwellers), and heightened consumer awareness about pet health and well-being. Government regulations concerning animal welfare also play a role, driving innovation in the sector.
US Pet Care and Services Industry Product Analysis
Technological advancements are revolutionizing pet care products, leading to the creation of innovative solutions addressing specific needs. Smart feeders, GPS pet trackers, automated litter boxes, and telehealth platforms for pets are improving pet owner convenience and pet health management. The market increasingly focuses on functional and specialized pet foods catering to particular dietary needs (e.g., allergies, weight management). Competitive advantages are derived from superior product quality, innovative features, strong branding, and effective distribution networks. The market emphasizes natural, organic, and sustainable ingredients, enhancing product appeal and reflecting consumer preferences.
Key Drivers, Barriers & Challenges in US Pet Care and Services Industry
Key Drivers:
- Rising pet ownership rates.
- Increased humanization of pets leading to higher spending on premium products and services.
- Technological advancements resulting in innovative products and services.
- Growing consumer awareness of pet health and well-being.
Key Challenges:
- Intense competition among established players and new entrants.
- Supply chain disruptions impacting ingredient availability and product distribution.
- Fluctuating raw material prices increasing production costs.
- Regulatory complexities and compliance requirements. Examples include stringent labelling regulations for pet food and licensing requirements for pet care services.
Growth Drivers in the US Pet Care and Services Industry Market
The market's growth is fueled by several factors: the increasing humanization of pets leading to higher spending; technological innovation, such as smart feeders and wearable pet trackers; rising consumer awareness regarding pet health and wellness; the emergence of specialized pet care services tailored to specific breeds or needs; and the expansion of online pet supply platforms and services.
Challenges Impacting US Pet Care and Services Industry Growth
The industry faces hurdles such as intense competition, the complexities of navigating shifting regulations (especially concerning pet food labeling and animal welfare), and potential supply chain disruptions impacting the availability of key raw materials. These factors exert considerable pressure on profitability and operational efficiency.
Key Players Shaping the US Pet Care and Services Industry Market
- Nestle S.A.
- PetBacker
- Mars Incorporated
- We Lov Pets
- ViaGen LC
- Petmate
- Tail Blazers
- PetSmart LLC
- Hill's Pet Nutrition Inc
- Rover Inc
Significant US Pet Care and Services Industry Milestones
- February 2023: Bark&Spark launched a new probiotic chew for dogs, signifying innovation within the pet supplement market. This expands the market for functional pet food and emphasizes the increasing consumer demand for health-conscious pet products.
- January 2023: Village Pet Care launched, backed by significant investment, indicating a trend towards consolidation and expansion within the pet services sector. This move reflects the growth potential of centralized pet care platforms and the demand for broader service offerings.
Future Outlook for US Pet Care and Services Industry Market
The US pet care market is poised for continued robust growth, driven by several factors. The increasing humanization of pets will fuel spending on premium products and personalized services. Technological advancements will continue to shape the industry, fostering innovation and creating new market opportunities. The expansion of e-commerce channels and the increasing adoption of pet insurance will further drive growth. The market will witness continued consolidation, with larger players acquiring smaller companies to expand their market share and service offerings. Overall, the industry's future outlook is exceptionally promising, with considerable potential for growth and innovation.
US Pet Care and Services Industry Segmentation
-
1. Pet Type
- 1.1. Cat
- 1.2. Dog
- 1.3. Horse
- 1.4. Other Animals
-
2. Product Type
- 2.1. Pet Food
- 2.2. Grooming Products
- 2.3. Pet Care
-
3. Service Type
- 3.1. Grooming
- 3.2. Pet Transportation
- 3.3. Pet Boarding
- 3.4. Pet Sitting
- 3.5. Pet Walking
- 3.6. Other Services
US Pet Care and Services Industry Segmentation By Geography
-
1. North America
- 1.1. United States
- 1.2. Canada
- 1.3. Mexico
-
2. South America
- 2.1. Brazil
- 2.2. Argentina
- 2.3. Rest of South America
-
3. Europe
- 3.1. United Kingdom
- 3.2. Germany
- 3.3. France
- 3.4. Italy
- 3.5. Spain
- 3.6. Russia
- 3.7. Benelux
- 3.8. Nordics
- 3.9. Rest of Europe
-
4. Middle East & Africa
- 4.1. Turkey
- 4.2. Israel
- 4.3. GCC
- 4.4. North Africa
- 4.5. South Africa
- 4.6. Rest of Middle East & Africa
-
5. Asia Pacific
- 5.1. China
- 5.2. India
- 5.3. Japan
- 5.4. South Korea
- 5.5. ASEAN
- 5.6. Oceania
- 5.7. Rest of Asia Pacific
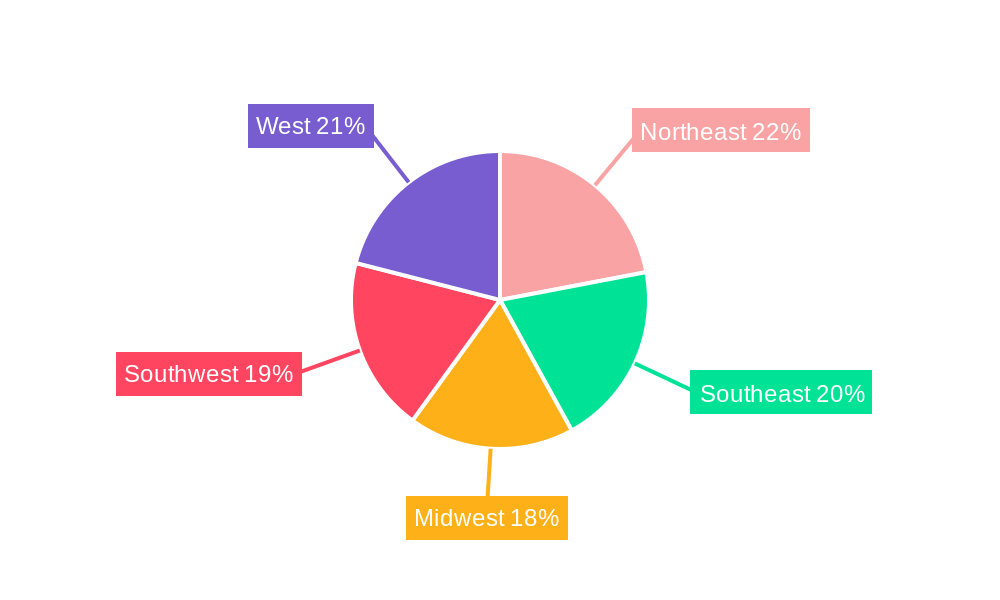
US Pet Care and Services Industry Regional Market Share
Geographic Coverage of US Pet Care and Services Industry
US Pet Care and Services Industry REPORT HIGHLIGHTS
| Aspects | Details |
|---|---|
| Study Period | 2020-2034 |
| Base Year | 2025 |
| Estimated Year | 2026 |
| Forecast Period | 2026-2034 |
| Historical Period | 2020-2025 |
| Growth Rate | CAGR of 3.51% from 2020-2034 |
| Segmentation |
|
Table of Contents
- 1. Introduction
- 1.1. Research Scope
- 1.2. Market Segmentation
- 1.3. Research Objective
- 1.4. Definitions and Assumptions
- 2. Executive Summary
- 2.1. Market Snapshot
- 3. Market Dynamics
- 3.1. Market Drivers
- 3.2. Market Restrains
- 3.3. Market Trends
- 3.4. Market Opportunities
- 4. Market Factor Analysis
- 4.1. Porters Five Forces
- 4.1.1. Bargaining Power of Suppliers
- 4.1.2. Bargaining Power of Buyers
- 4.1.3. Threat of New Entrants
- 4.1.4. Threat of Substitutes
- 4.1.5. Competitive Rivalry
- 4.2. PESTEL analysis
- 4.3. BCG Analysis
- 4.3.1. Stars (High Growth, High Market Share)
- 4.3.2. Cash Cows (Low Growth, High Market Share)
- 4.3.3. Question Mark (High Growth, Low Market Share)
- 4.3.4. Dogs (Low Growth, Low Market Share)
- 4.4. Ansoff Matrix Analysis
- 4.5. Supply Chain Analysis
- 4.6. Regulatory Landscape
- 4.7. Current Market Potential and Opportunity Assessment (TAM–SAM–SOM Framework)
- 4.8. TIR Analyst Note
- 4.1. Porters Five Forces
- 5. Market Analysis, Insights and Forecast 2021-2033
- 5.1. Market Analysis, Insights and Forecast - by Pet Type
- 5.1.1. Cat
- 5.1.2. Dog
- 5.1.3. Horse
- 5.1.4. Other Animals
- 5.2. Market Analysis, Insights and Forecast - by Product Type
- 5.2.1. Pet Food
- 5.2.2. Grooming Products
- 5.2.3. Pet Care
- 5.3. Market Analysis, Insights and Forecast - by Service Type
- 5.3.1. Grooming
- 5.3.2. Pet Transportation
- 5.3.3. Pet Boarding
- 5.3.4. Pet Sitting
- 5.3.5. Pet Walking
- 5.3.6. Other Services
- 5.4. Market Analysis, Insights and Forecast - by Region
- 5.4.1. North America
- 5.4.2. South America
- 5.4.3. Europe
- 5.4.4. Middle East & Africa
- 5.4.5. Asia Pacific
- 5.1. Market Analysis, Insights and Forecast - by Pet Type
- 6. Global US Pet Care and Services Industry Analysis, Insights and Forecast, 2021-2033
- 6.1. Market Analysis, Insights and Forecast - by Pet Type
- 6.1.1. Cat
- 6.1.2. Dog
- 6.1.3. Horse
- 6.1.4. Other Animals
- 6.2. Market Analysis, Insights and Forecast - by Product Type
- 6.2.1. Pet Food
- 6.2.2. Grooming Products
- 6.2.3. Pet Care
- 6.3. Market Analysis, Insights and Forecast - by Service Type
- 6.3.1. Grooming
- 6.3.2. Pet Transportation
- 6.3.3. Pet Boarding
- 6.3.4. Pet Sitting
- 6.3.5. Pet Walking
- 6.3.6. Other Services
- 6.1. Market Analysis, Insights and Forecast - by Pet Type
- 7. North America US Pet Care and Services Industry Analysis, Insights and Forecast, 2020-2032
- 7.1. Market Analysis, Insights and Forecast - by Pet Type
- 7.1.1. Cat
- 7.1.2. Dog
- 7.1.3. Horse
- 7.1.4. Other Animals
- 7.2. Market Analysis, Insights and Forecast - by Product Type
- 7.2.1. Pet Food
- 7.2.2. Grooming Products
- 7.2.3. Pet Care
- 7.3. Market Analysis, Insights and Forecast - by Service Type
- 7.3.1. Grooming
- 7.3.2. Pet Transportation
- 7.3.3. Pet Boarding
- 7.3.4. Pet Sitting
- 7.3.5. Pet Walking
- 7.3.6. Other Services
- 7.1. Market Analysis, Insights and Forecast - by Pet Type
- 8. South America US Pet Care and Services Industry Analysis, Insights and Forecast, 2020-2032
- 8.1. Market Analysis, Insights and Forecast - by Pet Type
- 8.1.1. Cat
- 8.1.2. Dog
- 8.1.3. Horse
- 8.1.4. Other Animals
- 8.2. Market Analysis, Insights and Forecast - by Product Type
- 8.2.1. Pet Food
- 8.2.2. Grooming Products
- 8.2.3. Pet Care
- 8.3. Market Analysis, Insights and Forecast - by Service Type
- 8.3.1. Grooming
- 8.3.2. Pet Transportation
- 8.3.3. Pet Boarding
- 8.3.4. Pet Sitting
- 8.3.5. Pet Walking
- 8.3.6. Other Services
- 8.1. Market Analysis, Insights and Forecast - by Pet Type
- 9. Europe US Pet Care and Services Industry Analysis, Insights and Forecast, 2020-2032
- 9.1. Market Analysis, Insights and Forecast - by Pet Type
- 9.1.1. Cat
- 9.1.2. Dog
- 9.1.3. Horse
- 9.1.4. Other Animals
- 9.2. Market Analysis, Insights and Forecast - by Product Type
- 9.2.1. Pet Food
- 9.2.2. Grooming Products
- 9.2.3. Pet Care
- 9.3. Market Analysis, Insights and Forecast - by Service Type
- 9.3.1. Grooming
- 9.3.2. Pet Transportation
- 9.3.3. Pet Boarding
- 9.3.4. Pet Sitting
- 9.3.5. Pet Walking
- 9.3.6. Other Services
- 9.1. Market Analysis, Insights and Forecast - by Pet Type
- 10. Middle East & Africa US Pet Care and Services Industry Analysis, Insights and Forecast, 2020-2032
- 10.1. Market Analysis, Insights and Forecast - by Pet Type
- 10.1.1. Cat
- 10.1.2. Dog
- 10.1.3. Horse
- 10.1.4. Other Animals
- 10.2. Market Analysis, Insights and Forecast - by Product Type
- 10.2.1. Pet Food
- 10.2.2. Grooming Products
- 10.2.3. Pet Care
- 10.3. Market Analysis, Insights and Forecast - by Service Type
- 10.3.1. Grooming
- 10.3.2. Pet Transportation
- 10.3.3. Pet Boarding
- 10.3.4. Pet Sitting
- 10.3.5. Pet Walking
- 10.3.6. Other Services
- 10.1. Market Analysis, Insights and Forecast - by Pet Type
- 11. Asia Pacific US Pet Care and Services Industry Analysis, Insights and Forecast, 2020-2032
- 11.1. Market Analysis, Insights and Forecast - by Pet Type
- 11.1.1. Cat
- 11.1.2. Dog
- 11.1.3. Horse
- 11.1.4. Other Animals
- 11.2. Market Analysis, Insights and Forecast - by Product Type
- 11.2.1. Pet Food
- 11.2.2. Grooming Products
- 11.2.3. Pet Care
- 11.3. Market Analysis, Insights and Forecast - by Service Type
- 11.3.1. Grooming
- 11.3.2. Pet Transportation
- 11.3.3. Pet Boarding
- 11.3.4. Pet Sitting
- 11.3.5. Pet Walking
- 11.3.6. Other Services
- 11.1. Market Analysis, Insights and Forecast - by Pet Type
- 12. Competitive Analysis
- 12.1. Company Profiles
- 12.1.1 Nestle S A
- 12.1.1.1. Company Overview
- 12.1.1.2. Products
- 12.1.1.3. Company Financials
- 12.1.1.4. SWOT Analysis
- 12.1.2 PetBacker
- 12.1.2.1. Company Overview
- 12.1.2.2. Products
- 12.1.2.3. Company Financials
- 12.1.2.4. SWOT Analysis
- 12.1.3 Mars Incorporated
- 12.1.3.1. Company Overview
- 12.1.3.2. Products
- 12.1.3.3. Company Financials
- 12.1.3.4. SWOT Analysis
- 12.1.4 We Lov Pets
- 12.1.4.1. Company Overview
- 12.1.4.2. Products
- 12.1.4.3. Company Financials
- 12.1.4.4. SWOT Analysis
- 12.1.5 ViaGen LC
- 12.1.5.1. Company Overview
- 12.1.5.2. Products
- 12.1.5.3. Company Financials
- 12.1.5.4. SWOT Analysis
- 12.1.6 Petmate
- 12.1.6.1. Company Overview
- 12.1.6.2. Products
- 12.1.6.3. Company Financials
- 12.1.6.4. SWOT Analysis
- 12.1.7 Tail Blazers
- 12.1.7.1. Company Overview
- 12.1.7.2. Products
- 12.1.7.3. Company Financials
- 12.1.7.4. SWOT Analysis
- 12.1.8 PetSmart LLC
- 12.1.8.1. Company Overview
- 12.1.8.2. Products
- 12.1.8.3. Company Financials
- 12.1.8.4. SWOT Analysis
- 12.1.9 Hill's Pet Nutrition Inc
- 12.1.9.1. Company Overview
- 12.1.9.2. Products
- 12.1.9.3. Company Financials
- 12.1.9.4. SWOT Analysis
- 12.1.10 Rover Inc
- 12.1.10.1. Company Overview
- 12.1.10.2. Products
- 12.1.10.3. Company Financials
- 12.1.10.4. SWOT Analysis
- 12.1.1 Nestle S A
- 12.2. Market Entropy
- 12.2.1 Company's Key Areas Served
- 12.2.2 Recent Developments
- 12.3. Company Market Share Analysis 2025
- 12.3.1 Top 5 Companies Market Share Analysis
- 12.3.2 Top 3 Companies Market Share Analysis
- 12.4. List of Potential Customers
- 13. Research Methodology
List of Figures
- Figure 1: Global US Pet Care and Services Industry Revenue Breakdown (Million, %) by Region 2025 & 2033
- Figure 2: Global US Pet Care and Services Industry Volume Breakdown (K Unit, %) by Region 2025 & 2033
- Figure 3: North America US Pet Care and Services Industry Revenue (Million), by Pet Type 2025 & 2033
- Figure 4: North America US Pet Care and Services Industry Volume (K Unit), by Pet Type 2025 & 2033
- Figure 5: North America US Pet Care and Services Industry Revenue Share (%), by Pet Type 2025 & 2033
- Figure 6: North America US Pet Care and Services Industry Volume Share (%), by Pet Type 2025 & 2033
- Figure 7: North America US Pet Care and Services Industry Revenue (Million), by Product Type 2025 & 2033
- Figure 8: North America US Pet Care and Services Industry Volume (K Unit), by Product Type 2025 & 2033
- Figure 9: North America US Pet Care and Services Industry Revenue Share (%), by Product Type 2025 & 2033
- Figure 10: North America US Pet Care and Services Industry Volume Share (%), by Product Type 2025 & 2033
- Figure 11: North America US Pet Care and Services Industry Revenue (Million), by Service Type 2025 & 2033
- Figure 12: North America US Pet Care and Services Industry Volume (K Unit), by Service Type 2025 & 2033
- Figure 13: North America US Pet Care and Services Industry Revenue Share (%), by Service Type 2025 & 2033
- Figure 14: North America US Pet Care and Services Industry Volume Share (%), by Service Type 2025 & 2033
- Figure 15: North America US Pet Care and Services Industry Revenue (Million), by Country 2025 & 2033
- Figure 16: North America US Pet Care and Services Industry Volume (K Unit), by Country 2025 & 2033
- Figure 17: North America US Pet Care and Services Industry Revenue Share (%), by Country 2025 & 2033
- Figure 18: North America US Pet Care and Services Industry Volume Share (%), by Country 2025 & 2033
- Figure 19: South America US Pet Care and Services Industry Revenue (Million), by Pet Type 2025 & 2033
- Figure 20: South America US Pet Care and Services Industry Volume (K Unit), by Pet Type 2025 & 2033
- Figure 21: South America US Pet Care and Services Industry Revenue Share (%), by Pet Type 2025 & 2033
- Figure 22: South America US Pet Care and Services Industry Volume Share (%), by Pet Type 2025 & 2033
- Figure 23: South America US Pet Care and Services Industry Revenue (Million), by Product Type 2025 & 2033
- Figure 24: South America US Pet Care and Services Industry Volume (K Unit), by Product Type 2025 & 2033
- Figure 25: South America US Pet Care and Services Industry Revenue Share (%), by Product Type 2025 & 2033
- Figure 26: South America US Pet Care and Services Industry Volume Share (%), by Product Type 2025 & 2033
- Figure 27: South America US Pet Care and Services Industry Revenue (Million), by Service Type 2025 & 2033
- Figure 28: South America US Pet Care and Services Industry Volume (K Unit), by Service Type 2025 & 2033
- Figure 29: South America US Pet Care and Services Industry Revenue Share (%), by Service Type 2025 & 2033
- Figure 30: South America US Pet Care and Services Industry Volume Share (%), by Service Type 2025 & 2033
- Figure 31: South America US Pet Care and Services Industry Revenue (Million), by Country 2025 & 2033
- Figure 32: South America US Pet Care and Services Industry Volume (K Unit), by Country 2025 & 2033
- Figure 33: South America US Pet Care and Services Industry Revenue Share (%), by Country 2025 & 2033
- Figure 34: South America US Pet Care and Services Industry Volume Share (%), by Country 2025 & 2033
- Figure 35: Europe US Pet Care and Services Industry Revenue (Million), by Pet Type 2025 & 2033
- Figure 36: Europe US Pet Care and Services Industry Volume (K Unit), by Pet Type 2025 & 2033
- Figure 37: Europe US Pet Care and Services Industry Revenue Share (%), by Pet Type 2025 & 2033
- Figure 38: Europe US Pet Care and Services Industry Volume Share (%), by Pet Type 2025 & 2033
- Figure 39: Europe US Pet Care and Services Industry Revenue (Million), by Product Type 2025 & 2033
- Figure 40: Europe US Pet Care and Services Industry Volume (K Unit), by Product Type 2025 & 2033
- Figure 41: Europe US Pet Care and Services Industry Revenue Share (%), by Product Type 2025 & 2033
- Figure 42: Europe US Pet Care and Services Industry Volume Share (%), by Product Type 2025 & 2033
- Figure 43: Europe US Pet Care and Services Industry Revenue (Million), by Service Type 2025 & 2033
- Figure 44: Europe US Pet Care and Services Industry Volume (K Unit), by Service Type 2025 & 2033
- Figure 45: Europe US Pet Care and Services Industry Revenue Share (%), by Service Type 2025 & 2033
- Figure 46: Europe US Pet Care and Services Industry Volume Share (%), by Service Type 2025 & 2033
- Figure 47: Europe US Pet Care and Services Industry Revenue (Million), by Country 2025 & 2033
- Figure 48: Europe US Pet Care and Services Industry Volume (K Unit), by Country 2025 & 2033
- Figure 49: Europe US Pet Care and Services Industry Revenue Share (%), by Country 2025 & 2033
- Figure 50: Europe US Pet Care and Services Industry Volume Share (%), by Country 2025 & 2033
- Figure 51: Middle East & Africa US Pet Care and Services Industry Revenue (Million), by Pet Type 2025 & 2033
- Figure 52: Middle East & Africa US Pet Care and Services Industry Volume (K Unit), by Pet Type 2025 & 2033
- Figure 53: Middle East & Africa US Pet Care and Services Industry Revenue Share (%), by Pet Type 2025 & 2033
- Figure 54: Middle East & Africa US Pet Care and Services Industry Volume Share (%), by Pet Type 2025 & 2033
- Figure 55: Middle East & Africa US Pet Care and Services Industry Revenue (Million), by Product Type 2025 & 2033
- Figure 56: Middle East & Africa US Pet Care and Services Industry Volume (K Unit), by Product Type 2025 & 2033
- Figure 57: Middle East & Africa US Pet Care and Services Industry Revenue Share (%), by Product Type 2025 & 2033
- Figure 58: Middle East & Africa US Pet Care and Services Industry Volume Share (%), by Product Type 2025 & 2033
- Figure 59: Middle East & Africa US Pet Care and Services Industry Revenue (Million), by Service Type 2025 & 2033
- Figure 60: Middle East & Africa US Pet Care and Services Industry Volume (K Unit), by Service Type 2025 & 2033
- Figure 61: Middle East & Africa US Pet Care and Services Industry Revenue Share (%), by Service Type 2025 & 2033
- Figure 62: Middle East & Africa US Pet Care and Services Industry Volume Share (%), by Service Type 2025 & 2033
- Figure 63: Middle East & Africa US Pet Care and Services Industry Revenue (Million), by Country 2025 & 2033
- Figure 64: Middle East & Africa US Pet Care and Services Industry Volume (K Unit), by Country 2025 & 2033
- Figure 65: Middle East & Africa US Pet Care and Services Industry Revenue Share (%), by Country 2025 & 2033
- Figure 66: Middle East & Africa US Pet Care and Services Industry Volume Share (%), by Country 2025 & 2033
- Figure 67: Asia Pacific US Pet Care and Services Industry Revenue (Million), by Pet Type 2025 & 2033
- Figure 68: Asia Pacific US Pet Care and Services Industry Volume (K Unit), by Pet Type 2025 & 2033
- Figure 69: Asia Pacific US Pet Care and Services Industry Revenue Share (%), by Pet Type 2025 & 2033
- Figure 70: Asia Pacific US Pet Care and Services Industry Volume Share (%), by Pet Type 2025 & 2033
- Figure 71: Asia Pacific US Pet Care and Services Industry Revenue (Million), by Product Type 2025 & 2033
- Figure 72: Asia Pacific US Pet Care and Services Industry Volume (K Unit), by Product Type 2025 & 2033
- Figure 73: Asia Pacific US Pet Care and Services Industry Revenue Share (%), by Product Type 2025 & 2033
- Figure 74: Asia Pacific US Pet Care and Services Industry Volume Share (%), by Product Type 2025 & 2033
- Figure 75: Asia Pacific US Pet Care and Services Industry Revenue (Million), by Service Type 2025 & 2033
- Figure 76: Asia Pacific US Pet Care and Services Industry Volume (K Unit), by Service Type 2025 & 2033
- Figure 77: Asia Pacific US Pet Care and Services Industry Revenue Share (%), by Service Type 2025 & 2033
- Figure 78: Asia Pacific US Pet Care and Services Industry Volume Share (%), by Service Type 2025 & 2033
- Figure 79: Asia Pacific US Pet Care and Services Industry Revenue (Million), by Country 2025 & 2033
- Figure 80: Asia Pacific US Pet Care and Services Industry Volume (K Unit), by Country 2025 & 2033
- Figure 81: Asia Pacific US Pet Care and Services Industry Revenue Share (%), by Country 2025 & 2033
- Figure 82: Asia Pacific US Pet Care and Services Industry Volume Share (%), by Country 2025 & 2033
List of Tables
- Table 1: Global US Pet Care and Services Industry Revenue Million Forecast, by Pet Type 2020 & 2033
- Table 2: Global US Pet Care and Services Industry Volume K Unit Forecast, by Pet Type 2020 & 2033
- Table 3: Global US Pet Care and Services Industry Revenue Million Forecast, by Product Type 2020 & 2033
- Table 4: Global US Pet Care and Services Industry Volume K Unit Forecast, by Product Type 2020 & 2033
- Table 5: Global US Pet Care and Services Industry Revenue Million Forecast, by Service Type 2020 & 2033
- Table 6: Global US Pet Care and Services Industry Volume K Unit Forecast, by Service Type 2020 & 2033
- Table 7: Global US Pet Care and Services Industry Revenue Million Forecast, by Region 2020 & 2033
- Table 8: Global US Pet Care and Services Industry Volume K Unit Forecast, by Region 2020 & 2033
- Table 9: Global US Pet Care and Services Industry Revenue Million Forecast, by Pet Type 2020 & 2033
- Table 10: Global US Pet Care and Services Industry Volume K Unit Forecast, by Pet Type 2020 & 2033
- Table 11: Global US Pet Care and Services Industry Revenue Million Forecast, by Product Type 2020 & 2033
- Table 12: Global US Pet Care and Services Industry Volume K Unit Forecast, by Product Type 2020 & 2033
- Table 13: Global US Pet Care and Services Industry Revenue Million Forecast, by Service Type 2020 & 2033
- Table 14: Global US Pet Care and Services Industry Volume K Unit Forecast, by Service Type 2020 & 2033
- Table 15: Global US Pet Care and Services Industry Revenue Million Forecast, by Country 2020 & 2033
- Table 16: Global US Pet Care and Services Industry Volume K Unit Forecast, by Country 2020 & 2033
- Table 17: United States US Pet Care and Services Industry Revenue (Million) Forecast, by Application 2020 & 2033
- Table 18: United States US Pet Care and Services Industry Volume (K Unit) Forecast, by Application 2020 & 2033
- Table 19: Canada US Pet Care and Services Industry Revenue (Million) Forecast, by Application 2020 & 2033
- Table 20: Canada US Pet Care and Services Industry Volume (K Unit) Forecast, by Application 2020 & 2033
- Table 21: Mexico US Pet Care and Services Industry Revenue (Million) Forecast, by Application 2020 & 2033
- Table 22: Mexico US Pet Care and Services Industry Volume (K Unit) Forecast, by Application 2020 & 2033
- Table 23: Global US Pet Care and Services Industry Revenue Million Forecast, by Pet Type 2020 & 2033
- Table 24: Global US Pet Care and Services Industry Volume K Unit Forecast, by Pet Type 2020 & 2033
- Table 25: Global US Pet Care and Services Industry Revenue Million Forecast, by Product Type 2020 & 2033
- Table 26: Global US Pet Care and Services Industry Volume K Unit Forecast, by Product Type 2020 & 2033
- Table 27: Global US Pet Care and Services Industry Revenue Million Forecast, by Service Type 2020 & 2033
- Table 28: Global US Pet Care and Services Industry Volume K Unit Forecast, by Service Type 2020 & 2033
- Table 29: Global US Pet Care and Services Industry Revenue Million Forecast, by Country 2020 & 2033
- Table 30: Global US Pet Care and Services Industry Volume K Unit Forecast, by Country 2020 & 2033
- Table 31: Brazil US Pet Care and Services Industry Revenue (Million) Forecast, by Application 2020 & 2033
- Table 32: Brazil US Pet Care and Services Industry Volume (K Unit) Forecast, by Application 2020 & 2033
- Table 33: Argentina US Pet Care and Services Industry Revenue (Million) Forecast, by Application 2020 & 2033
- Table 34: Argentina US Pet Care and Services Industry Volume (K Unit) Forecast, by Application 2020 & 2033
- Table 35: Rest of South America US Pet Care and Services Industry Revenue (Million) Forecast, by Application 2020 & 2033
- Table 36: Rest of South America US Pet Care and Services Industry Volume (K Unit) Forecast, by Application 2020 & 2033
- Table 37: Global US Pet Care and Services Industry Revenue Million Forecast, by Pet Type 2020 & 2033
- Table 38: Global US Pet Care and Services Industry Volume K Unit Forecast, by Pet Type 2020 & 2033
- Table 39: Global US Pet Care and Services Industry Revenue Million Forecast, by Product Type 2020 & 2033
- Table 40: Global US Pet Care and Services Industry Volume K Unit Forecast, by Product Type 2020 & 2033
- Table 41: Global US Pet Care and Services Industry Revenue Million Forecast, by Service Type 2020 & 2033
- Table 42: Global US Pet Care and Services Industry Volume K Unit Forecast, by Service Type 2020 & 2033
- Table 43: Global US Pet Care and Services Industry Revenue Million Forecast, by Country 2020 & 2033
- Table 44: Global US Pet Care and Services Industry Volume K Unit Forecast, by Country 2020 & 2033
- Table 45: United Kingdom US Pet Care and Services Industry Revenue (Million) Forecast, by Application 2020 & 2033
- Table 46: United Kingdom US Pet Care and Services Industry Volume (K Unit) Forecast, by Application 2020 & 2033
- Table 47: Germany US Pet Care and Services Industry Revenue (Million) Forecast, by Application 2020 & 2033
- Table 48: Germany US Pet Care and Services Industry Volume (K Unit) Forecast, by Application 2020 & 2033
- Table 49: France US Pet Care and Services Industry Revenue (Million) Forecast, by Application 2020 & 2033
- Table 50: France US Pet Care and Services Industry Volume (K Unit) Forecast, by Application 2020 & 2033
- Table 51: Italy US Pet Care and Services Industry Revenue (Million) Forecast, by Application 2020 & 2033
- Table 52: Italy US Pet Care and Services Industry Volume (K Unit) Forecast, by Application 2020 & 2033
- Table 53: Spain US Pet Care and Services Industry Revenue (Million) Forecast, by Application 2020 & 2033
- Table 54: Spain US Pet Care and Services Industry Volume (K Unit) Forecast, by Application 2020 & 2033
- Table 55: Russia US Pet Care and Services Industry Revenue (Million) Forecast, by Application 2020 & 2033
- Table 56: Russia US Pet Care and Services Industry Volume (K Unit) Forecast, by Application 2020 & 2033
- Table 57: Benelux US Pet Care and Services Industry Revenue (Million) Forecast, by Application 2020 & 2033
- Table 58: Benelux US Pet Care and Services Industry Volume (K Unit) Forecast, by Application 2020 & 2033
- Table 59: Nordics US Pet Care and Services Industry Revenue (Million) Forecast, by Application 2020 & 2033
- Table 60: Nordics US Pet Care and Services Industry Volume (K Unit) Forecast, by Application 2020 & 2033
- Table 61: Rest of Europe US Pet Care and Services Industry Revenue (Million) Forecast, by Application 2020 & 2033
- Table 62: Rest of Europe US Pet Care and Services Industry Volume (K Unit) Forecast, by Application 2020 & 2033
- Table 63: Global US Pet Care and Services Industry Revenue Million Forecast, by Pet Type 2020 & 2033
- Table 64: Global US Pet Care and Services Industry Volume K Unit Forecast, by Pet Type 2020 & 2033
- Table 65: Global US Pet Care and Services Industry Revenue Million Forecast, by Product Type 2020 & 2033
- Table 66: Global US Pet Care and Services Industry Volume K Unit Forecast, by Product Type 2020 & 2033
- Table 67: Global US Pet Care and Services Industry Revenue Million Forecast, by Service Type 2020 & 2033
- Table 68: Global US Pet Care and Services Industry Volume K Unit Forecast, by Service Type 2020 & 2033
- Table 69: Global US Pet Care and Services Industry Revenue Million Forecast, by Country 2020 & 2033
- Table 70: Global US Pet Care and Services Industry Volume K Unit Forecast, by Country 2020 & 2033
- Table 71: Turkey US Pet Care and Services Industry Revenue (Million) Forecast, by Application 2020 & 2033
- Table 72: Turkey US Pet Care and Services Industry Volume (K Unit) Forecast, by Application 2020 & 2033
- Table 73: Israel US Pet Care and Services Industry Revenue (Million) Forecast, by Application 2020 & 2033
- Table 74: Israel US Pet Care and Services Industry Volume (K Unit) Forecast, by Application 2020 & 2033
- Table 75: GCC US Pet Care and Services Industry Revenue (Million) Forecast, by Application 2020 & 2033
- Table 76: GCC US Pet Care and Services Industry Volume (K Unit) Forecast, by Application 2020 & 2033
- Table 77: North Africa US Pet Care and Services Industry Revenue (Million) Forecast, by Application 2020 & 2033
- Table 78: North Africa US Pet Care and Services Industry Volume (K Unit) Forecast, by Application 2020 & 2033
- Table 79: South Africa US Pet Care and Services Industry Revenue (Million) Forecast, by Application 2020 & 2033
- Table 80: South Africa US Pet Care and Services Industry Volume (K Unit) Forecast, by Application 2020 & 2033
- Table 81: Rest of Middle East & Africa US Pet Care and Services Industry Revenue (Million) Forecast, by Application 2020 & 2033
- Table 82: Rest of Middle East & Africa US Pet Care and Services Industry Volume (K Unit) Forecast, by Application 2020 & 2033
- Table 83: Global US Pet Care and Services Industry Revenue Million Forecast, by Pet Type 2020 & 2033
- Table 84: Global US Pet Care and Services Industry Volume K Unit Forecast, by Pet Type 2020 & 2033
- Table 85: Global US Pet Care and Services Industry Revenue Million Forecast, by Product Type 2020 & 2033
- Table 86: Global US Pet Care and Services Industry Volume K Unit Forecast, by Product Type 2020 & 2033
- Table 87: Global US Pet Care and Services Industry Revenue Million Forecast, by Service Type 2020 & 2033
- Table 88: Global US Pet Care and Services Industry Volume K Unit Forecast, by Service Type 2020 & 2033
- Table 89: Global US Pet Care and Services Industry Revenue Million Forecast, by Country 2020 & 2033
- Table 90: Global US Pet Care and Services Industry Volume K Unit Forecast, by Country 2020 & 2033
- Table 91: China US Pet Care and Services Industry Revenue (Million) Forecast, by Application 2020 & 2033
- Table 92: China US Pet Care and Services Industry Volume (K Unit) Forecast, by Application 2020 & 2033
- Table 93: India US Pet Care and Services Industry Revenue (Million) Forecast, by Application 2020 & 2033
- Table 94: India US Pet Care and Services Industry Volume (K Unit) Forecast, by Application 2020 & 2033
- Table 95: Japan US Pet Care and Services Industry Revenue (Million) Forecast, by Application 2020 & 2033
- Table 96: Japan US Pet Care and Services Industry Volume (K Unit) Forecast, by Application 2020 & 2033
- Table 97: South Korea US Pet Care and Services Industry Revenue (Million) Forecast, by Application 2020 & 2033
- Table 98: South Korea US Pet Care and Services Industry Volume (K Unit) Forecast, by Application 2020 & 2033
- Table 99: ASEAN US Pet Care and Services Industry Revenue (Million) Forecast, by Application 2020 & 2033
- Table 100: ASEAN US Pet Care and Services Industry Volume (K Unit) Forecast, by Application 2020 & 2033
- Table 101: Oceania US Pet Care and Services Industry Revenue (Million) Forecast, by Application 2020 & 2033
- Table 102: Oceania US Pet Care and Services Industry Volume (K Unit) Forecast, by Application 2020 & 2033
- Table 103: Rest of Asia Pacific US Pet Care and Services Industry Revenue (Million) Forecast, by Application 2020 & 2033
- Table 104: Rest of Asia Pacific US Pet Care and Services Industry Volume (K Unit) Forecast, by Application 2020 & 2033
Frequently Asked Questions
1. What is the projected Compound Annual Growth Rate (CAGR) of the US Pet Care and Services Industry?
The projected CAGR is approximately 3.51%.
2. Which companies are prominent players in the US Pet Care and Services Industry?
Key companies in the market include Nestle S A, PetBacker, Mars Incorporated, We Lov Pets, ViaGen LC, Petmate, Tail Blazers, PetSmart LLC, Hill's Pet Nutrition Inc, Rover Inc.
3. What are the main segments of the US Pet Care and Services Industry?
The market segments include Pet Type , Product Type, Service Type.
4. Can you provide details about the market size?
The market size is estimated to be USD 12.21 Million as of 2022.
5. What are some drivers contributing to market growth?
Rising Pet Ownership and Pet Insurance; Increased Adoption of Technology for Pet Care.
6. What are the notable trends driving market growth?
Dog Segment is Expected to Account for the Large Market Share Over the Forecast Period.
7. Are there any restraints impacting market growth?
High Cost of Products and Services.
8. Can you provide examples of recent developments in the market?
February 2023: Bark&Spark released a new Probiotic Chew for Dogs. Bark&Spark's chews are touted as perfectly dosed and compatible with any dog's diet, with just a few chews a day giving the desired effects.
9. What pricing options are available for accessing the report?
Pricing options include single-user, multi-user, and enterprise licenses priced at USD 3800, USD 4500, and USD 5800 respectively.
10. Is the market size provided in terms of value or volume?
The market size is provided in terms of value, measured in Million and volume, measured in K Unit.
11. Are there any specific market keywords associated with the report?
Yes, the market keyword associated with the report is "US Pet Care and Services Industry," which aids in identifying and referencing the specific market segment covered.
12. How do I determine which pricing option suits my needs best?
The pricing options vary based on user requirements and access needs. Individual users may opt for single-user licenses, while businesses requiring broader access may choose multi-user or enterprise licenses for cost-effective access to the report.
13. Are there any additional resources or data provided in the US Pet Care and Services Industry report?
While the report offers comprehensive insights, it's advisable to review the specific contents or supplementary materials provided to ascertain if additional resources or data are available.
14. How can I stay updated on further developments or reports in the US Pet Care and Services Industry?
To stay informed about further developments, trends, and reports in the US Pet Care and Services Industry, consider subscribing to industry newsletters, following relevant companies and organizations, or regularly checking reputable industry news sources and publications.
Methodology
Step 1 - Identification of Relevant Samples Size from Population Database


Step 2 - Approaches for Defining Global Market Size (Value, Volume* & Price*)

Note*: In applicable scenarios
Step 3 - Data Sources
Primary Research
- Web Analytics
- Survey Reports
- Research Institute
- Latest Research Reports
- Opinion Leaders
Secondary Research
- Annual Reports
- White Paper
- Latest Press Release
- Industry Association
- Paid Database
- Investor Presentations

Step 4 - Data Triangulation
Involves using different sources of information in order to increase the validity of a study
These sources are likely to be stakeholders in a program - participants, other researchers, program staff, other community members, and so on.
Then we put all data in single framework & apply various statistical tools to find out the dynamic on the market.
During the analysis stage, feedback from the stakeholder groups would be compared to determine areas of agreement as well as areas of divergence