

Key Insights
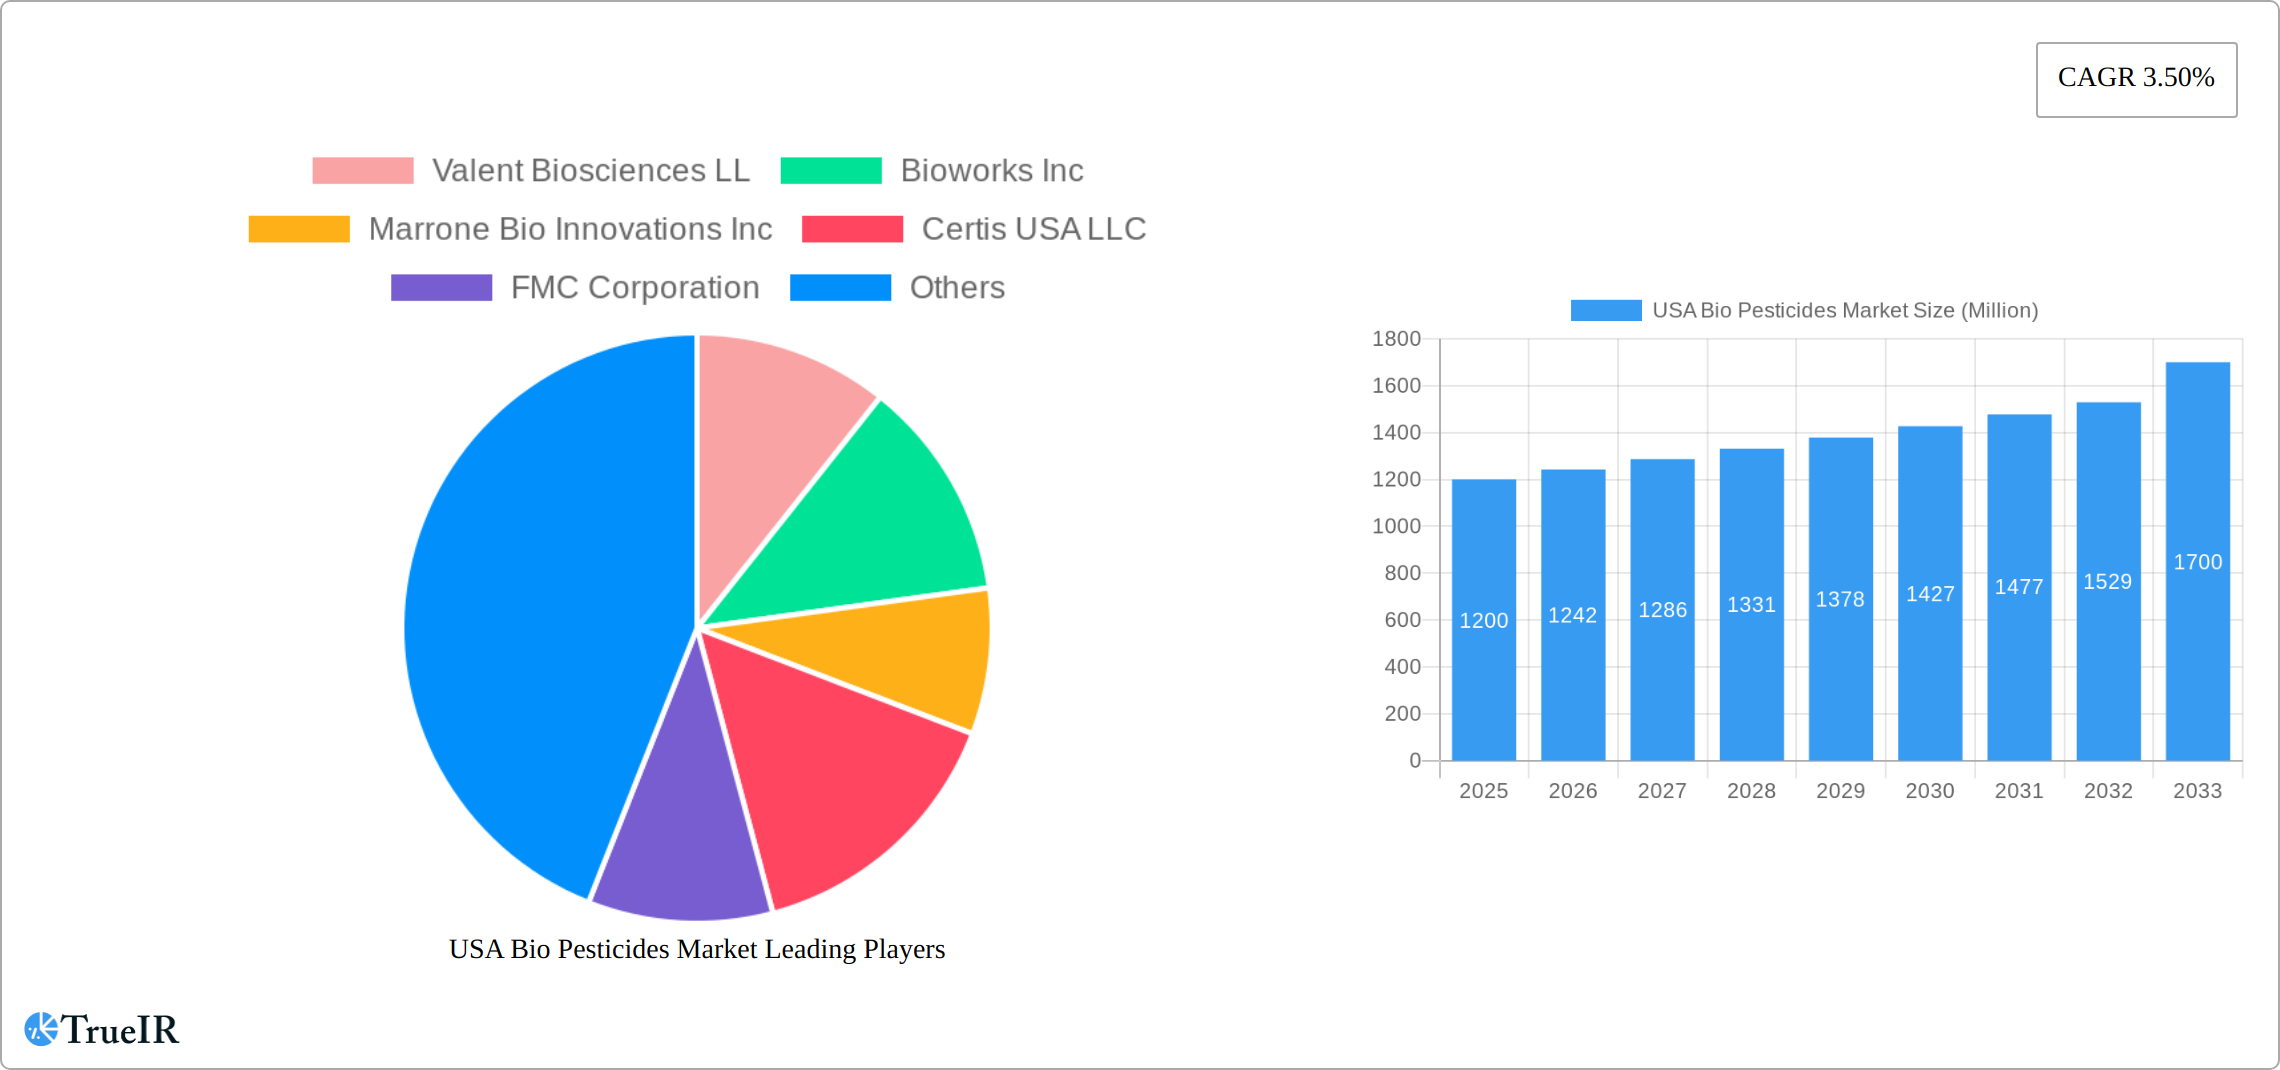
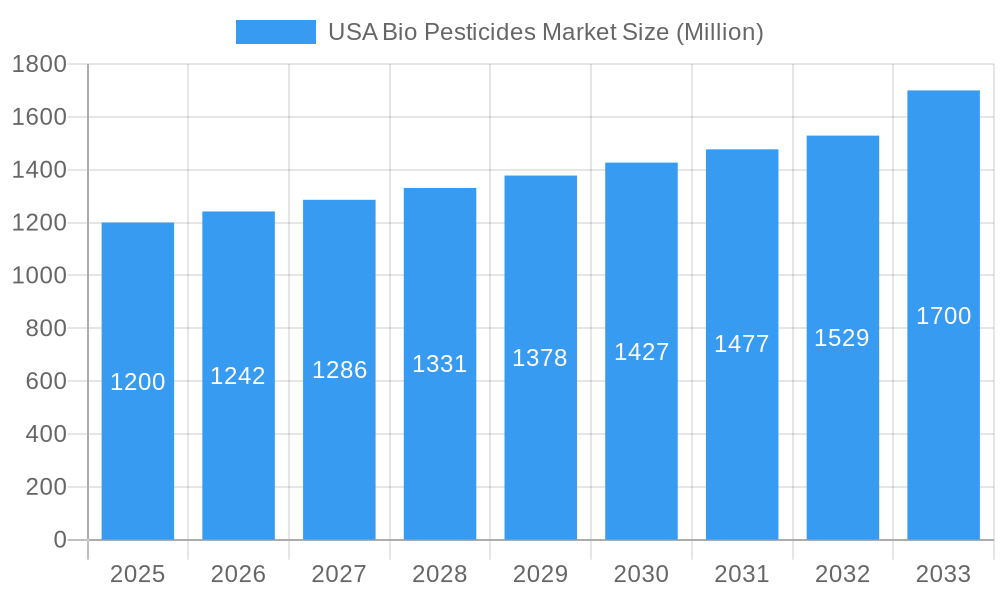
The US biopesticides market, valued at approximately $1.2 billion in 2025, is poised for steady growth, projected to reach $1.7 billion by 2033, exhibiting a compound annual growth rate (CAGR) of 3.5%. This expansion is fueled by several key factors. Increasing consumer demand for organically produced food and growing concerns about the environmental impact of conventional pesticides are driving adoption of biopesticides across various crop types, including cash crops like corn and soybeans, horticultural crops such as fruits and vegetables, and row crops. Government regulations promoting sustainable agriculture practices and incentives for biopesticide use further contribute to market growth. Specific segments like biofungicides and bioinsecticides are experiencing particularly strong demand, driven by the need for effective disease and pest control in high-value crops. While the market faces challenges including higher initial costs compared to conventional pesticides and sometimes lower efficacy in specific situations, ongoing research and development efforts aimed at improving the effectiveness and affordability of biopesticides are expected to mitigate these restraints. The market is largely dominated by established players like Valent Biosciences, Bioworks, and FMC Corporation, but also includes emerging companies and innovative startups, showcasing a dynamic and competitive landscape. Regional variations exist, with the West and Northeast regions showing potentially higher growth rates due to concentrated organic farming practices and stringent environmental regulations.
USA Bio Pesticides Market Market Size (In Billion)
The competitive landscape is characterized by a blend of large multinational corporations and smaller, specialized biopesticide companies. Larger players leverage their established distribution networks and strong brand recognition to maintain market share. Meanwhile, smaller companies are focusing on innovation and niche markets, offering specialized biopesticide solutions for specific crops and pests. The Northeast and West regions of the US, with their strong emphasis on sustainable agriculture and organic farming, are expected to witness higher growth rates compared to other regions. Continued investment in research and development, coupled with favorable government policies, will be vital in driving further market expansion. The market's future trajectory will heavily depend on ongoing scientific advancements that can enhance the efficacy and cost-effectiveness of biopesticides, ensuring their wider adoption across all agricultural sectors in the US.
USA Bio Pesticides Market Company Market Share
USA Bio Pesticides Market: A Comprehensive Report (2019-2033)
This dynamic report provides a comprehensive analysis of the USA Bio Pesticides Market, offering invaluable insights for industry stakeholders, investors, and researchers. Leveraging extensive market research and data analysis spanning the period 2019-2033 (historical period: 2019-2024, base year: 2025, forecast period: 2025-2033), this report unveils crucial trends, challenges, and opportunities shaping this rapidly evolving sector. The market is projected to reach xx Million by 2033, exhibiting a CAGR of xx% during the forecast period.
USA Bio Pesticides Market Structure & Competitive Landscape
The USA Bio Pesticides Market is characterized by a moderately concentrated landscape, with key players like Valent Biosciences, Corteva Agriscience, and Certis USA holding significant market share. However, the presence of numerous smaller, specialized companies indicates a dynamic competitive environment fostering innovation. The market concentration ratio (CR4) is estimated at xx% in 2025, reflecting a balance between established players and emerging innovators. Innovation is driven by the need for sustainable pest management solutions, increasing consumer demand for organic products, and stringent government regulations on synthetic pesticides.
Regulatory changes, including the EPA's ongoing evaluation of biopesticide registrations, significantly influence market dynamics. Product substitutes, mainly conventional chemical pesticides, continue to exert competitive pressure, although the growing awareness of environmental concerns and potential health risks associated with synthetic pesticides is fueling the adoption of biopesticides. The market is segmented by end-users, including large-scale commercial farms, smallholder farmers, and horticultural businesses.
Mergers and acquisitions (M&A) activity has been significant in recent years, with several major players strategically expanding their biopesticide portfolios through acquisitions. The volume of M&A deals in the biopesticide segment is projected to remain significant during the forecast period, driven by the increasing need for broader product portfolios and access to new technologies. The total value of M&A deals in the past five years is estimated at approximately xx Million.
USA Bio Pesticides Market Market Trends & Opportunities
The USA Bio Pesticides Market is experiencing robust growth, driven by factors such as the rising demand for sustainable agriculture, growing consumer awareness of the environmental and health impacts of synthetic pesticides, and increasing government support for organic farming practices. The market size, currently valued at xx Million in 2025, is projected to reach xx Million by 2033. This growth is reflected in a CAGR of xx%. Technological advancements, such as the development of novel biopesticide formulations and targeted delivery systems, are further contributing to market expansion. The market penetration rate for biopesticides in the overall pesticide market is currently estimated at xx%, and is expected to increase significantly by 2033, reaching xx%. The shift towards integrated pest management (IPM) strategies, which incorporate biopesticides as a key component, is also driving market growth.
Consumer preferences are increasingly leaning towards organically produced food and agricultural products, creating strong demand for biopesticides that comply with organic farming standards. The competitive landscape is evolving, with both established players and new entrants continuously striving for market share. This dynamic competition is stimulating innovation and fostering the development of advanced, highly effective biopesticides.
Dominant Markets & Segments in USA Bio Pesticides Market
Leading Segment by Form: Bioinsecticides currently hold the largest market share, driven by widespread adoption across diverse crop types. This strong performance is complemented by the robust growth of biofungicides, fueled by escalating concerns regarding crop fungal diseases and the increasing need for effective, eco-friendly solutions. The market is witnessing innovation in formulations, leading to improved efficacy and broader application.
Leading Segment by Crop Type: High-value cash crops and horticultural crops constitute the primary market segments for biopesticides due to their susceptibility to pest infestations and the higher economic impact of crop loss. However, the adoption of biopesticides is expanding rapidly in row crops, particularly corn and soybeans, indicating a broader market penetration driven by increasing awareness of sustainable agriculture practices and the associated environmental benefits.
Key Growth Drivers:
- The surging consumer preference for organically-produced food is a key driver, creating a robust demand for biopesticides.
- Stringent government regulations aimed at reducing synthetic pesticide use are forcing a shift towards eco-friendly alternatives.
- The growing awareness among consumers and agricultural professionals regarding the environmental and health hazards associated with synthetic pesticides is fostering a preference for biopesticides.
- Continuous advancements in biopesticide technology are resulting in more effective and reliable products, increasing market confidence.
- Government initiatives, including subsidies and supportive policies, are accelerating the adoption of sustainable agricultural practices, significantly promoting the use of biopesticides.
The expanding market within these segments is a direct result of the confluence of factors: the increasing consumer demand for organic produce, stricter regulations curbing synthetic pesticide use, and supportive government policies promoting sustainable agriculture. This positive feedback loop ensures continued growth in the US biopesticide market.
USA Bio Pesticides Market Product Analysis
The market features a diverse range of biopesticide products, including microbial pesticides (bacteria, fungi, viruses), botanical pesticides (derived from plants), and biochemical pesticides (naturally occurring substances). Technological advancements are focusing on enhancing the efficacy and shelf life of these products, along with developing targeted delivery systems for precise application. This leads to enhanced crop protection, reduced environmental impact and improved cost-effectiveness, making them attractive alternatives to synthetic pesticides. The competitive advantage often lies in the development of novel biopesticide formulations with superior performance characteristics and broader pest control spectrum.
Key Drivers, Barriers & Challenges in USA Bio Pesticides Market
Key Drivers: The market is propelled by growing consumer demand for organically produced food, stringent government regulations on synthetic pesticides, increasing awareness of environmental concerns, and the development of more effective and targeted biopesticide formulations. Government incentives and subsidies for sustainable agriculture also play a crucial role.
Key Barriers & Challenges: The high cost of biopesticide production compared to synthetic pesticides remains a significant barrier. Regulatory approval processes can be lengthy and complex, hindering the timely introduction of new products. Inconsistent efficacy of some biopesticides compared to their synthetic counterparts also presents a challenge. Furthermore, supply chain limitations and storage issues can affect the availability and consistent performance of biopesticides. The market share of biopesticides is still relatively low compared to the overall pesticide market, but its growth potential is considerable. This competition limits the immediate growth of the market.
Growth Drivers in the USA Bio Pesticides Market Market
The market is driven by rising demand for organic products, stricter regulations on synthetic pesticides, and advancements in biopesticide technology. Government support for sustainable agriculture and increased consumer awareness of environmental and health concerns further contribute to its growth.
Challenges Impacting USA Bio Pesticides Market Growth
Despite the promising growth, the market faces several challenges. High production costs, often associated with the more complex and delicate nature of biopesticide production, remain a hurdle. Lengthy regulatory approval processes can delay product launches and limit market entry for new innovations. Inconsistent efficacy compared to some synthetic alternatives, although improving with technological advancements, can also hinder widespread adoption. Furthermore, supply chain complexities and storage limitations, particularly regarding the shelf life of certain biopesticides, pose significant obstacles to market expansion.
Key Players Shaping the USA Bio Pesticides Market Market
- Valent Biosciences LL
- Bioworks Inc
- Marrone Bio Innovations Inc
- Certis USA LLC
- FMC Corporation
- Andermatt Group AG
- Indogulf BioAg LLC (Biotech Division of Indogulf Company)
- Corteva Agriscience
- Terramera Inc
- Lallemand Inc
Significant USA Bio Pesticides Market Industry Milestones
- June 2022: Valent BioSciences LLC announced a significant expansion of its biorational manufacturing facility in Osage, Iowa, demonstrating a commitment to meeting growing demand and introducing new, innovative products. This expansion reflects the company's confidence in the market's future.
- June 2022: Certis Biologicals and Novozymes' collaboration to develop new technologies for highly effective fungal disease control in row crops showcases the industry's focus on research and development to enhance biopesticide efficacy.
- September 2022: Corteva Agriscience's acquisition of Symborg significantly strengthened its biologicals portfolio and market position, highlighting the strategic importance of biopesticides within the broader agricultural industry.
These milestones underscore the industry's dynamic growth, driven by expansion, innovation, and strategic acquisitions to meet the escalating demand for sustainable pest management solutions. The focus on research and development, coupled with strategic investments, points towards a robust and expanding future for the US biopesticide market.
Future Outlook for USA Bio Pesticides Market Market
The USA Bio Pesticides Market is poised for sustained growth, driven by ongoing technological advancements, increasing consumer demand for organic products, and supportive government policies. Strategic partnerships, acquisitions, and the development of novel biopesticide formulations with enhanced efficacy will further drive market expansion. The market presents significant opportunities for companies focused on developing and commercializing sustainable and effective pest control solutions.
USA Bio Pesticides Market Segmentation
- 1. Production Analysis
- 2. Consumption Analysis
- 3. Import Market Analysis (Value & Volume)
- 4. Export Market Analysis (Value & Volume)
- 5. Price Trend Analysis
USA Bio Pesticides Market Segmentation By Geography
-
1. North America
- 1.1. United States
- 1.2. Canada
- 1.3. Mexico
-
2. South America
- 2.1. Brazil
- 2.2. Argentina
- 2.3. Rest of South America
-
3. Europe
- 3.1. United Kingdom
- 3.2. Germany
- 3.3. France
- 3.4. Italy
- 3.5. Spain
- 3.6. Russia
- 3.7. Benelux
- 3.8. Nordics
- 3.9. Rest of Europe
-
4. Middle East & Africa
- 4.1. Turkey
- 4.2. Israel
- 4.3. GCC
- 4.4. North Africa
- 4.5. South Africa
- 4.6. Rest of Middle East & Africa
-
5. Asia Pacific
- 5.1. China
- 5.2. India
- 5.3. Japan
- 5.4. South Korea
- 5.5. ASEAN
- 5.6. Oceania
- 5.7. Rest of Asia Pacific
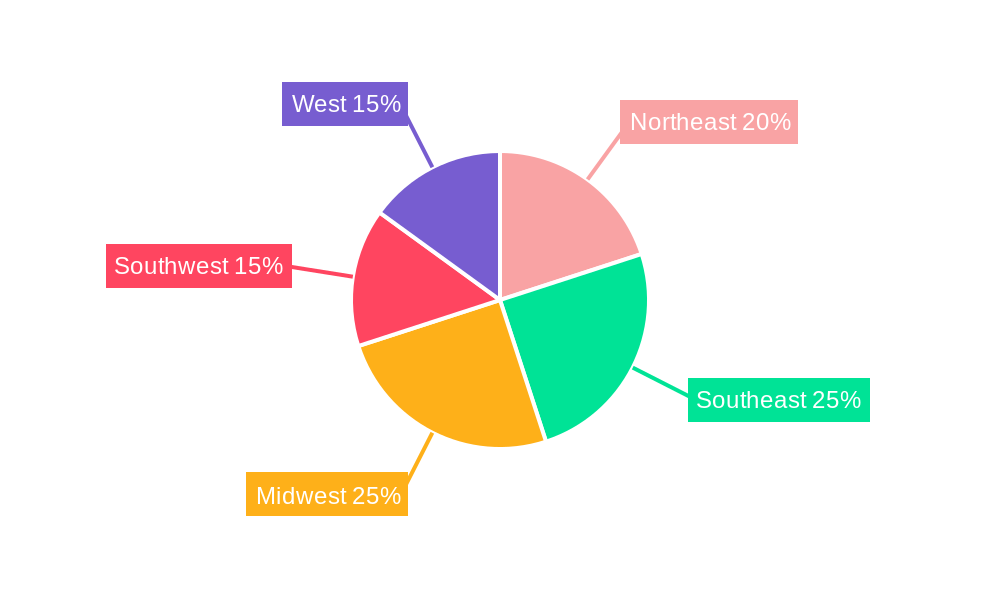
USA Bio Pesticides Market Regional Market Share
Geographic Coverage of USA Bio Pesticides Market
USA Bio Pesticides Market REPORT HIGHLIGHTS
| Aspects | Details |
|---|---|
| Study Period | 2020-2034 |
| Base Year | 2025 |
| Estimated Year | 2026 |
| Forecast Period | 2026-2034 |
| Historical Period | 2020-2025 |
| Growth Rate | CAGR of 14.6% from 2020-2034 |
| Segmentation |
|
Table of Contents
- 1. Introduction
- 1.1. Research Scope
- 1.2. Market Segmentation
- 1.3. Research Methodology
- 1.4. Definitions and Assumptions
- 2. Executive Summary
- 2.1. Introduction
- 3. Market Dynamics
- 3.1. Introduction
- 3.2. Market Drivers
- 3.2.1. Seed Treatment As A Solution To Enhance Yield; Growing Awareness For Seed Treatment Among The Farmers; Rising Trend Of Organic Farming
- 3.3. Market Restrains
- 3.3.1. Limitations Across Farm-Level Seed Treatment; Rising Environmental Concerns
- 3.4. Market Trends
- 3.4.1. Row Crops is the largest Crop Type
- 4. Market Factor Analysis
- 4.1. Porters Five Forces
- 4.2. Supply/Value Chain
- 4.3. PESTEL analysis
- 4.4. Market Entropy
- 4.5. Patent/Trademark Analysis
- 5. Global USA Bio Pesticides Market Analysis, Insights and Forecast, 2020-2032
- 5.1. Market Analysis, Insights and Forecast - by Production Analysis
- 5.2. Market Analysis, Insights and Forecast - by Consumption Analysis
- 5.3. Market Analysis, Insights and Forecast - by Import Market Analysis (Value & Volume)
- 5.4. Market Analysis, Insights and Forecast - by Export Market Analysis (Value & Volume)
- 5.5. Market Analysis, Insights and Forecast - by Price Trend Analysis
- 5.6. Market Analysis, Insights and Forecast - by Region
- 5.6.1. North America
- 5.6.2. South America
- 5.6.3. Europe
- 5.6.4. Middle East & Africa
- 5.6.5. Asia Pacific
- 5.1. Market Analysis, Insights and Forecast - by Production Analysis
- 6. North America USA Bio Pesticides Market Analysis, Insights and Forecast, 2020-2032
- 6.1. Market Analysis, Insights and Forecast - by Production Analysis
- 6.2. Market Analysis, Insights and Forecast - by Consumption Analysis
- 6.3. Market Analysis, Insights and Forecast - by Import Market Analysis (Value & Volume)
- 6.4. Market Analysis, Insights and Forecast - by Export Market Analysis (Value & Volume)
- 6.5. Market Analysis, Insights and Forecast - by Price Trend Analysis
- 6.1. Market Analysis, Insights and Forecast - by Production Analysis
- 7. South America USA Bio Pesticides Market Analysis, Insights and Forecast, 2020-2032
- 7.1. Market Analysis, Insights and Forecast - by Production Analysis
- 7.2. Market Analysis, Insights and Forecast - by Consumption Analysis
- 7.3. Market Analysis, Insights and Forecast - by Import Market Analysis (Value & Volume)
- 7.4. Market Analysis, Insights and Forecast - by Export Market Analysis (Value & Volume)
- 7.5. Market Analysis, Insights and Forecast - by Price Trend Analysis
- 7.1. Market Analysis, Insights and Forecast - by Production Analysis
- 8. Europe USA Bio Pesticides Market Analysis, Insights and Forecast, 2020-2032
- 8.1. Market Analysis, Insights and Forecast - by Production Analysis
- 8.2. Market Analysis, Insights and Forecast - by Consumption Analysis
- 8.3. Market Analysis, Insights and Forecast - by Import Market Analysis (Value & Volume)
- 8.4. Market Analysis, Insights and Forecast - by Export Market Analysis (Value & Volume)
- 8.5. Market Analysis, Insights and Forecast - by Price Trend Analysis
- 8.1. Market Analysis, Insights and Forecast - by Production Analysis
- 9. Middle East & Africa USA Bio Pesticides Market Analysis, Insights and Forecast, 2020-2032
- 9.1. Market Analysis, Insights and Forecast - by Production Analysis
- 9.2. Market Analysis, Insights and Forecast - by Consumption Analysis
- 9.3. Market Analysis, Insights and Forecast - by Import Market Analysis (Value & Volume)
- 9.4. Market Analysis, Insights and Forecast - by Export Market Analysis (Value & Volume)
- 9.5. Market Analysis, Insights and Forecast - by Price Trend Analysis
- 9.1. Market Analysis, Insights and Forecast - by Production Analysis
- 10. Asia Pacific USA Bio Pesticides Market Analysis, Insights and Forecast, 2020-2032
- 10.1. Market Analysis, Insights and Forecast - by Production Analysis
- 10.2. Market Analysis, Insights and Forecast - by Consumption Analysis
- 10.3. Market Analysis, Insights and Forecast - by Import Market Analysis (Value & Volume)
- 10.4. Market Analysis, Insights and Forecast - by Export Market Analysis (Value & Volume)
- 10.5. Market Analysis, Insights and Forecast - by Price Trend Analysis
- 10.1. Market Analysis, Insights and Forecast - by Production Analysis
- 11. Competitive Analysis
- 11.1. Global Market Share Analysis 2025
- 11.2. Company Profiles
- 11.2.1 Valent Biosciences LL
- 11.2.1.1. Overview
- 11.2.1.2. Products
- 11.2.1.3. SWOT Analysis
- 11.2.1.4. Recent Developments
- 11.2.1.5. Financials (Based on Availability)
- 11.2.2 Bioworks Inc
- 11.2.2.1. Overview
- 11.2.2.2. Products
- 11.2.2.3. SWOT Analysis
- 11.2.2.4. Recent Developments
- 11.2.2.5. Financials (Based on Availability)
- 11.2.3 Marrone Bio Innovations Inc
- 11.2.3.1. Overview
- 11.2.3.2. Products
- 11.2.3.3. SWOT Analysis
- 11.2.3.4. Recent Developments
- 11.2.3.5. Financials (Based on Availability)
- 11.2.4 Certis USA LLC
- 11.2.4.1. Overview
- 11.2.4.2. Products
- 11.2.4.3. SWOT Analysis
- 11.2.4.4. Recent Developments
- 11.2.4.5. Financials (Based on Availability)
- 11.2.5 FMC Corporation
- 11.2.5.1. Overview
- 11.2.5.2. Products
- 11.2.5.3. SWOT Analysis
- 11.2.5.4. Recent Developments
- 11.2.5.5. Financials (Based on Availability)
- 11.2.6 Andermatt Group AG
- 11.2.6.1. Overview
- 11.2.6.2. Products
- 11.2.6.3. SWOT Analysis
- 11.2.6.4. Recent Developments
- 11.2.6.5. Financials (Based on Availability)
- 11.2.7 Indogulf BioAg LLC (Biotech Division of Indogulf Company)
- 11.2.7.1. Overview
- 11.2.7.2. Products
- 11.2.7.3. SWOT Analysis
- 11.2.7.4. Recent Developments
- 11.2.7.5. Financials (Based on Availability)
- 11.2.8 Corteva Agriscience
- 11.2.8.1. Overview
- 11.2.8.2. Products
- 11.2.8.3. SWOT Analysis
- 11.2.8.4. Recent Developments
- 11.2.8.5. Financials (Based on Availability)
- 11.2.9 Terramera Inc
- 11.2.9.1. Overview
- 11.2.9.2. Products
- 11.2.9.3. SWOT Analysis
- 11.2.9.4. Recent Developments
- 11.2.9.5. Financials (Based on Availability)
- 11.2.10 Lallemand Inc
- 11.2.10.1. Overview
- 11.2.10.2. Products
- 11.2.10.3. SWOT Analysis
- 11.2.10.4. Recent Developments
- 11.2.10.5. Financials (Based on Availability)
- 11.2.1 Valent Biosciences LL
List of Figures
- Figure 1: Global USA Bio Pesticides Market Revenue Breakdown (undefined, %) by Region 2025 & 2033
- Figure 2: North America USA Bio Pesticides Market Revenue (undefined), by Production Analysis 2025 & 2033
- Figure 3: North America USA Bio Pesticides Market Revenue Share (%), by Production Analysis 2025 & 2033
- Figure 4: North America USA Bio Pesticides Market Revenue (undefined), by Consumption Analysis 2025 & 2033
- Figure 5: North America USA Bio Pesticides Market Revenue Share (%), by Consumption Analysis 2025 & 2033
- Figure 6: North America USA Bio Pesticides Market Revenue (undefined), by Import Market Analysis (Value & Volume) 2025 & 2033
- Figure 7: North America USA Bio Pesticides Market Revenue Share (%), by Import Market Analysis (Value & Volume) 2025 & 2033
- Figure 8: North America USA Bio Pesticides Market Revenue (undefined), by Export Market Analysis (Value & Volume) 2025 & 2033
- Figure 9: North America USA Bio Pesticides Market Revenue Share (%), by Export Market Analysis (Value & Volume) 2025 & 2033
- Figure 10: North America USA Bio Pesticides Market Revenue (undefined), by Price Trend Analysis 2025 & 2033
- Figure 11: North America USA Bio Pesticides Market Revenue Share (%), by Price Trend Analysis 2025 & 2033
- Figure 12: North America USA Bio Pesticides Market Revenue (undefined), by Country 2025 & 2033
- Figure 13: North America USA Bio Pesticides Market Revenue Share (%), by Country 2025 & 2033
- Figure 14: South America USA Bio Pesticides Market Revenue (undefined), by Production Analysis 2025 & 2033
- Figure 15: South America USA Bio Pesticides Market Revenue Share (%), by Production Analysis 2025 & 2033
- Figure 16: South America USA Bio Pesticides Market Revenue (undefined), by Consumption Analysis 2025 & 2033
- Figure 17: South America USA Bio Pesticides Market Revenue Share (%), by Consumption Analysis 2025 & 2033
- Figure 18: South America USA Bio Pesticides Market Revenue (undefined), by Import Market Analysis (Value & Volume) 2025 & 2033
- Figure 19: South America USA Bio Pesticides Market Revenue Share (%), by Import Market Analysis (Value & Volume) 2025 & 2033
- Figure 20: South America USA Bio Pesticides Market Revenue (undefined), by Export Market Analysis (Value & Volume) 2025 & 2033
- Figure 21: South America USA Bio Pesticides Market Revenue Share (%), by Export Market Analysis (Value & Volume) 2025 & 2033
- Figure 22: South America USA Bio Pesticides Market Revenue (undefined), by Price Trend Analysis 2025 & 2033
- Figure 23: South America USA Bio Pesticides Market Revenue Share (%), by Price Trend Analysis 2025 & 2033
- Figure 24: South America USA Bio Pesticides Market Revenue (undefined), by Country 2025 & 2033
- Figure 25: South America USA Bio Pesticides Market Revenue Share (%), by Country 2025 & 2033
- Figure 26: Europe USA Bio Pesticides Market Revenue (undefined), by Production Analysis 2025 & 2033
- Figure 27: Europe USA Bio Pesticides Market Revenue Share (%), by Production Analysis 2025 & 2033
- Figure 28: Europe USA Bio Pesticides Market Revenue (undefined), by Consumption Analysis 2025 & 2033
- Figure 29: Europe USA Bio Pesticides Market Revenue Share (%), by Consumption Analysis 2025 & 2033
- Figure 30: Europe USA Bio Pesticides Market Revenue (undefined), by Import Market Analysis (Value & Volume) 2025 & 2033
- Figure 31: Europe USA Bio Pesticides Market Revenue Share (%), by Import Market Analysis (Value & Volume) 2025 & 2033
- Figure 32: Europe USA Bio Pesticides Market Revenue (undefined), by Export Market Analysis (Value & Volume) 2025 & 2033
- Figure 33: Europe USA Bio Pesticides Market Revenue Share (%), by Export Market Analysis (Value & Volume) 2025 & 2033
- Figure 34: Europe USA Bio Pesticides Market Revenue (undefined), by Price Trend Analysis 2025 & 2033
- Figure 35: Europe USA Bio Pesticides Market Revenue Share (%), by Price Trend Analysis 2025 & 2033
- Figure 36: Europe USA Bio Pesticides Market Revenue (undefined), by Country 2025 & 2033
- Figure 37: Europe USA Bio Pesticides Market Revenue Share (%), by Country 2025 & 2033
- Figure 38: Middle East & Africa USA Bio Pesticides Market Revenue (undefined), by Production Analysis 2025 & 2033
- Figure 39: Middle East & Africa USA Bio Pesticides Market Revenue Share (%), by Production Analysis 2025 & 2033
- Figure 40: Middle East & Africa USA Bio Pesticides Market Revenue (undefined), by Consumption Analysis 2025 & 2033
- Figure 41: Middle East & Africa USA Bio Pesticides Market Revenue Share (%), by Consumption Analysis 2025 & 2033
- Figure 42: Middle East & Africa USA Bio Pesticides Market Revenue (undefined), by Import Market Analysis (Value & Volume) 2025 & 2033
- Figure 43: Middle East & Africa USA Bio Pesticides Market Revenue Share (%), by Import Market Analysis (Value & Volume) 2025 & 2033
- Figure 44: Middle East & Africa USA Bio Pesticides Market Revenue (undefined), by Export Market Analysis (Value & Volume) 2025 & 2033
- Figure 45: Middle East & Africa USA Bio Pesticides Market Revenue Share (%), by Export Market Analysis (Value & Volume) 2025 & 2033
- Figure 46: Middle East & Africa USA Bio Pesticides Market Revenue (undefined), by Price Trend Analysis 2025 & 2033
- Figure 47: Middle East & Africa USA Bio Pesticides Market Revenue Share (%), by Price Trend Analysis 2025 & 2033
- Figure 48: Middle East & Africa USA Bio Pesticides Market Revenue (undefined), by Country 2025 & 2033
- Figure 49: Middle East & Africa USA Bio Pesticides Market Revenue Share (%), by Country 2025 & 2033
- Figure 50: Asia Pacific USA Bio Pesticides Market Revenue (undefined), by Production Analysis 2025 & 2033
- Figure 51: Asia Pacific USA Bio Pesticides Market Revenue Share (%), by Production Analysis 2025 & 2033
- Figure 52: Asia Pacific USA Bio Pesticides Market Revenue (undefined), by Consumption Analysis 2025 & 2033
- Figure 53: Asia Pacific USA Bio Pesticides Market Revenue Share (%), by Consumption Analysis 2025 & 2033
- Figure 54: Asia Pacific USA Bio Pesticides Market Revenue (undefined), by Import Market Analysis (Value & Volume) 2025 & 2033
- Figure 55: Asia Pacific USA Bio Pesticides Market Revenue Share (%), by Import Market Analysis (Value & Volume) 2025 & 2033
- Figure 56: Asia Pacific USA Bio Pesticides Market Revenue (undefined), by Export Market Analysis (Value & Volume) 2025 & 2033
- Figure 57: Asia Pacific USA Bio Pesticides Market Revenue Share (%), by Export Market Analysis (Value & Volume) 2025 & 2033
- Figure 58: Asia Pacific USA Bio Pesticides Market Revenue (undefined), by Price Trend Analysis 2025 & 2033
- Figure 59: Asia Pacific USA Bio Pesticides Market Revenue Share (%), by Price Trend Analysis 2025 & 2033
- Figure 60: Asia Pacific USA Bio Pesticides Market Revenue (undefined), by Country 2025 & 2033
- Figure 61: Asia Pacific USA Bio Pesticides Market Revenue Share (%), by Country 2025 & 2033
List of Tables
- Table 1: Global USA Bio Pesticides Market Revenue undefined Forecast, by Production Analysis 2020 & 2033
- Table 2: Global USA Bio Pesticides Market Revenue undefined Forecast, by Consumption Analysis 2020 & 2033
- Table 3: Global USA Bio Pesticides Market Revenue undefined Forecast, by Import Market Analysis (Value & Volume) 2020 & 2033
- Table 4: Global USA Bio Pesticides Market Revenue undefined Forecast, by Export Market Analysis (Value & Volume) 2020 & 2033
- Table 5: Global USA Bio Pesticides Market Revenue undefined Forecast, by Price Trend Analysis 2020 & 2033
- Table 6: Global USA Bio Pesticides Market Revenue undefined Forecast, by Region 2020 & 2033
- Table 7: Global USA Bio Pesticides Market Revenue undefined Forecast, by Production Analysis 2020 & 2033
- Table 8: Global USA Bio Pesticides Market Revenue undefined Forecast, by Consumption Analysis 2020 & 2033
- Table 9: Global USA Bio Pesticides Market Revenue undefined Forecast, by Import Market Analysis (Value & Volume) 2020 & 2033
- Table 10: Global USA Bio Pesticides Market Revenue undefined Forecast, by Export Market Analysis (Value & Volume) 2020 & 2033
- Table 11: Global USA Bio Pesticides Market Revenue undefined Forecast, by Price Trend Analysis 2020 & 2033
- Table 12: Global USA Bio Pesticides Market Revenue undefined Forecast, by Country 2020 & 2033
- Table 13: United States USA Bio Pesticides Market Revenue (undefined) Forecast, by Application 2020 & 2033
- Table 14: Canada USA Bio Pesticides Market Revenue (undefined) Forecast, by Application 2020 & 2033
- Table 15: Mexico USA Bio Pesticides Market Revenue (undefined) Forecast, by Application 2020 & 2033
- Table 16: Global USA Bio Pesticides Market Revenue undefined Forecast, by Production Analysis 2020 & 2033
- Table 17: Global USA Bio Pesticides Market Revenue undefined Forecast, by Consumption Analysis 2020 & 2033
- Table 18: Global USA Bio Pesticides Market Revenue undefined Forecast, by Import Market Analysis (Value & Volume) 2020 & 2033
- Table 19: Global USA Bio Pesticides Market Revenue undefined Forecast, by Export Market Analysis (Value & Volume) 2020 & 2033
- Table 20: Global USA Bio Pesticides Market Revenue undefined Forecast, by Price Trend Analysis 2020 & 2033
- Table 21: Global USA Bio Pesticides Market Revenue undefined Forecast, by Country 2020 & 2033
- Table 22: Brazil USA Bio Pesticides Market Revenue (undefined) Forecast, by Application 2020 & 2033
- Table 23: Argentina USA Bio Pesticides Market Revenue (undefined) Forecast, by Application 2020 & 2033
- Table 24: Rest of South America USA Bio Pesticides Market Revenue (undefined) Forecast, by Application 2020 & 2033
- Table 25: Global USA Bio Pesticides Market Revenue undefined Forecast, by Production Analysis 2020 & 2033
- Table 26: Global USA Bio Pesticides Market Revenue undefined Forecast, by Consumption Analysis 2020 & 2033
- Table 27: Global USA Bio Pesticides Market Revenue undefined Forecast, by Import Market Analysis (Value & Volume) 2020 & 2033
- Table 28: Global USA Bio Pesticides Market Revenue undefined Forecast, by Export Market Analysis (Value & Volume) 2020 & 2033
- Table 29: Global USA Bio Pesticides Market Revenue undefined Forecast, by Price Trend Analysis 2020 & 2033
- Table 30: Global USA Bio Pesticides Market Revenue undefined Forecast, by Country 2020 & 2033
- Table 31: United Kingdom USA Bio Pesticides Market Revenue (undefined) Forecast, by Application 2020 & 2033
- Table 32: Germany USA Bio Pesticides Market Revenue (undefined) Forecast, by Application 2020 & 2033
- Table 33: France USA Bio Pesticides Market Revenue (undefined) Forecast, by Application 2020 & 2033
- Table 34: Italy USA Bio Pesticides Market Revenue (undefined) Forecast, by Application 2020 & 2033
- Table 35: Spain USA Bio Pesticides Market Revenue (undefined) Forecast, by Application 2020 & 2033
- Table 36: Russia USA Bio Pesticides Market Revenue (undefined) Forecast, by Application 2020 & 2033
- Table 37: Benelux USA Bio Pesticides Market Revenue (undefined) Forecast, by Application 2020 & 2033
- Table 38: Nordics USA Bio Pesticides Market Revenue (undefined) Forecast, by Application 2020 & 2033
- Table 39: Rest of Europe USA Bio Pesticides Market Revenue (undefined) Forecast, by Application 2020 & 2033
- Table 40: Global USA Bio Pesticides Market Revenue undefined Forecast, by Production Analysis 2020 & 2033
- Table 41: Global USA Bio Pesticides Market Revenue undefined Forecast, by Consumption Analysis 2020 & 2033
- Table 42: Global USA Bio Pesticides Market Revenue undefined Forecast, by Import Market Analysis (Value & Volume) 2020 & 2033
- Table 43: Global USA Bio Pesticides Market Revenue undefined Forecast, by Export Market Analysis (Value & Volume) 2020 & 2033
- Table 44: Global USA Bio Pesticides Market Revenue undefined Forecast, by Price Trend Analysis 2020 & 2033
- Table 45: Global USA Bio Pesticides Market Revenue undefined Forecast, by Country 2020 & 2033
- Table 46: Turkey USA Bio Pesticides Market Revenue (undefined) Forecast, by Application 2020 & 2033
- Table 47: Israel USA Bio Pesticides Market Revenue (undefined) Forecast, by Application 2020 & 2033
- Table 48: GCC USA Bio Pesticides Market Revenue (undefined) Forecast, by Application 2020 & 2033
- Table 49: North Africa USA Bio Pesticides Market Revenue (undefined) Forecast, by Application 2020 & 2033
- Table 50: South Africa USA Bio Pesticides Market Revenue (undefined) Forecast, by Application 2020 & 2033
- Table 51: Rest of Middle East & Africa USA Bio Pesticides Market Revenue (undefined) Forecast, by Application 2020 & 2033
- Table 52: Global USA Bio Pesticides Market Revenue undefined Forecast, by Production Analysis 2020 & 2033
- Table 53: Global USA Bio Pesticides Market Revenue undefined Forecast, by Consumption Analysis 2020 & 2033
- Table 54: Global USA Bio Pesticides Market Revenue undefined Forecast, by Import Market Analysis (Value & Volume) 2020 & 2033
- Table 55: Global USA Bio Pesticides Market Revenue undefined Forecast, by Export Market Analysis (Value & Volume) 2020 & 2033
- Table 56: Global USA Bio Pesticides Market Revenue undefined Forecast, by Price Trend Analysis 2020 & 2033
- Table 57: Global USA Bio Pesticides Market Revenue undefined Forecast, by Country 2020 & 2033
- Table 58: China USA Bio Pesticides Market Revenue (undefined) Forecast, by Application 2020 & 2033
- Table 59: India USA Bio Pesticides Market Revenue (undefined) Forecast, by Application 2020 & 2033
- Table 60: Japan USA Bio Pesticides Market Revenue (undefined) Forecast, by Application 2020 & 2033
- Table 61: South Korea USA Bio Pesticides Market Revenue (undefined) Forecast, by Application 2020 & 2033
- Table 62: ASEAN USA Bio Pesticides Market Revenue (undefined) Forecast, by Application 2020 & 2033
- Table 63: Oceania USA Bio Pesticides Market Revenue (undefined) Forecast, by Application 2020 & 2033
- Table 64: Rest of Asia Pacific USA Bio Pesticides Market Revenue (undefined) Forecast, by Application 2020 & 2033
Frequently Asked Questions
1. What is the projected Compound Annual Growth Rate (CAGR) of the USA Bio Pesticides Market?
The projected CAGR is approximately 14.6%.
2. Which companies are prominent players in the USA Bio Pesticides Market?
Key companies in the market include Valent Biosciences LL, Bioworks Inc, Marrone Bio Innovations Inc, Certis USA LLC, FMC Corporation, Andermatt Group AG, Indogulf BioAg LLC (Biotech Division of Indogulf Company), Corteva Agriscience, Terramera Inc, Lallemand Inc.
3. What are the main segments of the USA Bio Pesticides Market?
The market segments include Production Analysis, Consumption Analysis, Import Market Analysis (Value & Volume), Export Market Analysis (Value & Volume), Price Trend Analysis.
4. Can you provide details about the market size?
The market size is estimated to be USD XXX N/A as of 2022.
5. What are some drivers contributing to market growth?
Seed Treatment As A Solution To Enhance Yield; Growing Awareness For Seed Treatment Among The Farmers; Rising Trend Of Organic Farming.
6. What are the notable trends driving market growth?
Row Crops is the largest Crop Type.
7. Are there any restraints impacting market growth?
Limitations Across Farm-Level Seed Treatment; Rising Environmental Concerns.
8. Can you provide examples of recent developments in the market?
September 2022: Corteva Agriscience signed an agreement to acquire a biologicals-based company Symborg as a part of its strategy to expand its biologicals portfolio. This move would help Corteva Agriscience in achieving its aim to become a global leader in the agricultural biologicals market.June 2022: Certis Biologicals and Novozymes, two leading agricultural biotechnology companies, collaborated to develop new technologies for highly effective fungal disease control. This collaboration will provide new solutions to row crop growers.June 2022: Valent BioSciences LLC confirmed that it had approved a big expansion of its biorational manufacturing facility in Osage, Iowa, to meet the rising demand for its biorational products and introduce new products that will necessitate more capacity.
9. What pricing options are available for accessing the report?
Pricing options include single-user, multi-user, and enterprise licenses priced at USD 3800, USD 4500, and USD 5800 respectively.
10. Is the market size provided in terms of value or volume?
The market size is provided in terms of value, measured in N/A.
11. Are there any specific market keywords associated with the report?
Yes, the market keyword associated with the report is "USA Bio Pesticides Market," which aids in identifying and referencing the specific market segment covered.
12. How do I determine which pricing option suits my needs best?
The pricing options vary based on user requirements and access needs. Individual users may opt for single-user licenses, while businesses requiring broader access may choose multi-user or enterprise licenses for cost-effective access to the report.
13. Are there any additional resources or data provided in the USA Bio Pesticides Market report?
While the report offers comprehensive insights, it's advisable to review the specific contents or supplementary materials provided to ascertain if additional resources or data are available.
14. How can I stay updated on further developments or reports in the USA Bio Pesticides Market?
To stay informed about further developments, trends, and reports in the USA Bio Pesticides Market, consider subscribing to industry newsletters, following relevant companies and organizations, or regularly checking reputable industry news sources and publications.
Methodology
Step 1 - Identification of Relevant Samples Size from Population Database


Step 2 - Approaches for Defining Global Market Size (Value, Volume* & Price*)

Note*: In applicable scenarios
Step 3 - Data Sources
Primary Research
- Web Analytics
- Survey Reports
- Research Institute
- Latest Research Reports
- Opinion Leaders
Secondary Research
- Annual Reports
- White Paper
- Latest Press Release
- Industry Association
- Paid Database
- Investor Presentations

Step 4 - Data Triangulation
Involves using different sources of information in order to increase the validity of a study
These sources are likely to be stakeholders in a program - participants, other researchers, program staff, other community members, and so on.
Then we put all data in single framework & apply various statistical tools to find out the dynamic on the market.
During the analysis stage, feedback from the stakeholder groups would be compared to determine areas of agreement as well as areas of divergence