

Key Insights
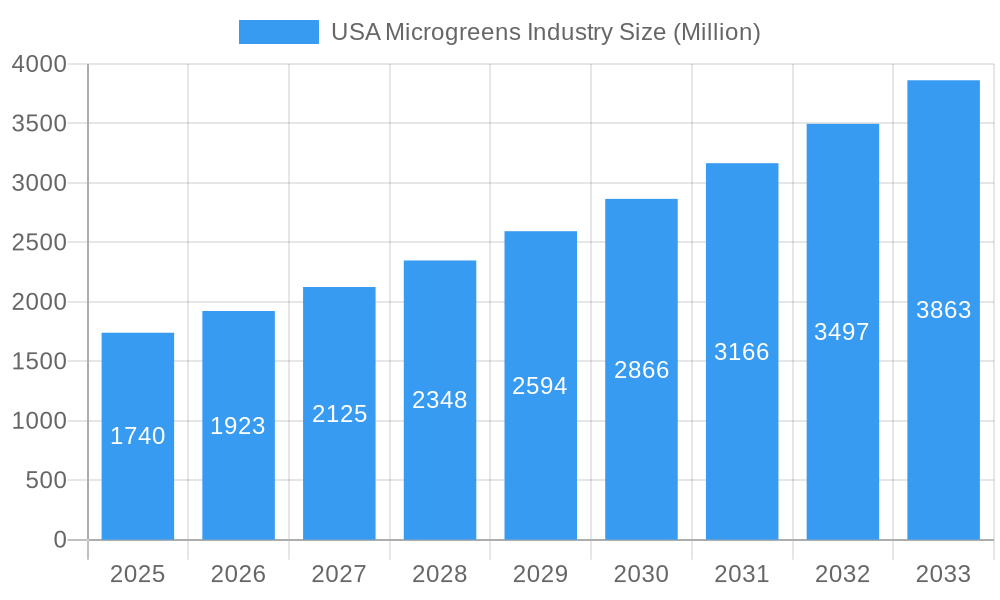
The US microgreens industry, valued at $1.74 billion in 2025, is experiencing robust growth, projected to expand at a compound annual growth rate (CAGR) of 10.60% from 2025 to 2033. This surge is driven by several key factors. Increasing consumer awareness of the nutritional benefits of microgreens, coupled with rising demand for healthy and convenient food options, fuels market expansion. The burgeoning popularity of plant-based diets and the growing adoption of microgreens in diverse culinary applications, from gourmet restaurants to mainstream supermarkets, further contribute to this growth trajectory. Furthermore, the rise of indoor and vertical farming techniques is optimizing production efficiency and year-round availability, creating a consistent supply to meet the escalating demand. While challenges such as fluctuating raw material prices and competition from established produce exist, the overall market outlook remains positive, indicating significant opportunities for industry players.
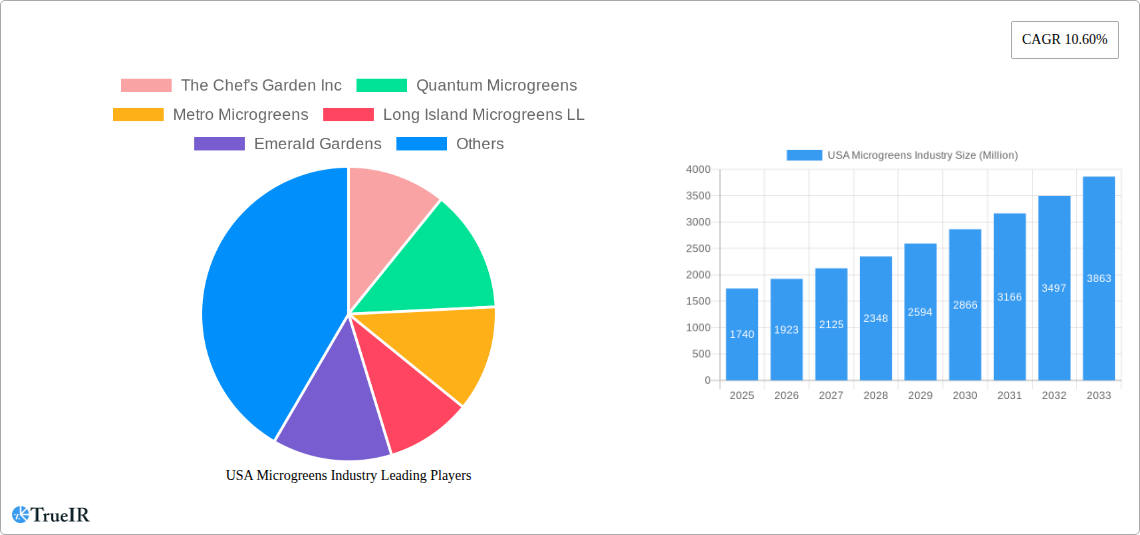
USA Microgreens Industry Market Size (In Billion)
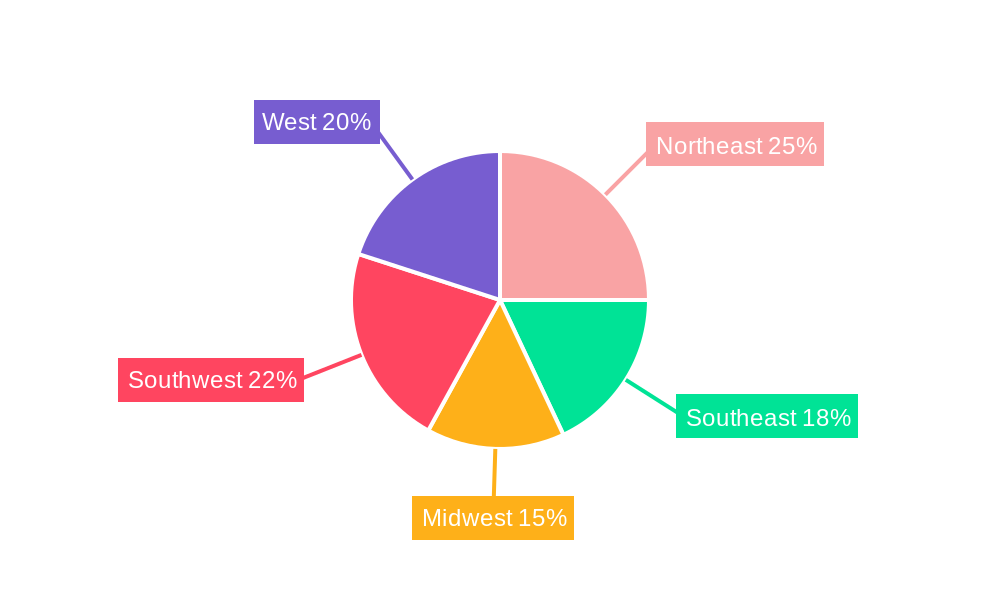
The market segmentation reveals strong performance across various channels and types. Hypermarkets and supermarkets dominate sales channels, reflecting the increasing accessibility of microgreens to the average consumer. Within the farming segment, indoor and vertical farming are witnessing rapid adoption due to their enhanced control over environmental factors and high yield potential. Broccoli, lettuce, and chicory currently lead in terms of microgreen type, indicating a preference for familiar and versatile options. However, the market is poised for diversification with the increasing popularity of other varieties like basil, fennel, and kale, driven by consumer exploration of diverse flavors and nutritional profiles. The geographic distribution is expected to reflect population density and consumer preferences, with regions like the Northeast and West likely to showcase stronger growth due to higher health-conscious populations and adoption of innovative food trends. The competitive landscape comprises both established players and emerging businesses, indicating healthy dynamism and innovation within the industry.
USA Microgreens Industry Company Market Share
USA Microgreens Industry Market Report: 2019-2033
This comprehensive report provides a detailed analysis of the burgeoning USA microgreens industry, offering invaluable insights for investors, industry professionals, and strategic planners. The report covers the period 2019-2033, with a base year of 2025 and a forecast period spanning 2025-2033. It analyzes market size, growth trends, competitive dynamics, and future opportunities, presenting a robust understanding of this rapidly evolving sector. The report leverages extensive market research and data analysis to provide a clear picture of the current market landscape and future projections, predicting a market value of $xx Million by 2033.
USA Microgreens Industry Market Structure & Competitive Landscape
The USA microgreens industry is characterized by a moderately fragmented competitive landscape. While a few major players like AeroFarms LLC and The Chef's Garden Inc. hold significant market share, numerous smaller regional and local producers also contribute to the overall market volume. The industry’s concentration ratio (CR4) is estimated at xx%, indicating a relatively competitive environment. Innovation is a key driver, with companies constantly seeking to improve production efficiency, product quality, and sustainability. This is evident in the growing adoption of technologies like vertical farming and aeroponics. Regulatory impacts are currently minimal, but potential future regulations concerning food safety and sustainable agricultural practices could reshape the market. Product substitutes, such as conventionally grown leafy greens, exert some competitive pressure, but the unique nutritional value and perceived health benefits of microgreens provide a strong competitive advantage. The market is segmented by sales channel (hypermarkets/supermarkets, restaurants, other channels), farming techniques (indoor farming, vertical farming, commercial greenhouses, other), and microgreen type (broccoli, lettuce & chicory, basil, fennel, carrots, radish, amaranth, arugula, beets, mustard, kale, cress & chard). M&A activity has been relatively low in recent years, with an estimated xx number of transactions in the past five years, but consolidation is likely to increase as the market matures.
USA Microgreens Industry Market Trends & Opportunities
The USA microgreens market exhibits robust growth, driven by increasing consumer awareness of health and wellness, a growing preference for fresh and locally sourced produce, and the expanding adoption of innovative farming techniques. The market size, estimated at $xx Million in 2025, is projected to experience a CAGR of xx% during the forecast period (2025-2033), reaching $xx Million by 2033. Technological advancements, particularly in vertical farming and aeroponics, are significantly enhancing production efficiency, yield, and year-round availability, leading to increased market penetration. Consumer preferences are shifting towards organic and sustainably produced microgreens, driving demand for products with eco-friendly certifications. The competitive landscape is dynamic, with both established players and new entrants vying for market share. This competition is fostering innovation and driving down prices, making microgreens increasingly accessible to consumers. The rising adoption of online grocery platforms and food delivery services presents new opportunities for microgreens producers to expand their reach and access broader customer bases.
Dominant Markets & Segments in USA Microgreens Industry
The USA microgreens market demonstrates significant regional variations in growth and consumption patterns. Currently, the xx region holds the largest market share, driven by factors such as higher disposable incomes, increased health consciousness, and a well-established distribution network. Within the sales channels, hypermarkets/supermarkets constitute the dominant segment, representing xx% of the total market share in 2025, reflecting the widespread availability of microgreens in mainstream retail stores. The restaurant segment also shows strong growth potential, fueled by the increasing use of microgreens as a premium ingredient in gourmet dishes.
- Key Growth Drivers for Hypermarkets/Supermarkets: Strong distribution networks, increased consumer accessibility, and strategic partnerships with microgreens producers.
- Key Growth Drivers for Restaurants: Rising demand for healthy and visually appealing menu items, increasing adoption of farm-to-table concepts, and the growing popularity of fusion cuisine.
Among farming techniques, indoor farming, primarily through vertical farming, is gaining traction, contributing xx% of the total production, due to its potential for high-yield production, environmental control, and reduced land requirements. In terms of microgreen types, broccoli, lettuce, and chicory remain the dominant segments, accounting for xx% of the total market share in 2025 due to widespread consumer familiarity and versatility in culinary applications.
USA Microgreens Industry Product Analysis
The USA microgreens market showcases continuous innovation in terms of product offerings. New varieties, blends, and processing techniques are being developed to cater to evolving consumer preferences and culinary applications. There is a growing emphasis on organic, pesticide-free, and sustainably produced microgreens, reflecting the heightened demand for eco-conscious products. Competitive advantages are primarily driven by factors such as superior quality, efficient production methods, innovative packaging, and strong brand recognition. Technological advancements, particularly in controlled-environment agriculture and precision farming, play a crucial role in enhancing product quality and reducing production costs, providing a competitive edge in the market.
Key Drivers, Barriers & Challenges in USA Microgreens Industry
Key Drivers: The increasing consumer demand for healthy and nutritious food, coupled with growing awareness of microgreens' nutritional benefits, is a primary driver. Technological advancements, including vertical farming, are improving production efficiency and yield. Government initiatives promoting sustainable agriculture and local food systems also contribute to the market’s growth.
Challenges: The industry faces challenges related to maintaining consistent quality, managing supply chain logistics, and complying with stringent food safety regulations. Price volatility of inputs (seeds, energy) and competition from established leafy green producers pose significant challenges. Scalability and maintaining consistent quality across larger production volumes remain key hurdles for many growers.
Growth Drivers in the USA Microgreens Industry Market
The increasing consumer preference for fresh, healthy, and convenient food options is a major driver of growth. Technological advancements like vertical farming and automation are boosting production efficiency and reducing operational costs. Supportive government policies aimed at promoting sustainable agriculture and local food systems further stimulate industry growth. Moreover, rising investments in research and development are leading to the introduction of innovative products and improved cultivation techniques.
Challenges Impacting USA Microgreens Industry Growth
High initial investment costs associated with advanced farming technologies like vertical farming can hinder entry for smaller players. Competition from established players in the broader leafy greens market presents a significant challenge, especially in terms of pricing and distribution. Stringent food safety regulations necessitate adherence to complex protocols, adding to production costs. Maintaining consistent product quality across diverse growing environments and distribution channels can be demanding.
Key Players Shaping the USA Microgreens Industry Market
- The Chef's Garden Inc
- Quantum Microgreens
- Metro Microgreens
- Long Island Microgreens LL
- Emerald Gardens
- Fresh Origins
- Florida Microgreens
- Farmbox Greens LLC
- Arizona Microgreens LLC
- AeroFarms LLC
Significant USA Microgreens Industry Industry Milestones
- September 2022: AeroFarms established the world's largest aeroponic smart farm in Danville, VA, capable of growing over 3 million lbs of leafy greens annually, significantly increasing production capacity and market share.
- July 2022: AeroFarms expanded its vertical farm in Pittsylvania County, boosting production to meet growing consumer demand.
- February 2022: Infarm launched a new vertical farming center in Texas, expanding its presence and the regional microgreens market.
Future Outlook for USA Microgreens Industry Market
The USA microgreens industry is poised for sustained growth, driven by ongoing technological advancements, increasing consumer demand for healthy foods, and supportive government policies. Strategic investments in research and development, along with the adoption of sustainable farming practices, will be crucial for long-term success. Opportunities exist in expanding into new markets, developing innovative products, and forging strategic partnerships across the supply chain. The market is expected to witness continued consolidation as larger players acquire smaller companies to gain scale and market share.
USA Microgreens Industry Segmentation
- 1. Production Analysis
- 2. Consumption Analysis
- 3. Import Market Analysis (Value & Volume)
- 4. Export Market Analysis (Value & Volume)
- 5. Price Trend Analysis
USA Microgreens Industry Segmentation By Geography
-
1. North America
- 1.1. United States
- 1.2. Canada
- 1.3. Mexico
-
2. South America
- 2.1. Brazil
- 2.2. Argentina
- 2.3. Rest of South America
-
3. Europe
- 3.1. United Kingdom
- 3.2. Germany
- 3.3. France
- 3.4. Italy
- 3.5. Spain
- 3.6. Russia
- 3.7. Benelux
- 3.8. Nordics
- 3.9. Rest of Europe
-
4. Middle East & Africa
- 4.1. Turkey
- 4.2. Israel
- 4.3. GCC
- 4.4. North Africa
- 4.5. South Africa
- 4.6. Rest of Middle East & Africa
-
5. Asia Pacific
- 5.1. China
- 5.2. India
- 5.3. Japan
- 5.4. South Korea
- 5.5. ASEAN
- 5.6. Oceania
- 5.7. Rest of Asia Pacific
USA Microgreens Industry Regional Market Share
Geographic Coverage of USA Microgreens Industry
USA Microgreens Industry REPORT HIGHLIGHTS
| Aspects | Details |
|---|---|
| Study Period | 2020-2034 |
| Base Year | 2025 |
| Estimated Year | 2026 |
| Forecast Period | 2026-2034 |
| Historical Period | 2020-2025 |
| Growth Rate | CAGR of 10.60% from 2020-2034 |
| Segmentation |
|
Table of Contents
- 1. Introduction
- 1.1. Research Scope
- 1.2. Market Segmentation
- 1.3. Research Objective
- 1.4. Definitions and Assumptions
- 2. Executive Summary
- 2.1. Market Snapshot
- 3. Market Dynamics
- 3.1. Market Drivers
- 3.2. Market Restrains
- 3.3. Market Trends
- 3.4. Market Opportunities
- 4. Market Factor Analysis
- 4.1. Porters Five Forces
- 4.1.1. Bargaining Power of Suppliers
- 4.1.2. Bargaining Power of Buyers
- 4.1.3. Threat of New Entrants
- 4.1.4. Threat of Substitutes
- 4.1.5. Competitive Rivalry
- 4.2. PESTEL analysis
- 4.3. BCG Analysis
- 4.3.1. Stars (High Growth, High Market Share)
- 4.3.2. Cash Cows (Low Growth, High Market Share)
- 4.3.3. Question Mark (High Growth, Low Market Share)
- 4.3.4. Dogs (Low Growth, Low Market Share)
- 4.4. Ansoff Matrix Analysis
- 4.5. Supply Chain Analysis
- 4.6. Regulatory Landscape
- 4.7. Current Market Potential and Opportunity Assessment (TAM–SAM–SOM Framework)
- 4.8. TIR Analyst Note
- 4.1. Porters Five Forces
- 5. Market Analysis, Insights and Forecast 2021-2033
- 5.1. Market Analysis, Insights and Forecast - by Production Analysis
- 5.2. Market Analysis, Insights and Forecast - by Consumption Analysis
- 5.3. Market Analysis, Insights and Forecast - by Import Market Analysis (Value & Volume)
- 5.4. Market Analysis, Insights and Forecast - by Export Market Analysis (Value & Volume)
- 5.5. Market Analysis, Insights and Forecast - by Price Trend Analysis
- 5.6. Market Analysis, Insights and Forecast - by Region
- 5.6.1. North America
- 5.6.2. South America
- 5.6.3. Europe
- 5.6.4. Middle East & Africa
- 5.6.5. Asia Pacific
- 6. Global USA Microgreens Industry Analysis, Insights and Forecast, 2021-2033
- 6.1. Market Analysis, Insights and Forecast - by Production Analysis
- 6.2. Market Analysis, Insights and Forecast - by Consumption Analysis
- 6.3. Market Analysis, Insights and Forecast - by Import Market Analysis (Value & Volume)
- 6.4. Market Analysis, Insights and Forecast - by Export Market Analysis (Value & Volume)
- 6.5. Market Analysis, Insights and Forecast - by Price Trend Analysis
- 7. North America USA Microgreens Industry Analysis, Insights and Forecast, 2020-2032
- 7.1. Market Analysis, Insights and Forecast - by Production Analysis
- 7.2. Market Analysis, Insights and Forecast - by Consumption Analysis
- 7.3. Market Analysis, Insights and Forecast - by Import Market Analysis (Value & Volume)
- 7.4. Market Analysis, Insights and Forecast - by Export Market Analysis (Value & Volume)
- 7.5. Market Analysis, Insights and Forecast - by Price Trend Analysis
- 8. South America USA Microgreens Industry Analysis, Insights and Forecast, 2020-2032
- 8.1. Market Analysis, Insights and Forecast - by Production Analysis
- 8.2. Market Analysis, Insights and Forecast - by Consumption Analysis
- 8.3. Market Analysis, Insights and Forecast - by Import Market Analysis (Value & Volume)
- 8.4. Market Analysis, Insights and Forecast - by Export Market Analysis (Value & Volume)
- 8.5. Market Analysis, Insights and Forecast - by Price Trend Analysis
- 9. Europe USA Microgreens Industry Analysis, Insights and Forecast, 2020-2032
- 9.1. Market Analysis, Insights and Forecast - by Production Analysis
- 9.2. Market Analysis, Insights and Forecast - by Consumption Analysis
- 9.3. Market Analysis, Insights and Forecast - by Import Market Analysis (Value & Volume)
- 9.4. Market Analysis, Insights and Forecast - by Export Market Analysis (Value & Volume)
- 9.5. Market Analysis, Insights and Forecast - by Price Trend Analysis
- 10. Middle East & Africa USA Microgreens Industry Analysis, Insights and Forecast, 2020-2032
- 10.1. Market Analysis, Insights and Forecast - by Production Analysis
- 10.2. Market Analysis, Insights and Forecast - by Consumption Analysis
- 10.3. Market Analysis, Insights and Forecast - by Import Market Analysis (Value & Volume)
- 10.4. Market Analysis, Insights and Forecast - by Export Market Analysis (Value & Volume)
- 10.5. Market Analysis, Insights and Forecast - by Price Trend Analysis
- 11. Asia Pacific USA Microgreens Industry Analysis, Insights and Forecast, 2020-2032
- 11.1. Market Analysis, Insights and Forecast - by Production Analysis
- 11.2. Market Analysis, Insights and Forecast - by Consumption Analysis
- 11.3. Market Analysis, Insights and Forecast - by Import Market Analysis (Value & Volume)
- 11.4. Market Analysis, Insights and Forecast - by Export Market Analysis (Value & Volume)
- 11.5. Market Analysis, Insights and Forecast - by Price Trend Analysis
- 12. Competitive Analysis
- 12.1. Company Profiles
- 12.1.1 The Chef's Garden Inc
- 12.1.1.1. Company Overview
- 12.1.1.2. Products
- 12.1.1.3. Company Financials
- 12.1.1.4. SWOT Analysis
- 12.1.2 Quantum Microgreens
- 12.1.2.1. Company Overview
- 12.1.2.2. Products
- 12.1.2.3. Company Financials
- 12.1.2.4. SWOT Analysis
- 12.1.3 Metro Microgreens
- 12.1.3.1. Company Overview
- 12.1.3.2. Products
- 12.1.3.3. Company Financials
- 12.1.3.4. SWOT Analysis
- 12.1.4 Long Island Microgreens LL
- 12.1.4.1. Company Overview
- 12.1.4.2. Products
- 12.1.4.3. Company Financials
- 12.1.4.4. SWOT Analysis
- 12.1.5 Emerald Gardens
- 12.1.5.1. Company Overview
- 12.1.5.2. Products
- 12.1.5.3. Company Financials
- 12.1.5.4. SWOT Analysis
- 12.1.6 Fresh Origins
- 12.1.6.1. Company Overview
- 12.1.6.2. Products
- 12.1.6.3. Company Financials
- 12.1.6.4. SWOT Analysis
- 12.1.7 Florida Microgreens
- 12.1.7.1. Company Overview
- 12.1.7.2. Products
- 12.1.7.3. Company Financials
- 12.1.7.4. SWOT Analysis
- 12.1.8 Farmbox Greens LLC
- 12.1.8.1. Company Overview
- 12.1.8.2. Products
- 12.1.8.3. Company Financials
- 12.1.8.4. SWOT Analysis
- 12.1.9 Arizona Microgreens LLC
- 12.1.9.1. Company Overview
- 12.1.9.2. Products
- 12.1.9.3. Company Financials
- 12.1.9.4. SWOT Analysis
- 12.1.10 AeroFarms LLC
- 12.1.10.1. Company Overview
- 12.1.10.2. Products
- 12.1.10.3. Company Financials
- 12.1.10.4. SWOT Analysis
- 12.1.1 The Chef's Garden Inc
- 12.2. Market Entropy
- 12.2.1 Company's Key Areas Served
- 12.2.2 Recent Developments
- 12.3. Company Market Share Analysis 2025
- 12.3.1 Top 5 Companies Market Share Analysis
- 12.3.2 Top 3 Companies Market Share Analysis
- 12.4. List of Potential Customers
- 13. Research Methodology
List of Figures
- Figure 1: Global USA Microgreens Industry Revenue Breakdown (Million, %) by Region 2025 & 2033
- Figure 2: North America USA Microgreens Industry Revenue (Million), by Production Analysis 2025 & 2033
- Figure 3: North America USA Microgreens Industry Revenue Share (%), by Production Analysis 2025 & 2033
- Figure 4: North America USA Microgreens Industry Revenue (Million), by Consumption Analysis 2025 & 2033
- Figure 5: North America USA Microgreens Industry Revenue Share (%), by Consumption Analysis 2025 & 2033
- Figure 6: North America USA Microgreens Industry Revenue (Million), by Import Market Analysis (Value & Volume) 2025 & 2033
- Figure 7: North America USA Microgreens Industry Revenue Share (%), by Import Market Analysis (Value & Volume) 2025 & 2033
- Figure 8: North America USA Microgreens Industry Revenue (Million), by Export Market Analysis (Value & Volume) 2025 & 2033
- Figure 9: North America USA Microgreens Industry Revenue Share (%), by Export Market Analysis (Value & Volume) 2025 & 2033
- Figure 10: North America USA Microgreens Industry Revenue (Million), by Price Trend Analysis 2025 & 2033
- Figure 11: North America USA Microgreens Industry Revenue Share (%), by Price Trend Analysis 2025 & 2033
- Figure 12: North America USA Microgreens Industry Revenue (Million), by Country 2025 & 2033
- Figure 13: North America USA Microgreens Industry Revenue Share (%), by Country 2025 & 2033
- Figure 14: South America USA Microgreens Industry Revenue (Million), by Production Analysis 2025 & 2033
- Figure 15: South America USA Microgreens Industry Revenue Share (%), by Production Analysis 2025 & 2033
- Figure 16: South America USA Microgreens Industry Revenue (Million), by Consumption Analysis 2025 & 2033
- Figure 17: South America USA Microgreens Industry Revenue Share (%), by Consumption Analysis 2025 & 2033
- Figure 18: South America USA Microgreens Industry Revenue (Million), by Import Market Analysis (Value & Volume) 2025 & 2033
- Figure 19: South America USA Microgreens Industry Revenue Share (%), by Import Market Analysis (Value & Volume) 2025 & 2033
- Figure 20: South America USA Microgreens Industry Revenue (Million), by Export Market Analysis (Value & Volume) 2025 & 2033
- Figure 21: South America USA Microgreens Industry Revenue Share (%), by Export Market Analysis (Value & Volume) 2025 & 2033
- Figure 22: South America USA Microgreens Industry Revenue (Million), by Price Trend Analysis 2025 & 2033
- Figure 23: South America USA Microgreens Industry Revenue Share (%), by Price Trend Analysis 2025 & 2033
- Figure 24: South America USA Microgreens Industry Revenue (Million), by Country 2025 & 2033
- Figure 25: South America USA Microgreens Industry Revenue Share (%), by Country 2025 & 2033
- Figure 26: Europe USA Microgreens Industry Revenue (Million), by Production Analysis 2025 & 2033
- Figure 27: Europe USA Microgreens Industry Revenue Share (%), by Production Analysis 2025 & 2033
- Figure 28: Europe USA Microgreens Industry Revenue (Million), by Consumption Analysis 2025 & 2033
- Figure 29: Europe USA Microgreens Industry Revenue Share (%), by Consumption Analysis 2025 & 2033
- Figure 30: Europe USA Microgreens Industry Revenue (Million), by Import Market Analysis (Value & Volume) 2025 & 2033
- Figure 31: Europe USA Microgreens Industry Revenue Share (%), by Import Market Analysis (Value & Volume) 2025 & 2033
- Figure 32: Europe USA Microgreens Industry Revenue (Million), by Export Market Analysis (Value & Volume) 2025 & 2033
- Figure 33: Europe USA Microgreens Industry Revenue Share (%), by Export Market Analysis (Value & Volume) 2025 & 2033
- Figure 34: Europe USA Microgreens Industry Revenue (Million), by Price Trend Analysis 2025 & 2033
- Figure 35: Europe USA Microgreens Industry Revenue Share (%), by Price Trend Analysis 2025 & 2033
- Figure 36: Europe USA Microgreens Industry Revenue (Million), by Country 2025 & 2033
- Figure 37: Europe USA Microgreens Industry Revenue Share (%), by Country 2025 & 2033
- Figure 38: Middle East & Africa USA Microgreens Industry Revenue (Million), by Production Analysis 2025 & 2033
- Figure 39: Middle East & Africa USA Microgreens Industry Revenue Share (%), by Production Analysis 2025 & 2033
- Figure 40: Middle East & Africa USA Microgreens Industry Revenue (Million), by Consumption Analysis 2025 & 2033
- Figure 41: Middle East & Africa USA Microgreens Industry Revenue Share (%), by Consumption Analysis 2025 & 2033
- Figure 42: Middle East & Africa USA Microgreens Industry Revenue (Million), by Import Market Analysis (Value & Volume) 2025 & 2033
- Figure 43: Middle East & Africa USA Microgreens Industry Revenue Share (%), by Import Market Analysis (Value & Volume) 2025 & 2033
- Figure 44: Middle East & Africa USA Microgreens Industry Revenue (Million), by Export Market Analysis (Value & Volume) 2025 & 2033
- Figure 45: Middle East & Africa USA Microgreens Industry Revenue Share (%), by Export Market Analysis (Value & Volume) 2025 & 2033
- Figure 46: Middle East & Africa USA Microgreens Industry Revenue (Million), by Price Trend Analysis 2025 & 2033
- Figure 47: Middle East & Africa USA Microgreens Industry Revenue Share (%), by Price Trend Analysis 2025 & 2033
- Figure 48: Middle East & Africa USA Microgreens Industry Revenue (Million), by Country 2025 & 2033
- Figure 49: Middle East & Africa USA Microgreens Industry Revenue Share (%), by Country 2025 & 2033
- Figure 50: Asia Pacific USA Microgreens Industry Revenue (Million), by Production Analysis 2025 & 2033
- Figure 51: Asia Pacific USA Microgreens Industry Revenue Share (%), by Production Analysis 2025 & 2033
- Figure 52: Asia Pacific USA Microgreens Industry Revenue (Million), by Consumption Analysis 2025 & 2033
- Figure 53: Asia Pacific USA Microgreens Industry Revenue Share (%), by Consumption Analysis 2025 & 2033
- Figure 54: Asia Pacific USA Microgreens Industry Revenue (Million), by Import Market Analysis (Value & Volume) 2025 & 2033
- Figure 55: Asia Pacific USA Microgreens Industry Revenue Share (%), by Import Market Analysis (Value & Volume) 2025 & 2033
- Figure 56: Asia Pacific USA Microgreens Industry Revenue (Million), by Export Market Analysis (Value & Volume) 2025 & 2033
- Figure 57: Asia Pacific USA Microgreens Industry Revenue Share (%), by Export Market Analysis (Value & Volume) 2025 & 2033
- Figure 58: Asia Pacific USA Microgreens Industry Revenue (Million), by Price Trend Analysis 2025 & 2033
- Figure 59: Asia Pacific USA Microgreens Industry Revenue Share (%), by Price Trend Analysis 2025 & 2033
- Figure 60: Asia Pacific USA Microgreens Industry Revenue (Million), by Country 2025 & 2033
- Figure 61: Asia Pacific USA Microgreens Industry Revenue Share (%), by Country 2025 & 2033
List of Tables
- Table 1: Global USA Microgreens Industry Revenue Million Forecast, by Production Analysis 2020 & 2033
- Table 2: Global USA Microgreens Industry Revenue Million Forecast, by Consumption Analysis 2020 & 2033
- Table 3: Global USA Microgreens Industry Revenue Million Forecast, by Import Market Analysis (Value & Volume) 2020 & 2033
- Table 4: Global USA Microgreens Industry Revenue Million Forecast, by Export Market Analysis (Value & Volume) 2020 & 2033
- Table 5: Global USA Microgreens Industry Revenue Million Forecast, by Price Trend Analysis 2020 & 2033
- Table 6: Global USA Microgreens Industry Revenue Million Forecast, by Region 2020 & 2033
- Table 7: Global USA Microgreens Industry Revenue Million Forecast, by Production Analysis 2020 & 2033
- Table 8: Global USA Microgreens Industry Revenue Million Forecast, by Consumption Analysis 2020 & 2033
- Table 9: Global USA Microgreens Industry Revenue Million Forecast, by Import Market Analysis (Value & Volume) 2020 & 2033
- Table 10: Global USA Microgreens Industry Revenue Million Forecast, by Export Market Analysis (Value & Volume) 2020 & 2033
- Table 11: Global USA Microgreens Industry Revenue Million Forecast, by Price Trend Analysis 2020 & 2033
- Table 12: Global USA Microgreens Industry Revenue Million Forecast, by Country 2020 & 2033
- Table 13: United States USA Microgreens Industry Revenue (Million) Forecast, by Application 2020 & 2033
- Table 14: Canada USA Microgreens Industry Revenue (Million) Forecast, by Application 2020 & 2033
- Table 15: Mexico USA Microgreens Industry Revenue (Million) Forecast, by Application 2020 & 2033
- Table 16: Global USA Microgreens Industry Revenue Million Forecast, by Production Analysis 2020 & 2033
- Table 17: Global USA Microgreens Industry Revenue Million Forecast, by Consumption Analysis 2020 & 2033
- Table 18: Global USA Microgreens Industry Revenue Million Forecast, by Import Market Analysis (Value & Volume) 2020 & 2033
- Table 19: Global USA Microgreens Industry Revenue Million Forecast, by Export Market Analysis (Value & Volume) 2020 & 2033
- Table 20: Global USA Microgreens Industry Revenue Million Forecast, by Price Trend Analysis 2020 & 2033
- Table 21: Global USA Microgreens Industry Revenue Million Forecast, by Country 2020 & 2033
- Table 22: Brazil USA Microgreens Industry Revenue (Million) Forecast, by Application 2020 & 2033
- Table 23: Argentina USA Microgreens Industry Revenue (Million) Forecast, by Application 2020 & 2033
- Table 24: Rest of South America USA Microgreens Industry Revenue (Million) Forecast, by Application 2020 & 2033
- Table 25: Global USA Microgreens Industry Revenue Million Forecast, by Production Analysis 2020 & 2033
- Table 26: Global USA Microgreens Industry Revenue Million Forecast, by Consumption Analysis 2020 & 2033
- Table 27: Global USA Microgreens Industry Revenue Million Forecast, by Import Market Analysis (Value & Volume) 2020 & 2033
- Table 28: Global USA Microgreens Industry Revenue Million Forecast, by Export Market Analysis (Value & Volume) 2020 & 2033
- Table 29: Global USA Microgreens Industry Revenue Million Forecast, by Price Trend Analysis 2020 & 2033
- Table 30: Global USA Microgreens Industry Revenue Million Forecast, by Country 2020 & 2033
- Table 31: United Kingdom USA Microgreens Industry Revenue (Million) Forecast, by Application 2020 & 2033
- Table 32: Germany USA Microgreens Industry Revenue (Million) Forecast, by Application 2020 & 2033
- Table 33: France USA Microgreens Industry Revenue (Million) Forecast, by Application 2020 & 2033
- Table 34: Italy USA Microgreens Industry Revenue (Million) Forecast, by Application 2020 & 2033
- Table 35: Spain USA Microgreens Industry Revenue (Million) Forecast, by Application 2020 & 2033
- Table 36: Russia USA Microgreens Industry Revenue (Million) Forecast, by Application 2020 & 2033
- Table 37: Benelux USA Microgreens Industry Revenue (Million) Forecast, by Application 2020 & 2033
- Table 38: Nordics USA Microgreens Industry Revenue (Million) Forecast, by Application 2020 & 2033
- Table 39: Rest of Europe USA Microgreens Industry Revenue (Million) Forecast, by Application 2020 & 2033
- Table 40: Global USA Microgreens Industry Revenue Million Forecast, by Production Analysis 2020 & 2033
- Table 41: Global USA Microgreens Industry Revenue Million Forecast, by Consumption Analysis 2020 & 2033
- Table 42: Global USA Microgreens Industry Revenue Million Forecast, by Import Market Analysis (Value & Volume) 2020 & 2033
- Table 43: Global USA Microgreens Industry Revenue Million Forecast, by Export Market Analysis (Value & Volume) 2020 & 2033
- Table 44: Global USA Microgreens Industry Revenue Million Forecast, by Price Trend Analysis 2020 & 2033
- Table 45: Global USA Microgreens Industry Revenue Million Forecast, by Country 2020 & 2033
- Table 46: Turkey USA Microgreens Industry Revenue (Million) Forecast, by Application 2020 & 2033
- Table 47: Israel USA Microgreens Industry Revenue (Million) Forecast, by Application 2020 & 2033
- Table 48: GCC USA Microgreens Industry Revenue (Million) Forecast, by Application 2020 & 2033
- Table 49: North Africa USA Microgreens Industry Revenue (Million) Forecast, by Application 2020 & 2033
- Table 50: South Africa USA Microgreens Industry Revenue (Million) Forecast, by Application 2020 & 2033
- Table 51: Rest of Middle East & Africa USA Microgreens Industry Revenue (Million) Forecast, by Application 2020 & 2033
- Table 52: Global USA Microgreens Industry Revenue Million Forecast, by Production Analysis 2020 & 2033
- Table 53: Global USA Microgreens Industry Revenue Million Forecast, by Consumption Analysis 2020 & 2033
- Table 54: Global USA Microgreens Industry Revenue Million Forecast, by Import Market Analysis (Value & Volume) 2020 & 2033
- Table 55: Global USA Microgreens Industry Revenue Million Forecast, by Export Market Analysis (Value & Volume) 2020 & 2033
- Table 56: Global USA Microgreens Industry Revenue Million Forecast, by Price Trend Analysis 2020 & 2033
- Table 57: Global USA Microgreens Industry Revenue Million Forecast, by Country 2020 & 2033
- Table 58: China USA Microgreens Industry Revenue (Million) Forecast, by Application 2020 & 2033
- Table 59: India USA Microgreens Industry Revenue (Million) Forecast, by Application 2020 & 2033
- Table 60: Japan USA Microgreens Industry Revenue (Million) Forecast, by Application 2020 & 2033
- Table 61: South Korea USA Microgreens Industry Revenue (Million) Forecast, by Application 2020 & 2033
- Table 62: ASEAN USA Microgreens Industry Revenue (Million) Forecast, by Application 2020 & 2033
- Table 63: Oceania USA Microgreens Industry Revenue (Million) Forecast, by Application 2020 & 2033
- Table 64: Rest of Asia Pacific USA Microgreens Industry Revenue (Million) Forecast, by Application 2020 & 2033
Frequently Asked Questions
1. What is the projected Compound Annual Growth Rate (CAGR) of the USA Microgreens Industry?
The projected CAGR is approximately 10.60%.
2. Which companies are prominent players in the USA Microgreens Industry?
Key companies in the market include The Chef's Garden Inc, Quantum Microgreens, Metro Microgreens, Long Island Microgreens LL, Emerald Gardens, Fresh Origins, Florida Microgreens, Farmbox Greens LLC, Arizona Microgreens LLC, AeroFarms LLC.
3. What are the main segments of the USA Microgreens Industry?
The market segments include Production Analysis, Consumption Analysis, Import Market Analysis (Value & Volume), Export Market Analysis (Value & Volume), Price Trend Analysis.
4. Can you provide details about the market size?
The market size is estimated to be USD 1.74 Million as of 2022.
5. What are some drivers contributing to market growth?
Need for Custom Product Development; Use of CROs for Regulatory Services.
6. What are the notable trends driving market growth?
Increased Investments in Vertical Farming Domain.
7. Are there any restraints impacting market growth?
Data and Cyber Security Concerns; Lack of Experts and Professionals in this Industry.
8. Can you provide examples of recent developments in the market?
September 2022: To meet increased customer demand, AeroFarmsDanville VA established the world's largest Aeroponic Smart Farm with the newest Indoor Vertical Farm capable of growing over 3 million lb of fresh leafy greens annually.
9. What pricing options are available for accessing the report?
Pricing options include single-user, multi-user, and enterprise licenses priced at USD 3800, USD 4500, and USD 5800 respectively.
10. Is the market size provided in terms of value or volume?
The market size is provided in terms of value, measured in Million.
11. Are there any specific market keywords associated with the report?
Yes, the market keyword associated with the report is "USA Microgreens Industry," which aids in identifying and referencing the specific market segment covered.
12. How do I determine which pricing option suits my needs best?
The pricing options vary based on user requirements and access needs. Individual users may opt for single-user licenses, while businesses requiring broader access may choose multi-user or enterprise licenses for cost-effective access to the report.
13. Are there any additional resources or data provided in the USA Microgreens Industry report?
While the report offers comprehensive insights, it's advisable to review the specific contents or supplementary materials provided to ascertain if additional resources or data are available.
14. How can I stay updated on further developments or reports in the USA Microgreens Industry?
To stay informed about further developments, trends, and reports in the USA Microgreens Industry, consider subscribing to industry newsletters, following relevant companies and organizations, or regularly checking reputable industry news sources and publications.
Methodology
Step 1 - Identification of Relevant Samples Size from Population Database


Step 2 - Approaches for Defining Global Market Size (Value, Volume* & Price*)

Note*: In applicable scenarios
Step 3 - Data Sources
Primary Research
- Web Analytics
- Survey Reports
- Research Institute
- Latest Research Reports
- Opinion Leaders
Secondary Research
- Annual Reports
- White Paper
- Latest Press Release
- Industry Association
- Paid Database
- Investor Presentations

Step 4 - Data Triangulation
Involves using different sources of information in order to increase the validity of a study
These sources are likely to be stakeholders in a program - participants, other researchers, program staff, other community members, and so on.
Then we put all data in single framework & apply various statistical tools to find out the dynamic on the market.
During the analysis stage, feedback from the stakeholder groups would be compared to determine areas of agreement as well as areas of divergence