

Key Insights
The global Vehicle Under-the-hood Electronic market is poised for significant expansion, projected to reach USD 14.18 billion by 2025, exhibiting a robust Compound Annual Growth Rate (CAGR) of 9.7% throughout the forecast period of 2025-2033. This substantial growth is primarily fueled by the escalating demand for advanced driver-assistance systems (ADAS), increased vehicle electrification, and the continuous integration of sophisticated control modules and sensors to enhance vehicle performance, safety, and fuel efficiency. The automotive industry's relentless pursuit of innovation, driven by stringent emission regulations and consumer expectations for smarter, more connected vehicles, acts as a powerful catalyst for this market's upward trajectory. As manufacturers invest heavily in research and development to incorporate cutting-edge technologies within the engine bay and other critical under-the-hood components, the market for these specialized electronics is set to flourish.
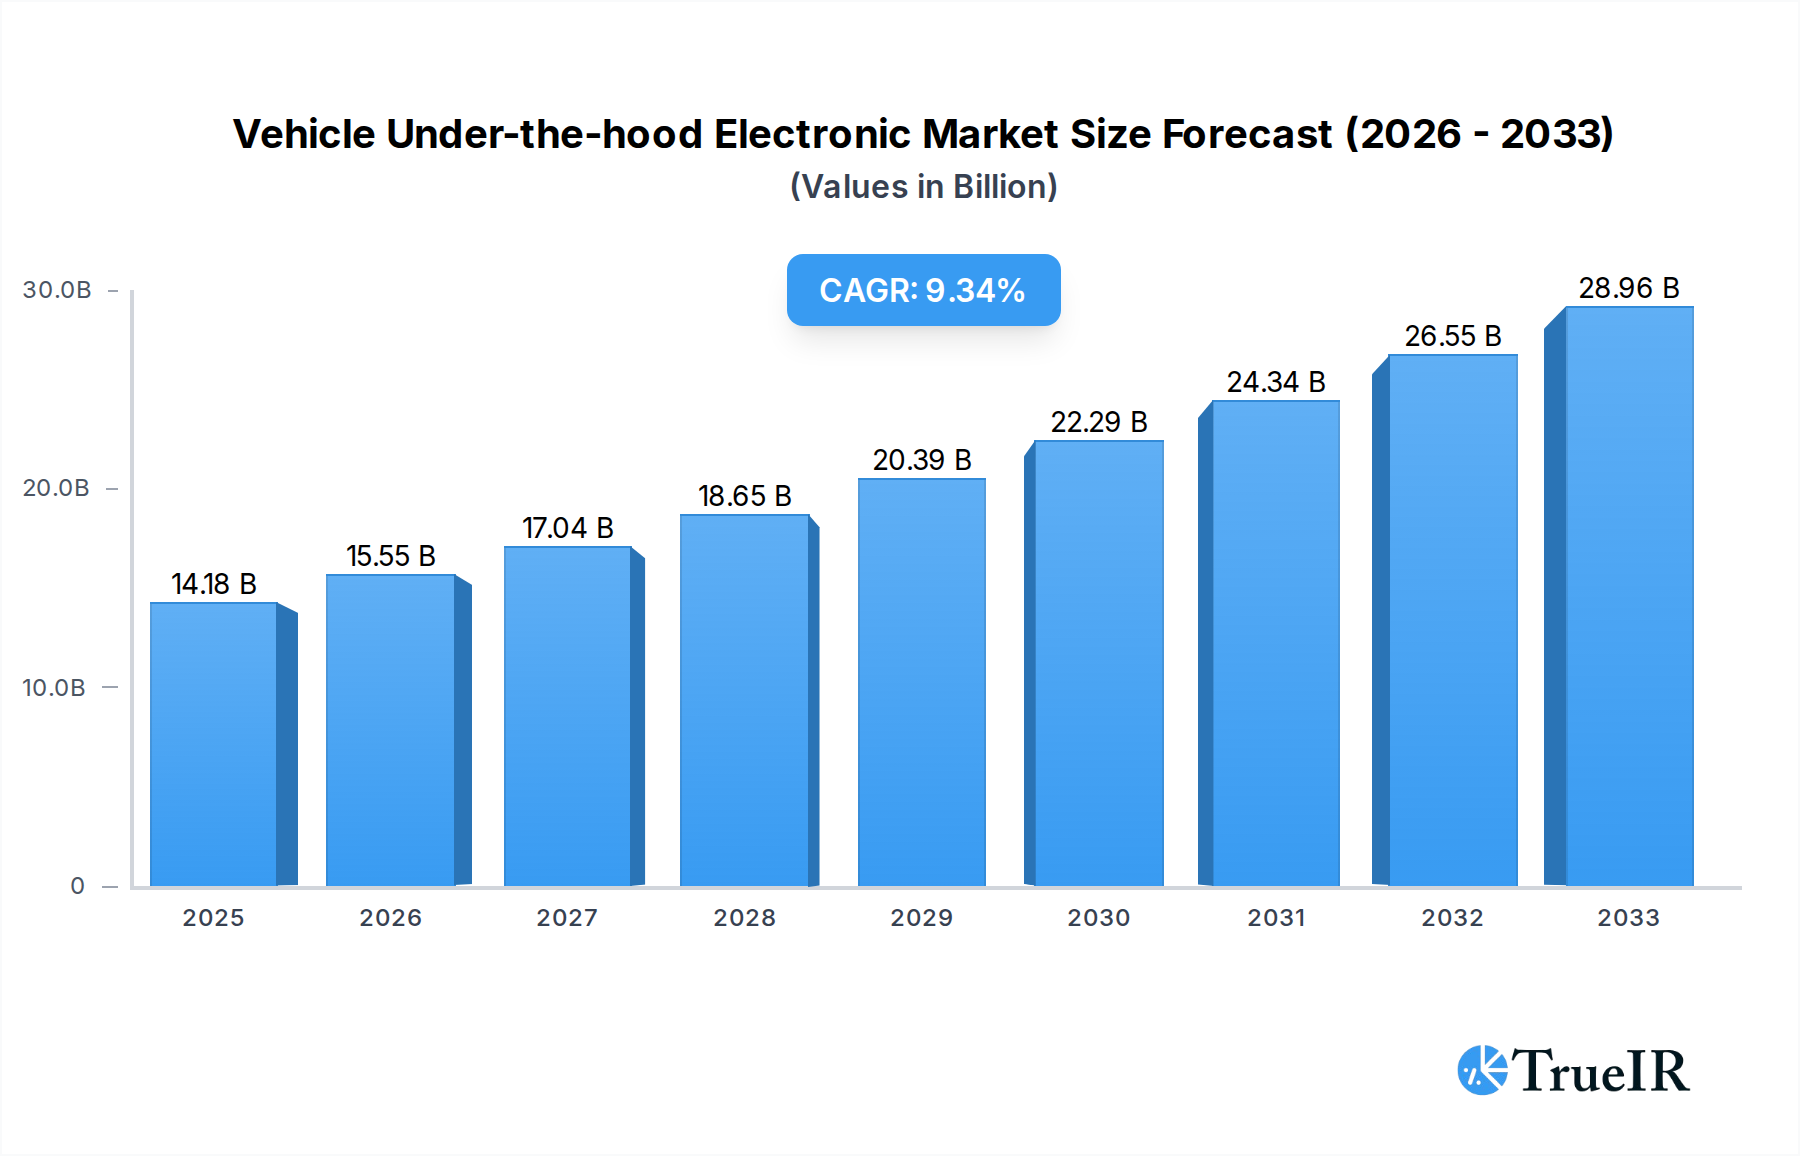
Vehicle Under-the-hood Electronic Market Size (In Billion)
The market's dynamism is further shaped by evolving trends such as the shift towards autonomous driving, the growing complexity of powertrain management systems, and the increasing adoption of electric and hybrid vehicles, which necessitate specialized electronic components for battery management, motor control, and thermal regulation. While the market demonstrates a clear upward trend, potential restraints could emerge from the escalating costs of raw materials, global supply chain vulnerabilities, and the intricate challenges associated with ensuring the reliability and durability of electronic components in harsh under-the-hood environments. However, the persistent drive for miniaturization, enhanced processing power, and greater energy efficiency in electronic solutions is expected to mitigate these challenges, paving the way for sustained market dominance by key industry players. The Passenger Cars segment, alongside Light and Heavy Trucks, will continue to be major application areas, with Automotive Under the Hood Control Modules and ECUs, and Automotive Under the Hood Sensors forming the core of technological advancements.

Vehicle Under-the-hood Electronic Company Market Share
Unlocking the Future of Automotive Performance: The Dynamic Vehicle Under-the-Hood Electronic Market Report
This comprehensive report dives deep into the rapidly evolving Vehicle Under-the-hood Electronic market, providing critical insights for stakeholders seeking to navigate this high-growth sector. With a projected market size of over $300 billion by 2033, this analysis offers a data-driven roadmap to understanding market dynamics, identifying lucrative opportunities, and strategizing for success. The report meticulously examines the intricate interplay of technological advancements, stringent regulations, and shifting consumer preferences that are reshaping the automotive landscape. Discover the key players, dominant segments, and future trajectory of this essential automotive component market.
Vehicle Under-the-hood Electronic Market Structure & Competitive Landscape
The Vehicle Under-the-hood Electronic market is characterized by a moderate to high level of concentration, with major global players like Bosch, Continental, Denso, Delphi, and Hitachi holding significant market shares. Innovation is a primary driver, fueled by the relentless pursuit of enhanced fuel efficiency, reduced emissions, and improved vehicle performance. The burgeoning demand for advanced driver-assistance systems (ADAS), electrification, and connected car technologies necessitates continuous research and development in sophisticated electronic control units (ECUs) and a diverse range of sensors. Regulatory impacts, particularly stringent emissions standards and safety mandates worldwide, are also shaping product development and market entry strategies. Product substitutes, while evolving, are largely confined to incremental improvements within existing electronic architectures rather than complete replacements of core under-the-hood electronic systems. End-user segmentation primarily includes passenger cars, light trucks, and heavy trucks, each with distinct performance and regulatory demands. Mergers and acquisitions (M&A) trends indicate a strategic consolidation, with companies acquiring smaller, specialized technology firms to bolster their portfolios and gain a competitive edge. Over the historical period (2019-2024), an estimated $150 billion in M&A activity has occurred, reflecting the dynamic nature of this market. Concentration ratios among the top five players are estimated to be around 65%, underscoring the competitive intensity.
Vehicle Under-the-hood Electronic Market Trends & Opportunities
The Vehicle Under-the-hood Electronic market is poised for significant expansion, driven by a confluence of technological innovation, increasing vehicle complexity, and evolving automotive paradigms. The market size is projected to grow from an estimated $180 billion in the base year 2025 to over $300 billion by the end of the forecast period in 2033, exhibiting a compound annual growth rate (CAGR) of approximately 6.5%. This robust growth is underpinned by several key trends. The accelerating adoption of electric vehicles (EVs) and hybrid electric vehicles (HEVs) is a major catalyst, demanding sophisticated battery management systems, power electronics, and thermal management ECUs, representing a market segment projected to exceed $100 billion in value by 2033. Furthermore, the pervasive integration of advanced driver-assistance systems (ADAS) and autonomous driving technologies is necessitating an exponential increase in the number and complexity of under-the-hood sensors and control modules, including radar, lidar, and camera processing units. These systems are crucial for functionalities like adaptive cruise control, lane keeping assist, and automatic emergency braking, contributing an estimated $70 billion to the market by 2033.
Consumer preferences are increasingly leaning towards vehicles that offer enhanced safety, connectivity, and personalized driving experiences, all of which are directly supported by advanced under-the-hood electronics. The demand for over-the-air (OTA) updates for vehicle software also requires robust and secure electronic architectures. From a competitive perspective, the market is witnessing a shift towards deeper integration and system-level solutions. Tier 1 suppliers are increasingly offering complete electronic modules rather than individual components, providing greater value to Original Equipment Manufacturers (OEMs). The rise of new entrants, particularly in the semiconductor and software domains, is also intensifying competition, pushing established players to innovate at an accelerated pace. Market penetration rates for advanced electronic features are steadily increasing across all vehicle segments, with passenger cars leading the charge. The "Other" segment, encompassing specialized vehicles and industrial applications, also presents untapped opportunities as electrification and automation find their way into these niche markets. The ongoing evolution of vehicle platforms, from internal combustion engines (ICE) to fully electric powertrains, is a fundamental shift that will continue to redefine the requirements and market potential for under-the-hood electronics throughout the study period.
Dominant Markets & Segments in Vehicle Under-the-hood Electronic
The Vehicle Under-the-hood Electronic market exhibits distinct patterns of dominance across various geographical regions and product segments.
Regional Dominance:
- Asia-Pacific: This region is projected to remain the largest and fastest-growing market for vehicle under-the-hood electronics throughout the forecast period.
- Growth Drivers: Strong automotive manufacturing hubs in China, Japan, South Korea, and India, coupled with increasing disposable incomes and a growing middle class driving vehicle sales. Government initiatives promoting electric vehicle adoption and stringent emissions standards further bolster demand. The sheer volume of vehicle production makes this region a powerhouse.
- North America: A significant market characterized by a strong demand for SUVs, light trucks, and technologically advanced vehicles.
- Growth Drivers: Robust adoption of ADAS features, increasing focus on vehicle safety and emissions regulations, and a well-established automotive aftermarket. The presence of major OEMs and a mature supplier ecosystem contribute to its dominance.
- Europe: A mature market with a strong emphasis on advanced technologies, electrification, and stringent environmental regulations.
- Growth Drivers: Leading adoption of electric and hybrid vehicles, stringent Euro 7 emissions standards, and a high consumer demand for premium features and advanced safety systems. The presence of prominent European automakers and component suppliers solidifies its position.
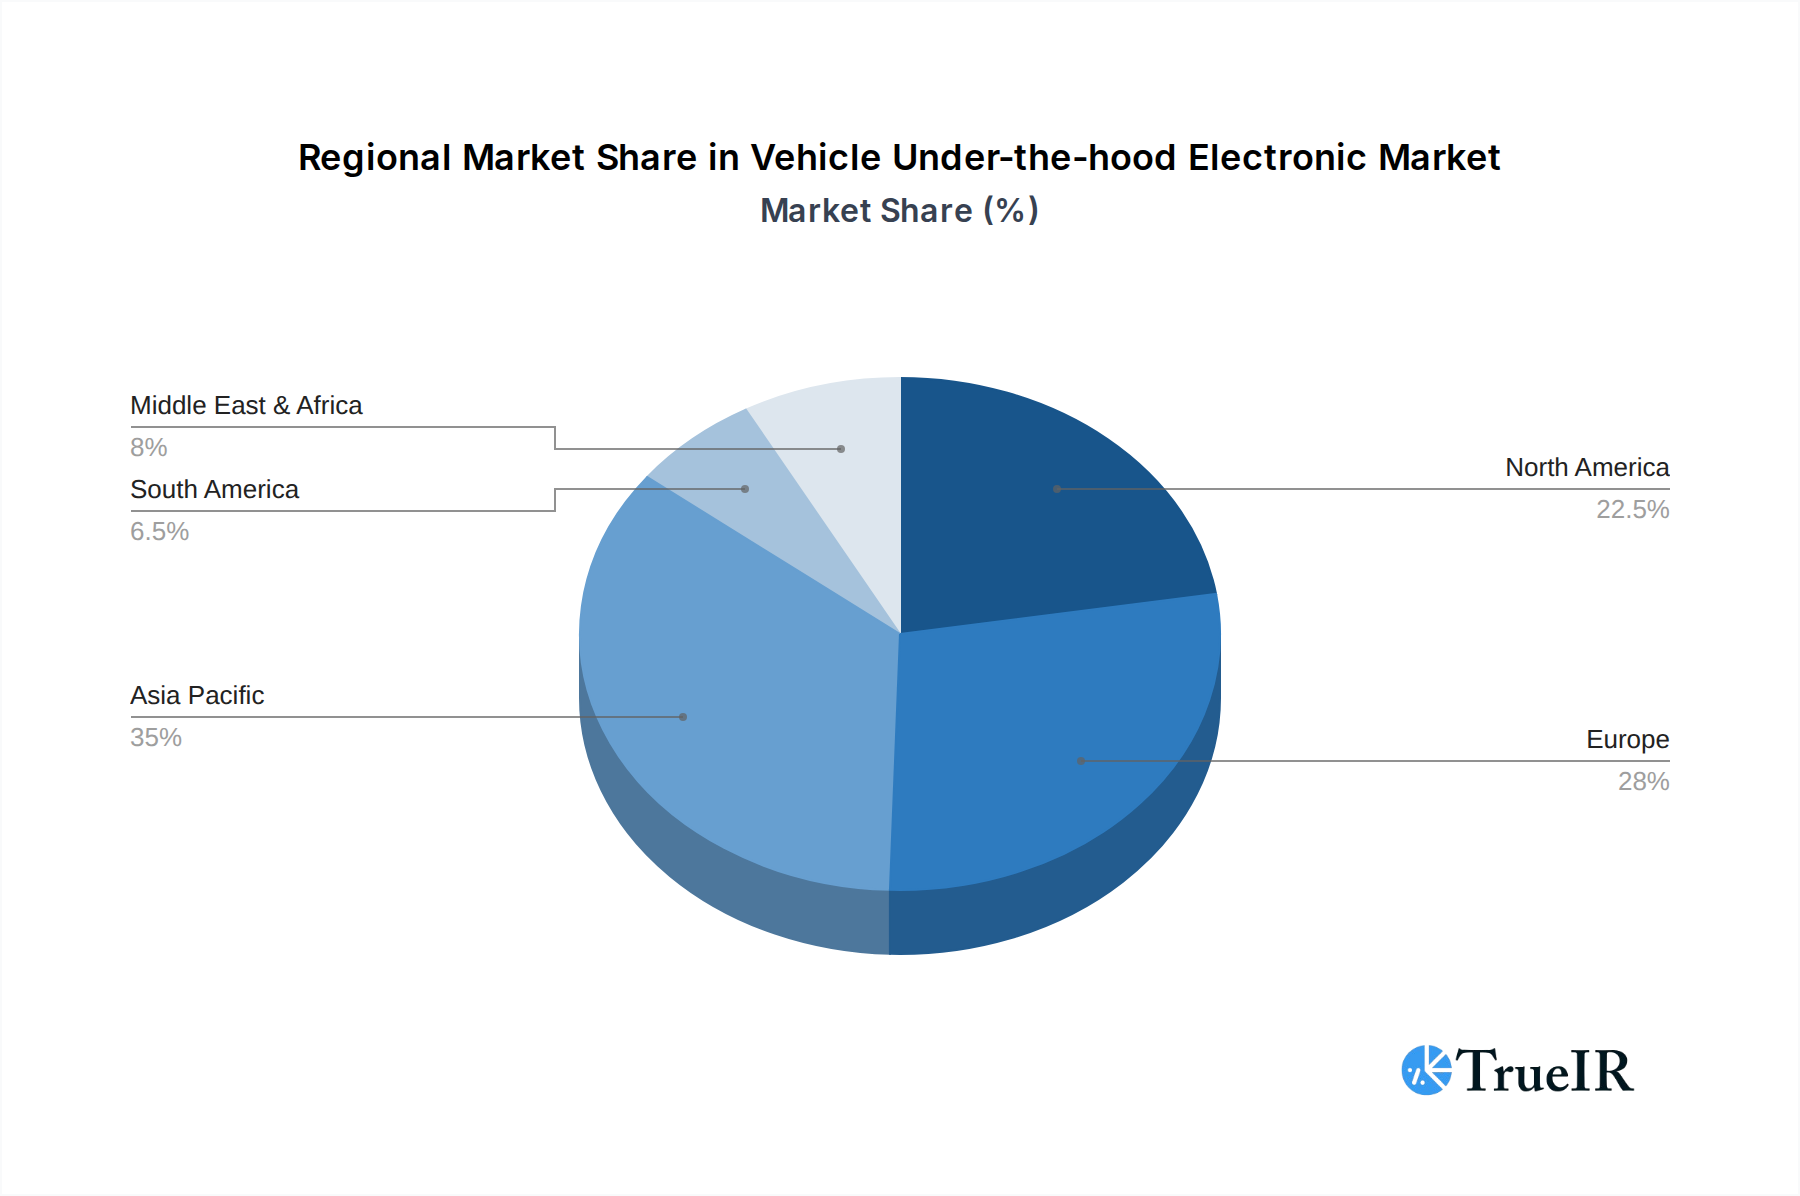
Vehicle Under-the-hood Electronic Regional Market Share
Segment Dominance:
Application:
- Passenger Cars: This segment will continue to dominate the Vehicle Under-the-hood Electronic market.
- Market Dominance: High production volumes globally, coupled with a strong consumer demand for advanced features like infotainment, connectivity, ADAS, and powertrain efficiency. The push for electrification and stricter emission norms in passenger vehicles directly translates to increased demand for sophisticated ECUs and sensors. The market for passenger car under-the-hood electronics is projected to reach over $180 billion by 2033.
- Light Truck: Experiencing robust growth due to increasing utility vehicle sales and the integration of advanced technologies.
- Market Dominance: The growing popularity of SUVs and pickup trucks, combined with their increasing feature sets and performance expectations, drives demand for specialized under-the-hood electronics. These vehicles are increasingly equipped with advanced powertrain controls and safety systems.
- Heavy Truck: A critical segment for emissions control and advanced diagnostics.
- Market Dominance: Stringent emissions regulations for commercial vehicles worldwide necessitate sophisticated engine management systems, after-treatment controls, and telematics. The growth of e-commerce and logistics further fuels demand for efficient and reliable heavy-duty vehicles.
- Others: Encompasses specialized vehicles, industrial applications, and off-road machinery.
- Market Dominance: While smaller in volume, this segment presents niche growth opportunities driven by electrification and automation in sectors like agriculture and construction.
Types:
- Automotive Under the Hood Control Modules and ECUs: This category represents the largest and most dynamic segment.
- Market Dominance: The increasing complexity of vehicle functions, from engine management and transmission control to ADAS and battery management, requires a proliferation of sophisticated ECUs. The shift towards centralized computing architectures and domain controllers further amplifies the importance of this segment. The market for control modules and ECUs is estimated to reach over $190 billion by 2033.
- Automotive Under the Hood Sensors: Essential for gathering real-time data to enable intelligent control and safety functions.
- Market Dominance: The exponential growth in ADAS and autonomous driving technologies directly fuels the demand for a wider array of advanced sensors, including radar, lidar, cameras, and various environmental and powertrain sensors. These sensors are critical for modern vehicle safety and performance. The sensor segment is anticipated to grow to over $110 billion by 2033.
Vehicle Under-the-hood Electronic Product Analysis
The Vehicle Under-the-hood Electronic market is witnessing a surge in product innovations focused on enhancing efficiency, safety, and connectivity. Key advancements include the development of more powerful and energy-efficient ECUs capable of processing vast amounts of data from an ever-increasing sensor suite. Innovations in sensor technology are yielding smaller, more robust, and highly accurate sensors for critical applications such as advanced driver-assistance systems (ADAS), powertrain management, and thermal management. The trend towards electrification is driving the development of specialized power electronics and battery management systems. Competitive advantages lie in the ability to offer integrated system solutions, robust cybersecurity features, and compliance with increasingly stringent automotive standards. Technological advancements are directly translating into improved vehicle performance, reduced emissions, and enhanced safety for end-users.
Key Drivers, Barriers & Challenges in Vehicle Under-the-hood Electronic
Key Drivers:
The Vehicle Under-the-hood Electronic market is propelled by several significant drivers. The escalating demand for electrified and autonomous vehicles is a primary catalyst, necessitating advanced ECUs and sensors for powertrain control, battery management, and ADAS functionalities. Stringent global emissions regulations (e.g., Euro 7) are forcing OEMs to implement more sophisticated engine management and exhaust after-treatment systems, driving innovation in electronic controls. The increasing integration of connectivity features and the development of smart mobility solutions further expand the scope of under-the-hood electronics required for communication and data processing. Consumer desire for enhanced safety and comfort features, such as advanced driver-assistance systems and adaptive cruise control, directly translates into increased demand for specialized electronic components.
Barriers & Challenges:
Despite strong growth, the market faces significant challenges. The complexity of modern vehicle electronics leads to longer development cycles and higher R&D costs for manufacturers. Supply chain disruptions, particularly for critical semiconductor components, can lead to production delays and increased costs, as evidenced by recent global shortages impacting the automotive industry. Navigating diverse and evolving regulatory landscapes across different regions adds complexity to product development and market entry strategies. The constant threat of cybersecurity breaches requires continuous investment in robust security solutions for connected vehicles. Furthermore, intense price competition among suppliers, especially for high-volume components, puts pressure on profit margins.
Growth Drivers in the Vehicle Under-the-hood Electronic Market
The Vehicle Under-the-hood Electronic market's growth is primarily fueled by technological advancements, economic shifts, and policy mandates. The accelerating transition towards electric and hybrid vehicles necessitates sophisticated electronic systems for battery management, power electronics, and thermal control, representing a substantial growth opportunity. Increasingly stringent global emissions standards are compelling automakers to adopt more advanced engine management systems and exhaust after-treatment technologies, directly driving demand for specialized ECUs and sensors. The pervasive integration of Advanced Driver-Assistance Systems (ADAS) and the pursuit of autonomous driving capabilities are creating immense demand for a wide array of high-performance sensors and powerful processing units. Economic factors, such as rising disposable incomes in emerging markets, are contributing to increased vehicle sales, thereby expanding the overall market for automotive electronics.
Challenges Impacting Vehicle Under-the-hood Electronic Growth
The Vehicle Under-the-hood Electronic market grapples with several critical challenges that can impede its growth trajectory. Supply chain volatility, particularly the shortage of crucial semiconductor components, has been a persistent issue, leading to production bottlenecks and increased lead times. Regulatory complexities and the ever-evolving nature of global emissions and safety standards require continuous adaptation and significant investment in R&D. The intense competitive pressure among established Tier 1 suppliers and emerging technology companies can lead to price erosion and reduced profit margins. Furthermore, the escalating threat of cybersecurity vulnerabilities in connected vehicles necessitates robust security measures, adding to development costs and complexity. The high cost of research and development for advanced electronic systems and the long development cycles inherent in the automotive industry also present a significant barrier.
Key Players Shaping the Vehicle Under-the-hood Electronic Market
- Bosch
- Continental
- Denso
- Delphi Technologies (now part of BorgWarner)
- Hitachi Automotive Systems
- Hyundai KEFICO
- Infineon Technologies
- NGK Spark Plug Co., Ltd.
- Panasonic Corporation
- Stoneridge, Inc.
Significant Vehicle Under-the-hood Electronic Industry Milestones
- 2019: Introduction of Level 3 autonomous driving systems in select production vehicles, increasing demand for advanced sensors and processing ECUs.
- 2020: Major OEMs announce accelerated timelines for EV production, signaling a significant shift in under-the-hood electronic requirements.
- 2021: Global semiconductor shortage intensifies, highlighting the critical reliance on chip manufacturers and impacting automotive production worldwide.
- 2022: Increased investment in in-house chip development by automotive giants to mitigate future supply chain risks.
- 2023: Advancements in solid-state LiDAR technology promise more compact and cost-effective sensing solutions for autonomous vehicles.
- 2024: Emerging trends in vehicle software-defined architectures begin to consolidate control modules and increase the importance of central computing platforms.
- 2025 (Estimated): Widespread adoption of 48V mild-hybrid systems becomes standard across many vehicle platforms, driving demand for associated power electronics.
- 2026 (Projected): Standardization of certain ADAS functionalities across different OEMs to improve consumer understanding and adoption rates.
- 2028 (Projected): Significant breakthroughs in AI-powered vehicle control algorithms begin to enhance predictive maintenance and real-time performance optimization.
- 2030 (Projected): Over 50% of new vehicle sales globally are projected to be electric or hybrid, fundamentally reshaping under-the-hood electronic demand.
- 2032 (Projected): Deployment of vehicle-to-everything (V2X) communication technologies becomes more prevalent, requiring enhanced connectivity modules.
Future Outlook for Vehicle Under-the-hood Electronic Market
The future outlook for the Vehicle Under-the-hood Electronic market is exceptionally bright, driven by ongoing technological advancements and a global push towards sustainable and intelligent mobility. Strategic opportunities lie in the continued expansion of electric vehicle powertrains, necessitating advanced battery management systems and high-efficiency power electronics. The maturation of autonomous driving technologies will fuel demand for sophisticated sensor fusion, AI-powered processing units, and robust cybersecurity solutions. Furthermore, the increasing integration of connectivity features and the development of software-defined vehicles present significant potential for recurring revenue streams through over-the-air updates and enhanced digital services. Collaboration between automotive OEMs, Tier 1 suppliers, and semiconductor manufacturers will be crucial to navigate supply chain challenges and accelerate innovation, ensuring the market continues its robust growth trajectory.
Vehicle Under-the-hood Electronic Segmentation
-
1. Application
- 1.1. Passenger Cars
- 1.2. Light Truck
- 1.3. Heavy Truck
- 1.4. Others
-
2. Types
- 2.1. Automotive Under the Hood Control Modules and ECUs
- 2.2. Automotive Under the Hood Sensors
Vehicle Under-the-hood Electronic Segmentation By Geography
-
1. North America
- 1.1. United States
- 1.2. Canada
- 1.3. Mexico
-
2. South America
- 2.1. Brazil
- 2.2. Argentina
- 2.3. Rest of South America
-
3. Europe
- 3.1. United Kingdom
- 3.2. Germany
- 3.3. France
- 3.4. Italy
- 3.5. Spain
- 3.6. Russia
- 3.7. Benelux
- 3.8. Nordics
- 3.9. Rest of Europe
-
4. Middle East & Africa
- 4.1. Turkey
- 4.2. Israel
- 4.3. GCC
- 4.4. North Africa
- 4.5. South Africa
- 4.6. Rest of Middle East & Africa
-
5. Asia Pacific
- 5.1. China
- 5.2. India
- 5.3. Japan
- 5.4. South Korea
- 5.5. ASEAN
- 5.6. Oceania
- 5.7. Rest of Asia Pacific
Vehicle Under-the-hood Electronic Regional Market Share
Geographic Coverage of Vehicle Under-the-hood Electronic
Vehicle Under-the-hood Electronic REPORT HIGHLIGHTS
| Aspects | Details |
|---|---|
| Study Period | 2020-2034 |
| Base Year | 2025 |
| Estimated Year | 2026 |
| Forecast Period | 2026-2034 |
| Historical Period | 2020-2025 |
| Growth Rate | CAGR of 9.7% from 2020-2034 |
| Segmentation |
|
Table of Contents
- 1. Introduction
- 1.1. Research Scope
- 1.2. Market Segmentation
- 1.3. Research Methodology
- 1.4. Definitions and Assumptions
- 2. Executive Summary
- 2.1. Introduction
- 3. Market Dynamics
- 3.1. Introduction
- 3.2. Market Drivers
- 3.3. Market Restrains
- 3.4. Market Trends
- 4. Market Factor Analysis
- 4.1. Porters Five Forces
- 4.2. Supply/Value Chain
- 4.3. PESTEL analysis
- 4.4. Market Entropy
- 4.5. Patent/Trademark Analysis
- 5. Global Vehicle Under-the-hood Electronic Analysis, Insights and Forecast, 2020-2032
- 5.1. Market Analysis, Insights and Forecast - by Application
- 5.1.1. Passenger Cars
- 5.1.2. Light Truck
- 5.1.3. Heavy Truck
- 5.1.4. Others
- 5.2. Market Analysis, Insights and Forecast - by Types
- 5.2.1. Automotive Under the Hood Control Modules and ECUs
- 5.2.2. Automotive Under the Hood Sensors
- 5.3. Market Analysis, Insights and Forecast - by Region
- 5.3.1. North America
- 5.3.2. South America
- 5.3.3. Europe
- 5.3.4. Middle East & Africa
- 5.3.5. Asia Pacific
- 5.1. Market Analysis, Insights and Forecast - by Application
- 6. North America Vehicle Under-the-hood Electronic Analysis, Insights and Forecast, 2020-2032
- 6.1. Market Analysis, Insights and Forecast - by Application
- 6.1.1. Passenger Cars
- 6.1.2. Light Truck
- 6.1.3. Heavy Truck
- 6.1.4. Others
- 6.2. Market Analysis, Insights and Forecast - by Types
- 6.2.1. Automotive Under the Hood Control Modules and ECUs
- 6.2.2. Automotive Under the Hood Sensors
- 6.1. Market Analysis, Insights and Forecast - by Application
- 7. South America Vehicle Under-the-hood Electronic Analysis, Insights and Forecast, 2020-2032
- 7.1. Market Analysis, Insights and Forecast - by Application
- 7.1.1. Passenger Cars
- 7.1.2. Light Truck
- 7.1.3. Heavy Truck
- 7.1.4. Others
- 7.2. Market Analysis, Insights and Forecast - by Types
- 7.2.1. Automotive Under the Hood Control Modules and ECUs
- 7.2.2. Automotive Under the Hood Sensors
- 7.1. Market Analysis, Insights and Forecast - by Application
- 8. Europe Vehicle Under-the-hood Electronic Analysis, Insights and Forecast, 2020-2032
- 8.1. Market Analysis, Insights and Forecast - by Application
- 8.1.1. Passenger Cars
- 8.1.2. Light Truck
- 8.1.3. Heavy Truck
- 8.1.4. Others
- 8.2. Market Analysis, Insights and Forecast - by Types
- 8.2.1. Automotive Under the Hood Control Modules and ECUs
- 8.2.2. Automotive Under the Hood Sensors
- 8.1. Market Analysis, Insights and Forecast - by Application
- 9. Middle East & Africa Vehicle Under-the-hood Electronic Analysis, Insights and Forecast, 2020-2032
- 9.1. Market Analysis, Insights and Forecast - by Application
- 9.1.1. Passenger Cars
- 9.1.2. Light Truck
- 9.1.3. Heavy Truck
- 9.1.4. Others
- 9.2. Market Analysis, Insights and Forecast - by Types
- 9.2.1. Automotive Under the Hood Control Modules and ECUs
- 9.2.2. Automotive Under the Hood Sensors
- 9.1. Market Analysis, Insights and Forecast - by Application
- 10. Asia Pacific Vehicle Under-the-hood Electronic Analysis, Insights and Forecast, 2020-2032
- 10.1. Market Analysis, Insights and Forecast - by Application
- 10.1.1. Passenger Cars
- 10.1.2. Light Truck
- 10.1.3. Heavy Truck
- 10.1.4. Others
- 10.2. Market Analysis, Insights and Forecast - by Types
- 10.2.1. Automotive Under the Hood Control Modules and ECUs
- 10.2.2. Automotive Under the Hood Sensors
- 10.1. Market Analysis, Insights and Forecast - by Application
- 11. Competitive Analysis
- 11.1. Global Market Share Analysis 2025
- 11.2. Company Profiles
- 11.2.1 Bosch
- 11.2.1.1. Overview
- 11.2.1.2. Products
- 11.2.1.3. SWOT Analysis
- 11.2.1.4. Recent Developments
- 11.2.1.5. Financials (Based on Availability)
- 11.2.2 Continental
- 11.2.2.1. Overview
- 11.2.2.2. Products
- 11.2.2.3. SWOT Analysis
- 11.2.2.4. Recent Developments
- 11.2.2.5. Financials (Based on Availability)
- 11.2.3 Denso
- 11.2.3.1. Overview
- 11.2.3.2. Products
- 11.2.3.3. SWOT Analysis
- 11.2.3.4. Recent Developments
- 11.2.3.5. Financials (Based on Availability)
- 11.2.4 Delphi
- 11.2.4.1. Overview
- 11.2.4.2. Products
- 11.2.4.3. SWOT Analysis
- 11.2.4.4. Recent Developments
- 11.2.4.5. Financials (Based on Availability)
- 11.2.5 Hitachi
- 11.2.5.1. Overview
- 11.2.5.2. Products
- 11.2.5.3. SWOT Analysis
- 11.2.5.4. Recent Developments
- 11.2.5.5. Financials (Based on Availability)
- 11.2.6 Hyundai KEFICO
- 11.2.6.1. Overview
- 11.2.6.2. Products
- 11.2.6.3. SWOT Analysis
- 11.2.6.4. Recent Developments
- 11.2.6.5. Financials (Based on Availability)
- 11.2.7 Infineon Technologies
- 11.2.7.1. Overview
- 11.2.7.2. Products
- 11.2.7.3. SWOT Analysis
- 11.2.7.4. Recent Developments
- 11.2.7.5. Financials (Based on Availability)
- 11.2.8 NGK Spark Plug
- 11.2.8.1. Overview
- 11.2.8.2. Products
- 11.2.8.3. SWOT Analysis
- 11.2.8.4. Recent Developments
- 11.2.8.5. Financials (Based on Availability)
- 11.2.9 Panasonic
- 11.2.9.1. Overview
- 11.2.9.2. Products
- 11.2.9.3. SWOT Analysis
- 11.2.9.4. Recent Developments
- 11.2.9.5. Financials (Based on Availability)
- 11.2.10 Stoneridge
- 11.2.10.1. Overview
- 11.2.10.2. Products
- 11.2.10.3. SWOT Analysis
- 11.2.10.4. Recent Developments
- 11.2.10.5. Financials (Based on Availability)
- 11.2.1 Bosch
List of Figures
- Figure 1: Global Vehicle Under-the-hood Electronic Revenue Breakdown (billion, %) by Region 2025 & 2033
- Figure 2: Global Vehicle Under-the-hood Electronic Volume Breakdown (K, %) by Region 2025 & 2033
- Figure 3: North America Vehicle Under-the-hood Electronic Revenue (billion), by Application 2025 & 2033
- Figure 4: North America Vehicle Under-the-hood Electronic Volume (K), by Application 2025 & 2033
- Figure 5: North America Vehicle Under-the-hood Electronic Revenue Share (%), by Application 2025 & 2033
- Figure 6: North America Vehicle Under-the-hood Electronic Volume Share (%), by Application 2025 & 2033
- Figure 7: North America Vehicle Under-the-hood Electronic Revenue (billion), by Types 2025 & 2033
- Figure 8: North America Vehicle Under-the-hood Electronic Volume (K), by Types 2025 & 2033
- Figure 9: North America Vehicle Under-the-hood Electronic Revenue Share (%), by Types 2025 & 2033
- Figure 10: North America Vehicle Under-the-hood Electronic Volume Share (%), by Types 2025 & 2033
- Figure 11: North America Vehicle Under-the-hood Electronic Revenue (billion), by Country 2025 & 2033
- Figure 12: North America Vehicle Under-the-hood Electronic Volume (K), by Country 2025 & 2033
- Figure 13: North America Vehicle Under-the-hood Electronic Revenue Share (%), by Country 2025 & 2033
- Figure 14: North America Vehicle Under-the-hood Electronic Volume Share (%), by Country 2025 & 2033
- Figure 15: South America Vehicle Under-the-hood Electronic Revenue (billion), by Application 2025 & 2033
- Figure 16: South America Vehicle Under-the-hood Electronic Volume (K), by Application 2025 & 2033
- Figure 17: South America Vehicle Under-the-hood Electronic Revenue Share (%), by Application 2025 & 2033
- Figure 18: South America Vehicle Under-the-hood Electronic Volume Share (%), by Application 2025 & 2033
- Figure 19: South America Vehicle Under-the-hood Electronic Revenue (billion), by Types 2025 & 2033
- Figure 20: South America Vehicle Under-the-hood Electronic Volume (K), by Types 2025 & 2033
- Figure 21: South America Vehicle Under-the-hood Electronic Revenue Share (%), by Types 2025 & 2033
- Figure 22: South America Vehicle Under-the-hood Electronic Volume Share (%), by Types 2025 & 2033
- Figure 23: South America Vehicle Under-the-hood Electronic Revenue (billion), by Country 2025 & 2033
- Figure 24: South America Vehicle Under-the-hood Electronic Volume (K), by Country 2025 & 2033
- Figure 25: South America Vehicle Under-the-hood Electronic Revenue Share (%), by Country 2025 & 2033
- Figure 26: South America Vehicle Under-the-hood Electronic Volume Share (%), by Country 2025 & 2033
- Figure 27: Europe Vehicle Under-the-hood Electronic Revenue (billion), by Application 2025 & 2033
- Figure 28: Europe Vehicle Under-the-hood Electronic Volume (K), by Application 2025 & 2033
- Figure 29: Europe Vehicle Under-the-hood Electronic Revenue Share (%), by Application 2025 & 2033
- Figure 30: Europe Vehicle Under-the-hood Electronic Volume Share (%), by Application 2025 & 2033
- Figure 31: Europe Vehicle Under-the-hood Electronic Revenue (billion), by Types 2025 & 2033
- Figure 32: Europe Vehicle Under-the-hood Electronic Volume (K), by Types 2025 & 2033
- Figure 33: Europe Vehicle Under-the-hood Electronic Revenue Share (%), by Types 2025 & 2033
- Figure 34: Europe Vehicle Under-the-hood Electronic Volume Share (%), by Types 2025 & 2033
- Figure 35: Europe Vehicle Under-the-hood Electronic Revenue (billion), by Country 2025 & 2033
- Figure 36: Europe Vehicle Under-the-hood Electronic Volume (K), by Country 2025 & 2033
- Figure 37: Europe Vehicle Under-the-hood Electronic Revenue Share (%), by Country 2025 & 2033
- Figure 38: Europe Vehicle Under-the-hood Electronic Volume Share (%), by Country 2025 & 2033
- Figure 39: Middle East & Africa Vehicle Under-the-hood Electronic Revenue (billion), by Application 2025 & 2033
- Figure 40: Middle East & Africa Vehicle Under-the-hood Electronic Volume (K), by Application 2025 & 2033
- Figure 41: Middle East & Africa Vehicle Under-the-hood Electronic Revenue Share (%), by Application 2025 & 2033
- Figure 42: Middle East & Africa Vehicle Under-the-hood Electronic Volume Share (%), by Application 2025 & 2033
- Figure 43: Middle East & Africa Vehicle Under-the-hood Electronic Revenue (billion), by Types 2025 & 2033
- Figure 44: Middle East & Africa Vehicle Under-the-hood Electronic Volume (K), by Types 2025 & 2033
- Figure 45: Middle East & Africa Vehicle Under-the-hood Electronic Revenue Share (%), by Types 2025 & 2033
- Figure 46: Middle East & Africa Vehicle Under-the-hood Electronic Volume Share (%), by Types 2025 & 2033
- Figure 47: Middle East & Africa Vehicle Under-the-hood Electronic Revenue (billion), by Country 2025 & 2033
- Figure 48: Middle East & Africa Vehicle Under-the-hood Electronic Volume (K), by Country 2025 & 2033
- Figure 49: Middle East & Africa Vehicle Under-the-hood Electronic Revenue Share (%), by Country 2025 & 2033
- Figure 50: Middle East & Africa Vehicle Under-the-hood Electronic Volume Share (%), by Country 2025 & 2033
- Figure 51: Asia Pacific Vehicle Under-the-hood Electronic Revenue (billion), by Application 2025 & 2033
- Figure 52: Asia Pacific Vehicle Under-the-hood Electronic Volume (K), by Application 2025 & 2033
- Figure 53: Asia Pacific Vehicle Under-the-hood Electronic Revenue Share (%), by Application 2025 & 2033
- Figure 54: Asia Pacific Vehicle Under-the-hood Electronic Volume Share (%), by Application 2025 & 2033
- Figure 55: Asia Pacific Vehicle Under-the-hood Electronic Revenue (billion), by Types 2025 & 2033
- Figure 56: Asia Pacific Vehicle Under-the-hood Electronic Volume (K), by Types 2025 & 2033
- Figure 57: Asia Pacific Vehicle Under-the-hood Electronic Revenue Share (%), by Types 2025 & 2033
- Figure 58: Asia Pacific Vehicle Under-the-hood Electronic Volume Share (%), by Types 2025 & 2033
- Figure 59: Asia Pacific Vehicle Under-the-hood Electronic Revenue (billion), by Country 2025 & 2033
- Figure 60: Asia Pacific Vehicle Under-the-hood Electronic Volume (K), by Country 2025 & 2033
- Figure 61: Asia Pacific Vehicle Under-the-hood Electronic Revenue Share (%), by Country 2025 & 2033
- Figure 62: Asia Pacific Vehicle Under-the-hood Electronic Volume Share (%), by Country 2025 & 2033
List of Tables
- Table 1: Global Vehicle Under-the-hood Electronic Revenue billion Forecast, by Application 2020 & 2033
- Table 2: Global Vehicle Under-the-hood Electronic Volume K Forecast, by Application 2020 & 2033
- Table 3: Global Vehicle Under-the-hood Electronic Revenue billion Forecast, by Types 2020 & 2033
- Table 4: Global Vehicle Under-the-hood Electronic Volume K Forecast, by Types 2020 & 2033
- Table 5: Global Vehicle Under-the-hood Electronic Revenue billion Forecast, by Region 2020 & 2033
- Table 6: Global Vehicle Under-the-hood Electronic Volume K Forecast, by Region 2020 & 2033
- Table 7: Global Vehicle Under-the-hood Electronic Revenue billion Forecast, by Application 2020 & 2033
- Table 8: Global Vehicle Under-the-hood Electronic Volume K Forecast, by Application 2020 & 2033
- Table 9: Global Vehicle Under-the-hood Electronic Revenue billion Forecast, by Types 2020 & 2033
- Table 10: Global Vehicle Under-the-hood Electronic Volume K Forecast, by Types 2020 & 2033
- Table 11: Global Vehicle Under-the-hood Electronic Revenue billion Forecast, by Country 2020 & 2033
- Table 12: Global Vehicle Under-the-hood Electronic Volume K Forecast, by Country 2020 & 2033
- Table 13: United States Vehicle Under-the-hood Electronic Revenue (billion) Forecast, by Application 2020 & 2033
- Table 14: United States Vehicle Under-the-hood Electronic Volume (K) Forecast, by Application 2020 & 2033
- Table 15: Canada Vehicle Under-the-hood Electronic Revenue (billion) Forecast, by Application 2020 & 2033
- Table 16: Canada Vehicle Under-the-hood Electronic Volume (K) Forecast, by Application 2020 & 2033
- Table 17: Mexico Vehicle Under-the-hood Electronic Revenue (billion) Forecast, by Application 2020 & 2033
- Table 18: Mexico Vehicle Under-the-hood Electronic Volume (K) Forecast, by Application 2020 & 2033
- Table 19: Global Vehicle Under-the-hood Electronic Revenue billion Forecast, by Application 2020 & 2033
- Table 20: Global Vehicle Under-the-hood Electronic Volume K Forecast, by Application 2020 & 2033
- Table 21: Global Vehicle Under-the-hood Electronic Revenue billion Forecast, by Types 2020 & 2033
- Table 22: Global Vehicle Under-the-hood Electronic Volume K Forecast, by Types 2020 & 2033
- Table 23: Global Vehicle Under-the-hood Electronic Revenue billion Forecast, by Country 2020 & 2033
- Table 24: Global Vehicle Under-the-hood Electronic Volume K Forecast, by Country 2020 & 2033
- Table 25: Brazil Vehicle Under-the-hood Electronic Revenue (billion) Forecast, by Application 2020 & 2033
- Table 26: Brazil Vehicle Under-the-hood Electronic Volume (K) Forecast, by Application 2020 & 2033
- Table 27: Argentina Vehicle Under-the-hood Electronic Revenue (billion) Forecast, by Application 2020 & 2033
- Table 28: Argentina Vehicle Under-the-hood Electronic Volume (K) Forecast, by Application 2020 & 2033
- Table 29: Rest of South America Vehicle Under-the-hood Electronic Revenue (billion) Forecast, by Application 2020 & 2033
- Table 30: Rest of South America Vehicle Under-the-hood Electronic Volume (K) Forecast, by Application 2020 & 2033
- Table 31: Global Vehicle Under-the-hood Electronic Revenue billion Forecast, by Application 2020 & 2033
- Table 32: Global Vehicle Under-the-hood Electronic Volume K Forecast, by Application 2020 & 2033
- Table 33: Global Vehicle Under-the-hood Electronic Revenue billion Forecast, by Types 2020 & 2033
- Table 34: Global Vehicle Under-the-hood Electronic Volume K Forecast, by Types 2020 & 2033
- Table 35: Global Vehicle Under-the-hood Electronic Revenue billion Forecast, by Country 2020 & 2033
- Table 36: Global Vehicle Under-the-hood Electronic Volume K Forecast, by Country 2020 & 2033
- Table 37: United Kingdom Vehicle Under-the-hood Electronic Revenue (billion) Forecast, by Application 2020 & 2033
- Table 38: United Kingdom Vehicle Under-the-hood Electronic Volume (K) Forecast, by Application 2020 & 2033
- Table 39: Germany Vehicle Under-the-hood Electronic Revenue (billion) Forecast, by Application 2020 & 2033
- Table 40: Germany Vehicle Under-the-hood Electronic Volume (K) Forecast, by Application 2020 & 2033
- Table 41: France Vehicle Under-the-hood Electronic Revenue (billion) Forecast, by Application 2020 & 2033
- Table 42: France Vehicle Under-the-hood Electronic Volume (K) Forecast, by Application 2020 & 2033
- Table 43: Italy Vehicle Under-the-hood Electronic Revenue (billion) Forecast, by Application 2020 & 2033
- Table 44: Italy Vehicle Under-the-hood Electronic Volume (K) Forecast, by Application 2020 & 2033
- Table 45: Spain Vehicle Under-the-hood Electronic Revenue (billion) Forecast, by Application 2020 & 2033
- Table 46: Spain Vehicle Under-the-hood Electronic Volume (K) Forecast, by Application 2020 & 2033
- Table 47: Russia Vehicle Under-the-hood Electronic Revenue (billion) Forecast, by Application 2020 & 2033
- Table 48: Russia Vehicle Under-the-hood Electronic Volume (K) Forecast, by Application 2020 & 2033
- Table 49: Benelux Vehicle Under-the-hood Electronic Revenue (billion) Forecast, by Application 2020 & 2033
- Table 50: Benelux Vehicle Under-the-hood Electronic Volume (K) Forecast, by Application 2020 & 2033
- Table 51: Nordics Vehicle Under-the-hood Electronic Revenue (billion) Forecast, by Application 2020 & 2033
- Table 52: Nordics Vehicle Under-the-hood Electronic Volume (K) Forecast, by Application 2020 & 2033
- Table 53: Rest of Europe Vehicle Under-the-hood Electronic Revenue (billion) Forecast, by Application 2020 & 2033
- Table 54: Rest of Europe Vehicle Under-the-hood Electronic Volume (K) Forecast, by Application 2020 & 2033
- Table 55: Global Vehicle Under-the-hood Electronic Revenue billion Forecast, by Application 2020 & 2033
- Table 56: Global Vehicle Under-the-hood Electronic Volume K Forecast, by Application 2020 & 2033
- Table 57: Global Vehicle Under-the-hood Electronic Revenue billion Forecast, by Types 2020 & 2033
- Table 58: Global Vehicle Under-the-hood Electronic Volume K Forecast, by Types 2020 & 2033
- Table 59: Global Vehicle Under-the-hood Electronic Revenue billion Forecast, by Country 2020 & 2033
- Table 60: Global Vehicle Under-the-hood Electronic Volume K Forecast, by Country 2020 & 2033
- Table 61: Turkey Vehicle Under-the-hood Electronic Revenue (billion) Forecast, by Application 2020 & 2033
- Table 62: Turkey Vehicle Under-the-hood Electronic Volume (K) Forecast, by Application 2020 & 2033
- Table 63: Israel Vehicle Under-the-hood Electronic Revenue (billion) Forecast, by Application 2020 & 2033
- Table 64: Israel Vehicle Under-the-hood Electronic Volume (K) Forecast, by Application 2020 & 2033
- Table 65: GCC Vehicle Under-the-hood Electronic Revenue (billion) Forecast, by Application 2020 & 2033
- Table 66: GCC Vehicle Under-the-hood Electronic Volume (K) Forecast, by Application 2020 & 2033
- Table 67: North Africa Vehicle Under-the-hood Electronic Revenue (billion) Forecast, by Application 2020 & 2033
- Table 68: North Africa Vehicle Under-the-hood Electronic Volume (K) Forecast, by Application 2020 & 2033
- Table 69: South Africa Vehicle Under-the-hood Electronic Revenue (billion) Forecast, by Application 2020 & 2033
- Table 70: South Africa Vehicle Under-the-hood Electronic Volume (K) Forecast, by Application 2020 & 2033
- Table 71: Rest of Middle East & Africa Vehicle Under-the-hood Electronic Revenue (billion) Forecast, by Application 2020 & 2033
- Table 72: Rest of Middle East & Africa Vehicle Under-the-hood Electronic Volume (K) Forecast, by Application 2020 & 2033
- Table 73: Global Vehicle Under-the-hood Electronic Revenue billion Forecast, by Application 2020 & 2033
- Table 74: Global Vehicle Under-the-hood Electronic Volume K Forecast, by Application 2020 & 2033
- Table 75: Global Vehicle Under-the-hood Electronic Revenue billion Forecast, by Types 2020 & 2033
- Table 76: Global Vehicle Under-the-hood Electronic Volume K Forecast, by Types 2020 & 2033
- Table 77: Global Vehicle Under-the-hood Electronic Revenue billion Forecast, by Country 2020 & 2033
- Table 78: Global Vehicle Under-the-hood Electronic Volume K Forecast, by Country 2020 & 2033
- Table 79: China Vehicle Under-the-hood Electronic Revenue (billion) Forecast, by Application 2020 & 2033
- Table 80: China Vehicle Under-the-hood Electronic Volume (K) Forecast, by Application 2020 & 2033
- Table 81: India Vehicle Under-the-hood Electronic Revenue (billion) Forecast, by Application 2020 & 2033
- Table 82: India Vehicle Under-the-hood Electronic Volume (K) Forecast, by Application 2020 & 2033
- Table 83: Japan Vehicle Under-the-hood Electronic Revenue (billion) Forecast, by Application 2020 & 2033
- Table 84: Japan Vehicle Under-the-hood Electronic Volume (K) Forecast, by Application 2020 & 2033
- Table 85: South Korea Vehicle Under-the-hood Electronic Revenue (billion) Forecast, by Application 2020 & 2033
- Table 86: South Korea Vehicle Under-the-hood Electronic Volume (K) Forecast, by Application 2020 & 2033
- Table 87: ASEAN Vehicle Under-the-hood Electronic Revenue (billion) Forecast, by Application 2020 & 2033
- Table 88: ASEAN Vehicle Under-the-hood Electronic Volume (K) Forecast, by Application 2020 & 2033
- Table 89: Oceania Vehicle Under-the-hood Electronic Revenue (billion) Forecast, by Application 2020 & 2033
- Table 90: Oceania Vehicle Under-the-hood Electronic Volume (K) Forecast, by Application 2020 & 2033
- Table 91: Rest of Asia Pacific Vehicle Under-the-hood Electronic Revenue (billion) Forecast, by Application 2020 & 2033
- Table 92: Rest of Asia Pacific Vehicle Under-the-hood Electronic Volume (K) Forecast, by Application 2020 & 2033
Frequently Asked Questions
1. What is the projected Compound Annual Growth Rate (CAGR) of the Vehicle Under-the-hood Electronic?
The projected CAGR is approximately 9.7%.
2. Which companies are prominent players in the Vehicle Under-the-hood Electronic?
Key companies in the market include Bosch, Continental, Denso, Delphi, Hitachi, Hyundai KEFICO, Infineon Technologies, NGK Spark Plug, Panasonic, Stoneridge.
3. What are the main segments of the Vehicle Under-the-hood Electronic?
The market segments include Application, Types.
4. Can you provide details about the market size?
The market size is estimated to be USD 14.18 billion as of 2022.
5. What are some drivers contributing to market growth?
N/A
6. What are the notable trends driving market growth?
N/A
7. Are there any restraints impacting market growth?
N/A
8. Can you provide examples of recent developments in the market?
N/A
9. What pricing options are available for accessing the report?
Pricing options include single-user, multi-user, and enterprise licenses priced at USD 3350.00, USD 5025.00, and USD 6700.00 respectively.
10. Is the market size provided in terms of value or volume?
The market size is provided in terms of value, measured in billion and volume, measured in K.
11. Are there any specific market keywords associated with the report?
Yes, the market keyword associated with the report is "Vehicle Under-the-hood Electronic," which aids in identifying and referencing the specific market segment covered.
12. How do I determine which pricing option suits my needs best?
The pricing options vary based on user requirements and access needs. Individual users may opt for single-user licenses, while businesses requiring broader access may choose multi-user or enterprise licenses for cost-effective access to the report.
13. Are there any additional resources or data provided in the Vehicle Under-the-hood Electronic report?
While the report offers comprehensive insights, it's advisable to review the specific contents or supplementary materials provided to ascertain if additional resources or data are available.
14. How can I stay updated on further developments or reports in the Vehicle Under-the-hood Electronic?
To stay informed about further developments, trends, and reports in the Vehicle Under-the-hood Electronic, consider subscribing to industry newsletters, following relevant companies and organizations, or regularly checking reputable industry news sources and publications.
Methodology
Step 1 - Identification of Relevant Samples Size from Population Database


Step 2 - Approaches for Defining Global Market Size (Value, Volume* & Price*)

Note*: In applicable scenarios
Step 3 - Data Sources
Primary Research
- Web Analytics
- Survey Reports
- Research Institute
- Latest Research Reports
- Opinion Leaders
Secondary Research
- Annual Reports
- White Paper
- Latest Press Release
- Industry Association
- Paid Database
- Investor Presentations

Step 4 - Data Triangulation
Involves using different sources of information in order to increase the validity of a study
These sources are likely to be stakeholders in a program - participants, other researchers, program staff, other community members, and so on.
Then we put all data in single framework & apply various statistical tools to find out the dynamic on the market.
During the analysis stage, feedback from the stakeholder groups would be compared to determine areas of agreement as well as areas of divergence