

Key Insights
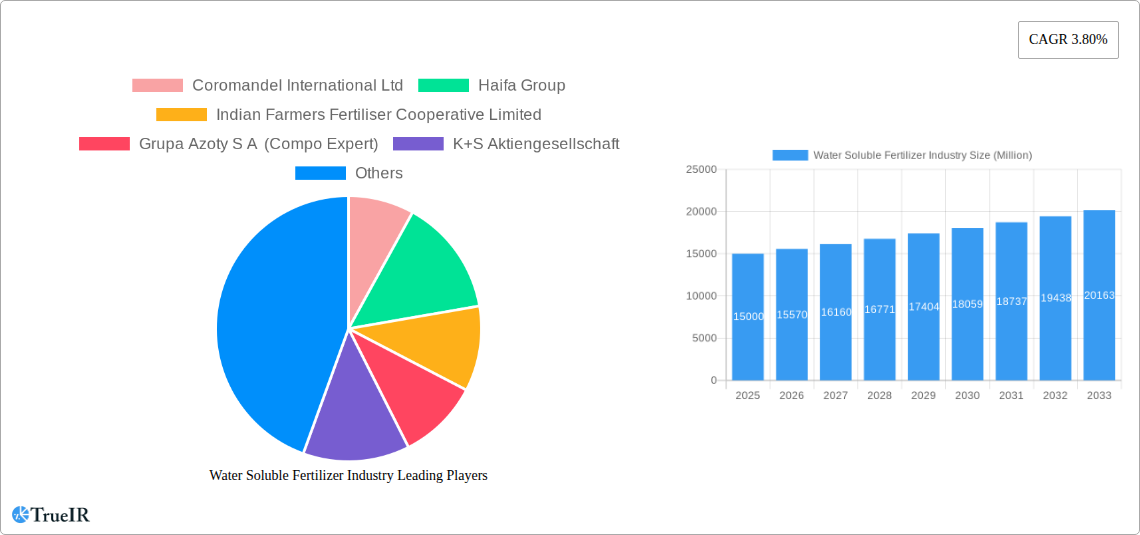
The water-soluble fertilizer market is experiencing robust growth, driven by the increasing demand for high-yielding crops and the rising adoption of precision agriculture techniques. The market's Compound Annual Growth Rate (CAGR) of 3.80% from 2019 to 2024 indicates a steady expansion, projected to continue over the forecast period (2025-2033). Several factors contribute to this growth. Firstly, the rising global population necessitates increased food production, pushing farmers to adopt fertilizers that ensure efficient nutrient uptake by plants. Water-soluble fertilizers, with their rapid solubility and targeted nutrient delivery, are ideally suited to this need. Secondly, the growing awareness of sustainable agricultural practices is fueling demand. These fertilizers minimize nutrient runoff and optimize fertilizer use, aligning with environmental concerns. The market is segmented by application mode (fertigation, foliar), crop type (field crops, horticultural crops, turf & ornamental), and type (complex, straight, secondary macronutrients). Fertigation application, offering precise nutrient delivery directly to the root zone, is gaining significant traction. Among crop types, field crops currently hold the largest market share, while horticultural crops and turf & ornamental segments show strong growth potential due to increasing landscaping and gardening activities globally. Major players like Coromandel International Ltd, Haifa Group, and Yara International AS are strategically expanding their product portfolios and geographical reach to capitalize on market opportunities. Competition is intense, with companies focusing on product innovation, mergers and acquisitions, and strategic partnerships to gain a competitive edge.
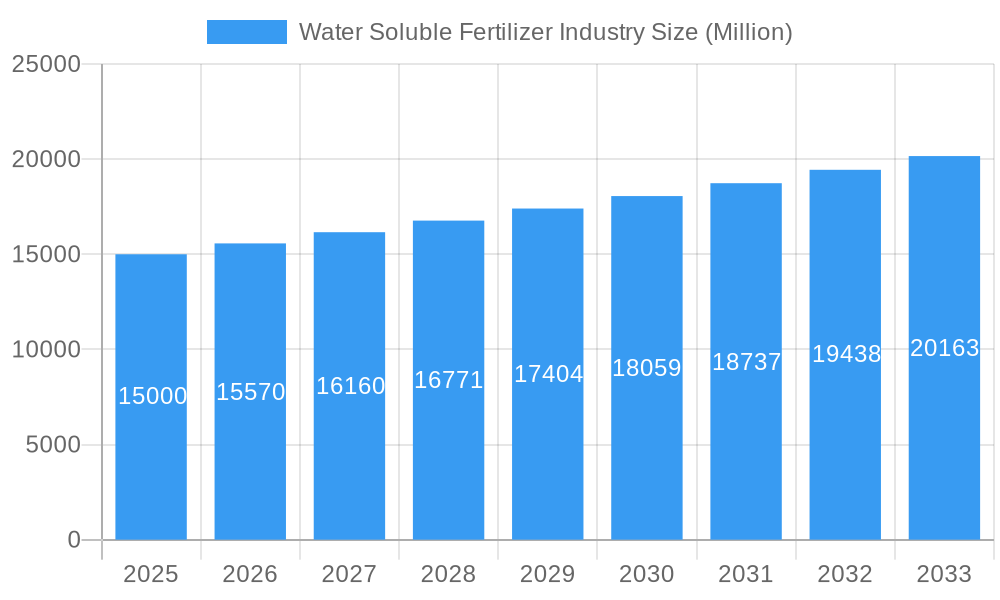
Water Soluble Fertilizer Industry Market Size (In Billion)
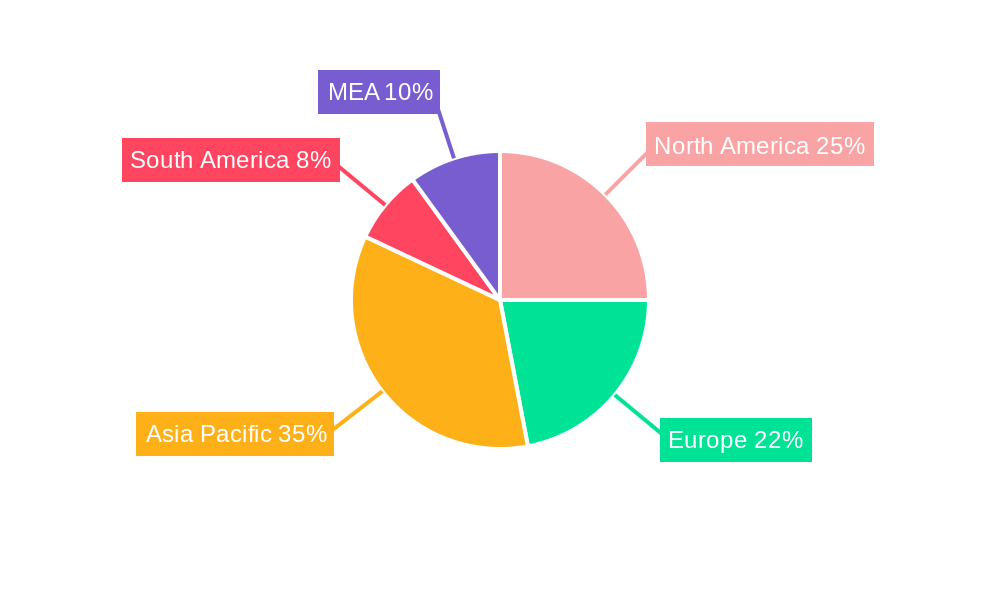
Regional market dynamics are diverse. North America and Europe, with their established agricultural sectors and high adoption of advanced farming technologies, currently hold significant market shares. However, the Asia-Pacific region, especially India and China, is exhibiting rapid growth potential due to its expanding agricultural sector and increasing government support for agricultural development. The Middle East and Africa also present promising opportunities, driven by rising investments in agricultural infrastructure and modernization. Overall, the water-soluble fertilizer market is poised for continued expansion, driven by factors such as population growth, the demand for high-yielding crops, increasing adoption of advanced agricultural practices, and favorable government policies promoting sustainable agriculture. The market’s growth trajectory will likely see fluctuations based on global economic conditions and agricultural policies, but the long-term outlook remains positive.
Water Soluble Fertilizer Industry Company Market Share
This comprehensive report provides an in-depth analysis of the global water soluble fertilizer industry, offering invaluable insights for investors, manufacturers, and stakeholders. Covering the period 2019-2033, with a focus on 2025, this report unveils market trends, competitive dynamics, and future growth potential. It leverages extensive data analysis and expert insights to deliver a clear understanding of this dynamic market. Download now to gain a competitive edge!
Water Soluble Fertilizer Industry Market Structure & Competitive Landscape
The global water soluble fertilizer market is characterized by a moderately concentrated structure, with several multinational corporations holding significant market share. The Herfindahl-Hirschman Index (HHI) for 2024 is estimated at xx, indicating a moderately competitive landscape. Key players such as Coromandel International Ltd, Haifa Group, Indian Farmers Fertiliser Cooperative Limited, Grupa Azoty S A (Compo Expert), K+S Aktiengesellschaft, Yara International AS, ICL Group Ltd, BMS Micro-Nutrients NV, and Sociedad Quimica y Minera de Chile SA are driving innovation and shaping market dynamics.
- Market Concentration: The top 5 players account for approximately xx% of the global market share in 2024.
- Innovation Drivers: Technological advancements in formulation, nutrient delivery systems, and precision agriculture are key drivers of innovation.
- Regulatory Impacts: Government regulations related to environmental protection and sustainable agriculture significantly influence market growth.
- Product Substitutes: Conventional fertilizers remain the primary substitute, but their environmental impact drives a shift towards water-soluble options.
- End-User Segmentation: The market is segmented by application mode (fertigation, foliar), crop type (field crops, horticultural crops, turf & ornamental), and type (complex, straight, secondary macronutrients). The horticultural and field crop segments dominate, accounting for xx% and xx% respectively, of the total market in 2024.
- M&A Trends: The industry has witnessed several mergers and acquisitions (M&As) recently. The total M&A volume in 2024 was approximately $xx Million, illustrating significant consolidation in the market. For instance, K+S’s acquisition of a 75% stake in Industrial Commodities Holdings’ fertilizer business exemplifies this trend.
Water Soluble Fertilizer Industry Market Trends & Opportunities
The global water soluble fertilizer market is poised for robust growth, with a projected Compound Annual Growth Rate (CAGR) of xx% during the forecast period (2025-2033). The market size is estimated to reach $xx Million by 2025 and $xx Million by 2033. This growth is fueled by several factors:
- Rising demand for high-quality crops: The increasing global population and changing dietary habits are driving demand for higher crop yields, which in turn fuels the demand for efficient fertilizers.
- Technological advancements: Innovations in formulation and application methods are leading to increased efficiency and effectiveness of water-soluble fertilizers.
- Growing adoption of precision agriculture: Precision farming techniques require the use of tailored fertilizer solutions, boosting the demand for water-soluble fertilizers.
- Government support for sustainable agriculture: Policies promoting sustainable farming practices are indirectly driving the adoption of water-soluble fertilizers.
- Increasing awareness of environmental concerns: Compared to conventional fertilizers, water-soluble fertilizers offer improved nutrient use efficiency, reducing environmental impact. This has led to a positive change in consumer preferences.
- Competitive dynamics: Competition among key players is leading to continuous innovation and increased market penetration.
Dominant Markets & Segments in Water Soluble Fertilizer Industry
The water soluble fertilizer market is geographically diverse, with several regions demonstrating significant growth. However, the Asia-Pacific region dominates the market due to its large agricultural sector and increasing adoption of advanced farming techniques. The field crops segment holds the largest market share due to its extensive acreage.
Key Growth Drivers:
- Asia-Pacific Region:
- Rapidly expanding agricultural sector.
- Rising disposable incomes and demand for high-quality food.
- Government initiatives to improve agricultural productivity.
- North America:
- High adoption of advanced farming technologies.
- Well-established agricultural infrastructure.
- Growing awareness of sustainable agriculture practices.
Dominant Segments:
- Application Mode: Fertigation holds a larger market share than foliar application due to its efficiency and effectiveness.
- Crop Type: Field crops dominate owing to their extensive acreage and demand for higher yields.
- Type: Complex fertilizers have higher demand compared to straight fertilizers due to their balanced nutrient profile.
Water Soluble Fertilizer Industry Product Analysis
The water soluble fertilizer industry showcases continuous innovation in product formulations to cater to specific crop needs and application methods. Technological advancements focus on enhancing nutrient bioavailability, improving nutrient use efficiency, and reducing environmental impact. Products are tailored to optimize crop yields, while also addressing specific soil conditions and climatic factors. Manufacturers leverage unique formulations and blends of macronutrients and micronutrients, providing significant competitive advantages.
Key Drivers, Barriers & Challenges in Water Soluble Fertilizer Industry
Key Drivers:
The market is primarily driven by the growing demand for high-yielding crops, coupled with the increasing adoption of advanced farming technologies and a greater focus on sustainable agriculture practices. Government policies promoting efficient fertilizer use also contribute to market growth. Technological innovations leading to improved fertilizer formulations and application techniques further boost the market.
Key Challenges and Restraints:
The water soluble fertilizer market faces challenges such as price volatility of raw materials, fluctuating energy costs, and complex regulatory landscapes in certain regions. Supply chain disruptions and competition from conventional fertilizers also pose significant restraints. Furthermore, environmental concerns and sustainability requirements exert pressure on manufacturers to adopt eco-friendly production practices. The estimated impact of these challenges on market growth in 2024 is approximately $xx Million in lost revenue.
Growth Drivers in the Water Soluble Fertilizer Industry Market
The key drivers include the rising global population leading to increased food demand, the expanding adoption of precision agriculture, and government initiatives promoting sustainable agriculture practices. Technological advancements in fertilizer formulations and application methods are also key growth catalysts. Favorable government policies and regulations supporting the use of efficient fertilizers further stimulate market expansion.
Challenges Impacting Water Soluble Fertilizer Industry Growth
Significant challenges impacting market growth include the volatility of raw material prices, which increase production costs and affect profitability. Furthermore, stringent environmental regulations and the need for sustainable production practices present substantial challenges. Competition from established conventional fertilizer manufacturers and potential supply chain disruptions also impede the market's growth trajectory.
Key Players Shaping the Water Soluble Fertilizer Industry Market
- Coromandel International Ltd
- Haifa Group
- Indian Farmers Fertiliser Cooperative Limited
- Grupa Azoty S A (Compo Expert)
- K+S Aktiengesellschaft
- Yara International AS
- ICL Group Ltd
- BMS Micro-Nutrients NV
- Sociedad Quimica y Minera de Chile SA
Significant Water Soluble Fertilizer Industry Milestones
- May 2022: ICL launched three new NPK formulations of Solinure, enhancing product offerings and increasing market competitiveness. This launch signaled an increased focus on optimizing yields.
- May 2022: ICL secured agreements for supplying 600,000 and 700,000 metric tons of potash to India and China, respectively, demonstrating significant market penetration in key regions. The deals solidified ICL's position within these markets.
- April 2023: K+S acquired a 75% share in Industrial Commodities Holdings (Pty) Ltd's fertilizer business, expanding its geographic footprint and strengthening its position in southern and eastern Africa. This strategic move significantly bolstered K+S's market presence and operational capabilities.
Future Outlook for Water Soluble Fertilizer Industry Market
The water soluble fertilizer market is projected to experience continued growth, driven by increasing demand for high-yielding crops, the rising adoption of precision agriculture technologies, and a growing awareness of sustainable farming practices. Strategic partnerships, product diversification, and expansion into new geographic markets will present significant opportunities for growth. The market is expected to witness increasing innovation in fertilizer formulations and application methods, further driving market expansion and enhancing its ability to address evolving agricultural needs.
Water Soluble Fertilizer Industry Segmentation
- 1. Production Analysis
- 2. Consumption Analysis
- 3. Import Market Analysis (Value & Volume)
- 4. Export Market Analysis (Value & Volume)
- 5. Price Trend Analysis
Water Soluble Fertilizer Industry Segmentation By Geography
-
1. North America
- 1.1. United States
- 1.2. Canada
- 1.3. Mexico
-
2. South America
- 2.1. Brazil
- 2.2. Argentina
- 2.3. Rest of South America
-
3. Europe
- 3.1. United Kingdom
- 3.2. Germany
- 3.3. France
- 3.4. Italy
- 3.5. Spain
- 3.6. Russia
- 3.7. Benelux
- 3.8. Nordics
- 3.9. Rest of Europe
-
4. Middle East & Africa
- 4.1. Turkey
- 4.2. Israel
- 4.3. GCC
- 4.4. North Africa
- 4.5. South Africa
- 4.6. Rest of Middle East & Africa
-
5. Asia Pacific
- 5.1. China
- 5.2. India
- 5.3. Japan
- 5.4. South Korea
- 5.5. ASEAN
- 5.6. Oceania
- 5.7. Rest of Asia Pacific
Water Soluble Fertilizer Industry Regional Market Share
Geographic Coverage of Water Soluble Fertilizer Industry
Water Soluble Fertilizer Industry REPORT HIGHLIGHTS
| Aspects | Details |
|---|---|
| Study Period | 2020-2034 |
| Base Year | 2025 |
| Estimated Year | 2026 |
| Forecast Period | 2026-2034 |
| Historical Period | 2020-2025 |
| Growth Rate | CAGR of 3.80% from 2020-2034 |
| Segmentation |
|
Table of Contents
- 1. Introduction
- 1.1. Research Scope
- 1.2. Market Segmentation
- 1.3. Research Objective
- 1.4. Definitions and Assumptions
- 2. Executive Summary
- 2.1. Market Snapshot
- 3. Market Dynamics
- 3.1. Market Drivers
- 3.2. Market Restrains
- 3.3. Market Trends
- 3.4. Market Opportunities
- 4. Market Factor Analysis
- 4.1. Porters Five Forces
- 4.1.1. Bargaining Power of Suppliers
- 4.1.2. Bargaining Power of Buyers
- 4.1.3. Threat of New Entrants
- 4.1.4. Threat of Substitutes
- 4.1.5. Competitive Rivalry
- 4.2. PESTEL analysis
- 4.3. BCG Analysis
- 4.3.1. Stars (High Growth, High Market Share)
- 4.3.2. Cash Cows (Low Growth, High Market Share)
- 4.3.3. Question Mark (High Growth, Low Market Share)
- 4.3.4. Dogs (Low Growth, Low Market Share)
- 4.4. Ansoff Matrix Analysis
- 4.5. Supply Chain Analysis
- 4.6. Regulatory Landscape
- 4.7. Current Market Potential and Opportunity Assessment (TAM–SAM–SOM Framework)
- 4.8. TIR Analyst Note
- 4.1. Porters Five Forces
- 5. Market Analysis, Insights and Forecast 2021-2033
- 5.1. Market Analysis, Insights and Forecast - by Production Analysis
- 5.2. Market Analysis, Insights and Forecast - by Consumption Analysis
- 5.3. Market Analysis, Insights and Forecast - by Import Market Analysis (Value & Volume)
- 5.4. Market Analysis, Insights and Forecast - by Export Market Analysis (Value & Volume)
- 5.5. Market Analysis, Insights and Forecast - by Price Trend Analysis
- 5.6. Market Analysis, Insights and Forecast - by Region
- 5.6.1. North America
- 5.6.2. South America
- 5.6.3. Europe
- 5.6.4. Middle East & Africa
- 5.6.5. Asia Pacific
- 6. Global Water Soluble Fertilizer Industry Analysis, Insights and Forecast, 2021-2033
- 6.1. Market Analysis, Insights and Forecast - by Production Analysis
- 6.2. Market Analysis, Insights and Forecast - by Consumption Analysis
- 6.3. Market Analysis, Insights and Forecast - by Import Market Analysis (Value & Volume)
- 6.4. Market Analysis, Insights and Forecast - by Export Market Analysis (Value & Volume)
- 6.5. Market Analysis, Insights and Forecast - by Price Trend Analysis
- 7. North America Water Soluble Fertilizer Industry Analysis, Insights and Forecast, 2020-2032
- 7.1. Market Analysis, Insights and Forecast - by Production Analysis
- 7.2. Market Analysis, Insights and Forecast - by Consumption Analysis
- 7.3. Market Analysis, Insights and Forecast - by Import Market Analysis (Value & Volume)
- 7.4. Market Analysis, Insights and Forecast - by Export Market Analysis (Value & Volume)
- 7.5. Market Analysis, Insights and Forecast - by Price Trend Analysis
- 8. South America Water Soluble Fertilizer Industry Analysis, Insights and Forecast, 2020-2032
- 8.1. Market Analysis, Insights and Forecast - by Production Analysis
- 8.2. Market Analysis, Insights and Forecast - by Consumption Analysis
- 8.3. Market Analysis, Insights and Forecast - by Import Market Analysis (Value & Volume)
- 8.4. Market Analysis, Insights and Forecast - by Export Market Analysis (Value & Volume)
- 8.5. Market Analysis, Insights and Forecast - by Price Trend Analysis
- 9. Europe Water Soluble Fertilizer Industry Analysis, Insights and Forecast, 2020-2032
- 9.1. Market Analysis, Insights and Forecast - by Production Analysis
- 9.2. Market Analysis, Insights and Forecast - by Consumption Analysis
- 9.3. Market Analysis, Insights and Forecast - by Import Market Analysis (Value & Volume)
- 9.4. Market Analysis, Insights and Forecast - by Export Market Analysis (Value & Volume)
- 9.5. Market Analysis, Insights and Forecast - by Price Trend Analysis
- 10. Middle East & Africa Water Soluble Fertilizer Industry Analysis, Insights and Forecast, 2020-2032
- 10.1. Market Analysis, Insights and Forecast - by Production Analysis
- 10.2. Market Analysis, Insights and Forecast - by Consumption Analysis
- 10.3. Market Analysis, Insights and Forecast - by Import Market Analysis (Value & Volume)
- 10.4. Market Analysis, Insights and Forecast - by Export Market Analysis (Value & Volume)
- 10.5. Market Analysis, Insights and Forecast - by Price Trend Analysis
- 11. Asia Pacific Water Soluble Fertilizer Industry Analysis, Insights and Forecast, 2020-2032
- 11.1. Market Analysis, Insights and Forecast - by Production Analysis
- 11.2. Market Analysis, Insights and Forecast - by Consumption Analysis
- 11.3. Market Analysis, Insights and Forecast - by Import Market Analysis (Value & Volume)
- 11.4. Market Analysis, Insights and Forecast - by Export Market Analysis (Value & Volume)
- 11.5. Market Analysis, Insights and Forecast - by Price Trend Analysis
- 12. Competitive Analysis
- 12.1. Company Profiles
- 12.1.1 Coromandel International Ltd
- 12.1.1.1. Company Overview
- 12.1.1.2. Products
- 12.1.1.3. Company Financials
- 12.1.1.4. SWOT Analysis
- 12.1.2 Haifa Group
- 12.1.2.1. Company Overview
- 12.1.2.2. Products
- 12.1.2.3. Company Financials
- 12.1.2.4. SWOT Analysis
- 12.1.3 Indian Farmers Fertiliser Cooperative Limited
- 12.1.3.1. Company Overview
- 12.1.3.2. Products
- 12.1.3.3. Company Financials
- 12.1.3.4. SWOT Analysis
- 12.1.4 Grupa Azoty S A (Compo Expert)
- 12.1.4.1. Company Overview
- 12.1.4.2. Products
- 12.1.4.3. Company Financials
- 12.1.4.4. SWOT Analysis
- 12.1.5 K+S Aktiengesellschaft
- 12.1.5.1. Company Overview
- 12.1.5.2. Products
- 12.1.5.3. Company Financials
- 12.1.5.4. SWOT Analysis
- 12.1.6 Yara International AS
- 12.1.6.1. Company Overview
- 12.1.6.2. Products
- 12.1.6.3. Company Financials
- 12.1.6.4. SWOT Analysis
- 12.1.7 ICL Group Ltd
- 12.1.7.1. Company Overview
- 12.1.7.2. Products
- 12.1.7.3. Company Financials
- 12.1.7.4. SWOT Analysis
- 12.1.8 BMS Micro-Nutrients NV
- 12.1.8.1. Company Overview
- 12.1.8.2. Products
- 12.1.8.3. Company Financials
- 12.1.8.4. SWOT Analysis
- 12.1.9 Sociedad Quimica y Minera de Chile SA
- 12.1.9.1. Company Overview
- 12.1.9.2. Products
- 12.1.9.3. Company Financials
- 12.1.9.4. SWOT Analysis
- 12.1.1 Coromandel International Ltd
- 12.2. Market Entropy
- 12.2.1 Company's Key Areas Served
- 12.2.2 Recent Developments
- 12.3. Company Market Share Analysis 2025
- 12.3.1 Top 5 Companies Market Share Analysis
- 12.3.2 Top 3 Companies Market Share Analysis
- 12.4. List of Potential Customers
- 13. Research Methodology
List of Figures
- Figure 1: Global Water Soluble Fertilizer Industry Revenue Breakdown (Million, %) by Region 2025 & 2033
- Figure 2: North America Water Soluble Fertilizer Industry Revenue (Million), by Production Analysis 2025 & 2033
- Figure 3: North America Water Soluble Fertilizer Industry Revenue Share (%), by Production Analysis 2025 & 2033
- Figure 4: North America Water Soluble Fertilizer Industry Revenue (Million), by Consumption Analysis 2025 & 2033
- Figure 5: North America Water Soluble Fertilizer Industry Revenue Share (%), by Consumption Analysis 2025 & 2033
- Figure 6: North America Water Soluble Fertilizer Industry Revenue (Million), by Import Market Analysis (Value & Volume) 2025 & 2033
- Figure 7: North America Water Soluble Fertilizer Industry Revenue Share (%), by Import Market Analysis (Value & Volume) 2025 & 2033
- Figure 8: North America Water Soluble Fertilizer Industry Revenue (Million), by Export Market Analysis (Value & Volume) 2025 & 2033
- Figure 9: North America Water Soluble Fertilizer Industry Revenue Share (%), by Export Market Analysis (Value & Volume) 2025 & 2033
- Figure 10: North America Water Soluble Fertilizer Industry Revenue (Million), by Price Trend Analysis 2025 & 2033
- Figure 11: North America Water Soluble Fertilizer Industry Revenue Share (%), by Price Trend Analysis 2025 & 2033
- Figure 12: North America Water Soluble Fertilizer Industry Revenue (Million), by Country 2025 & 2033
- Figure 13: North America Water Soluble Fertilizer Industry Revenue Share (%), by Country 2025 & 2033
- Figure 14: South America Water Soluble Fertilizer Industry Revenue (Million), by Production Analysis 2025 & 2033
- Figure 15: South America Water Soluble Fertilizer Industry Revenue Share (%), by Production Analysis 2025 & 2033
- Figure 16: South America Water Soluble Fertilizer Industry Revenue (Million), by Consumption Analysis 2025 & 2033
- Figure 17: South America Water Soluble Fertilizer Industry Revenue Share (%), by Consumption Analysis 2025 & 2033
- Figure 18: South America Water Soluble Fertilizer Industry Revenue (Million), by Import Market Analysis (Value & Volume) 2025 & 2033
- Figure 19: South America Water Soluble Fertilizer Industry Revenue Share (%), by Import Market Analysis (Value & Volume) 2025 & 2033
- Figure 20: South America Water Soluble Fertilizer Industry Revenue (Million), by Export Market Analysis (Value & Volume) 2025 & 2033
- Figure 21: South America Water Soluble Fertilizer Industry Revenue Share (%), by Export Market Analysis (Value & Volume) 2025 & 2033
- Figure 22: South America Water Soluble Fertilizer Industry Revenue (Million), by Price Trend Analysis 2025 & 2033
- Figure 23: South America Water Soluble Fertilizer Industry Revenue Share (%), by Price Trend Analysis 2025 & 2033
- Figure 24: South America Water Soluble Fertilizer Industry Revenue (Million), by Country 2025 & 2033
- Figure 25: South America Water Soluble Fertilizer Industry Revenue Share (%), by Country 2025 & 2033
- Figure 26: Europe Water Soluble Fertilizer Industry Revenue (Million), by Production Analysis 2025 & 2033
- Figure 27: Europe Water Soluble Fertilizer Industry Revenue Share (%), by Production Analysis 2025 & 2033
- Figure 28: Europe Water Soluble Fertilizer Industry Revenue (Million), by Consumption Analysis 2025 & 2033
- Figure 29: Europe Water Soluble Fertilizer Industry Revenue Share (%), by Consumption Analysis 2025 & 2033
- Figure 30: Europe Water Soluble Fertilizer Industry Revenue (Million), by Import Market Analysis (Value & Volume) 2025 & 2033
- Figure 31: Europe Water Soluble Fertilizer Industry Revenue Share (%), by Import Market Analysis (Value & Volume) 2025 & 2033
- Figure 32: Europe Water Soluble Fertilizer Industry Revenue (Million), by Export Market Analysis (Value & Volume) 2025 & 2033
- Figure 33: Europe Water Soluble Fertilizer Industry Revenue Share (%), by Export Market Analysis (Value & Volume) 2025 & 2033
- Figure 34: Europe Water Soluble Fertilizer Industry Revenue (Million), by Price Trend Analysis 2025 & 2033
- Figure 35: Europe Water Soluble Fertilizer Industry Revenue Share (%), by Price Trend Analysis 2025 & 2033
- Figure 36: Europe Water Soluble Fertilizer Industry Revenue (Million), by Country 2025 & 2033
- Figure 37: Europe Water Soluble Fertilizer Industry Revenue Share (%), by Country 2025 & 2033
- Figure 38: Middle East & Africa Water Soluble Fertilizer Industry Revenue (Million), by Production Analysis 2025 & 2033
- Figure 39: Middle East & Africa Water Soluble Fertilizer Industry Revenue Share (%), by Production Analysis 2025 & 2033
- Figure 40: Middle East & Africa Water Soluble Fertilizer Industry Revenue (Million), by Consumption Analysis 2025 & 2033
- Figure 41: Middle East & Africa Water Soluble Fertilizer Industry Revenue Share (%), by Consumption Analysis 2025 & 2033
- Figure 42: Middle East & Africa Water Soluble Fertilizer Industry Revenue (Million), by Import Market Analysis (Value & Volume) 2025 & 2033
- Figure 43: Middle East & Africa Water Soluble Fertilizer Industry Revenue Share (%), by Import Market Analysis (Value & Volume) 2025 & 2033
- Figure 44: Middle East & Africa Water Soluble Fertilizer Industry Revenue (Million), by Export Market Analysis (Value & Volume) 2025 & 2033
- Figure 45: Middle East & Africa Water Soluble Fertilizer Industry Revenue Share (%), by Export Market Analysis (Value & Volume) 2025 & 2033
- Figure 46: Middle East & Africa Water Soluble Fertilizer Industry Revenue (Million), by Price Trend Analysis 2025 & 2033
- Figure 47: Middle East & Africa Water Soluble Fertilizer Industry Revenue Share (%), by Price Trend Analysis 2025 & 2033
- Figure 48: Middle East & Africa Water Soluble Fertilizer Industry Revenue (Million), by Country 2025 & 2033
- Figure 49: Middle East & Africa Water Soluble Fertilizer Industry Revenue Share (%), by Country 2025 & 2033
- Figure 50: Asia Pacific Water Soluble Fertilizer Industry Revenue (Million), by Production Analysis 2025 & 2033
- Figure 51: Asia Pacific Water Soluble Fertilizer Industry Revenue Share (%), by Production Analysis 2025 & 2033
- Figure 52: Asia Pacific Water Soluble Fertilizer Industry Revenue (Million), by Consumption Analysis 2025 & 2033
- Figure 53: Asia Pacific Water Soluble Fertilizer Industry Revenue Share (%), by Consumption Analysis 2025 & 2033
- Figure 54: Asia Pacific Water Soluble Fertilizer Industry Revenue (Million), by Import Market Analysis (Value & Volume) 2025 & 2033
- Figure 55: Asia Pacific Water Soluble Fertilizer Industry Revenue Share (%), by Import Market Analysis (Value & Volume) 2025 & 2033
- Figure 56: Asia Pacific Water Soluble Fertilizer Industry Revenue (Million), by Export Market Analysis (Value & Volume) 2025 & 2033
- Figure 57: Asia Pacific Water Soluble Fertilizer Industry Revenue Share (%), by Export Market Analysis (Value & Volume) 2025 & 2033
- Figure 58: Asia Pacific Water Soluble Fertilizer Industry Revenue (Million), by Price Trend Analysis 2025 & 2033
- Figure 59: Asia Pacific Water Soluble Fertilizer Industry Revenue Share (%), by Price Trend Analysis 2025 & 2033
- Figure 60: Asia Pacific Water Soluble Fertilizer Industry Revenue (Million), by Country 2025 & 2033
- Figure 61: Asia Pacific Water Soluble Fertilizer Industry Revenue Share (%), by Country 2025 & 2033
List of Tables
- Table 1: Global Water Soluble Fertilizer Industry Revenue Million Forecast, by Production Analysis 2020 & 2033
- Table 2: Global Water Soluble Fertilizer Industry Revenue Million Forecast, by Consumption Analysis 2020 & 2033
- Table 3: Global Water Soluble Fertilizer Industry Revenue Million Forecast, by Import Market Analysis (Value & Volume) 2020 & 2033
- Table 4: Global Water Soluble Fertilizer Industry Revenue Million Forecast, by Export Market Analysis (Value & Volume) 2020 & 2033
- Table 5: Global Water Soluble Fertilizer Industry Revenue Million Forecast, by Price Trend Analysis 2020 & 2033
- Table 6: Global Water Soluble Fertilizer Industry Revenue Million Forecast, by Region 2020 & 2033
- Table 7: Global Water Soluble Fertilizer Industry Revenue Million Forecast, by Production Analysis 2020 & 2033
- Table 8: Global Water Soluble Fertilizer Industry Revenue Million Forecast, by Consumption Analysis 2020 & 2033
- Table 9: Global Water Soluble Fertilizer Industry Revenue Million Forecast, by Import Market Analysis (Value & Volume) 2020 & 2033
- Table 10: Global Water Soluble Fertilizer Industry Revenue Million Forecast, by Export Market Analysis (Value & Volume) 2020 & 2033
- Table 11: Global Water Soluble Fertilizer Industry Revenue Million Forecast, by Price Trend Analysis 2020 & 2033
- Table 12: Global Water Soluble Fertilizer Industry Revenue Million Forecast, by Country 2020 & 2033
- Table 13: United States Water Soluble Fertilizer Industry Revenue (Million) Forecast, by Application 2020 & 2033
- Table 14: Canada Water Soluble Fertilizer Industry Revenue (Million) Forecast, by Application 2020 & 2033
- Table 15: Mexico Water Soluble Fertilizer Industry Revenue (Million) Forecast, by Application 2020 & 2033
- Table 16: Global Water Soluble Fertilizer Industry Revenue Million Forecast, by Production Analysis 2020 & 2033
- Table 17: Global Water Soluble Fertilizer Industry Revenue Million Forecast, by Consumption Analysis 2020 & 2033
- Table 18: Global Water Soluble Fertilizer Industry Revenue Million Forecast, by Import Market Analysis (Value & Volume) 2020 & 2033
- Table 19: Global Water Soluble Fertilizer Industry Revenue Million Forecast, by Export Market Analysis (Value & Volume) 2020 & 2033
- Table 20: Global Water Soluble Fertilizer Industry Revenue Million Forecast, by Price Trend Analysis 2020 & 2033
- Table 21: Global Water Soluble Fertilizer Industry Revenue Million Forecast, by Country 2020 & 2033
- Table 22: Brazil Water Soluble Fertilizer Industry Revenue (Million) Forecast, by Application 2020 & 2033
- Table 23: Argentina Water Soluble Fertilizer Industry Revenue (Million) Forecast, by Application 2020 & 2033
- Table 24: Rest of South America Water Soluble Fertilizer Industry Revenue (Million) Forecast, by Application 2020 & 2033
- Table 25: Global Water Soluble Fertilizer Industry Revenue Million Forecast, by Production Analysis 2020 & 2033
- Table 26: Global Water Soluble Fertilizer Industry Revenue Million Forecast, by Consumption Analysis 2020 & 2033
- Table 27: Global Water Soluble Fertilizer Industry Revenue Million Forecast, by Import Market Analysis (Value & Volume) 2020 & 2033
- Table 28: Global Water Soluble Fertilizer Industry Revenue Million Forecast, by Export Market Analysis (Value & Volume) 2020 & 2033
- Table 29: Global Water Soluble Fertilizer Industry Revenue Million Forecast, by Price Trend Analysis 2020 & 2033
- Table 30: Global Water Soluble Fertilizer Industry Revenue Million Forecast, by Country 2020 & 2033
- Table 31: United Kingdom Water Soluble Fertilizer Industry Revenue (Million) Forecast, by Application 2020 & 2033
- Table 32: Germany Water Soluble Fertilizer Industry Revenue (Million) Forecast, by Application 2020 & 2033
- Table 33: France Water Soluble Fertilizer Industry Revenue (Million) Forecast, by Application 2020 & 2033
- Table 34: Italy Water Soluble Fertilizer Industry Revenue (Million) Forecast, by Application 2020 & 2033
- Table 35: Spain Water Soluble Fertilizer Industry Revenue (Million) Forecast, by Application 2020 & 2033
- Table 36: Russia Water Soluble Fertilizer Industry Revenue (Million) Forecast, by Application 2020 & 2033
- Table 37: Benelux Water Soluble Fertilizer Industry Revenue (Million) Forecast, by Application 2020 & 2033
- Table 38: Nordics Water Soluble Fertilizer Industry Revenue (Million) Forecast, by Application 2020 & 2033
- Table 39: Rest of Europe Water Soluble Fertilizer Industry Revenue (Million) Forecast, by Application 2020 & 2033
- Table 40: Global Water Soluble Fertilizer Industry Revenue Million Forecast, by Production Analysis 2020 & 2033
- Table 41: Global Water Soluble Fertilizer Industry Revenue Million Forecast, by Consumption Analysis 2020 & 2033
- Table 42: Global Water Soluble Fertilizer Industry Revenue Million Forecast, by Import Market Analysis (Value & Volume) 2020 & 2033
- Table 43: Global Water Soluble Fertilizer Industry Revenue Million Forecast, by Export Market Analysis (Value & Volume) 2020 & 2033
- Table 44: Global Water Soluble Fertilizer Industry Revenue Million Forecast, by Price Trend Analysis 2020 & 2033
- Table 45: Global Water Soluble Fertilizer Industry Revenue Million Forecast, by Country 2020 & 2033
- Table 46: Turkey Water Soluble Fertilizer Industry Revenue (Million) Forecast, by Application 2020 & 2033
- Table 47: Israel Water Soluble Fertilizer Industry Revenue (Million) Forecast, by Application 2020 & 2033
- Table 48: GCC Water Soluble Fertilizer Industry Revenue (Million) Forecast, by Application 2020 & 2033
- Table 49: North Africa Water Soluble Fertilizer Industry Revenue (Million) Forecast, by Application 2020 & 2033
- Table 50: South Africa Water Soluble Fertilizer Industry Revenue (Million) Forecast, by Application 2020 & 2033
- Table 51: Rest of Middle East & Africa Water Soluble Fertilizer Industry Revenue (Million) Forecast, by Application 2020 & 2033
- Table 52: Global Water Soluble Fertilizer Industry Revenue Million Forecast, by Production Analysis 2020 & 2033
- Table 53: Global Water Soluble Fertilizer Industry Revenue Million Forecast, by Consumption Analysis 2020 & 2033
- Table 54: Global Water Soluble Fertilizer Industry Revenue Million Forecast, by Import Market Analysis (Value & Volume) 2020 & 2033
- Table 55: Global Water Soluble Fertilizer Industry Revenue Million Forecast, by Export Market Analysis (Value & Volume) 2020 & 2033
- Table 56: Global Water Soluble Fertilizer Industry Revenue Million Forecast, by Price Trend Analysis 2020 & 2033
- Table 57: Global Water Soluble Fertilizer Industry Revenue Million Forecast, by Country 2020 & 2033
- Table 58: China Water Soluble Fertilizer Industry Revenue (Million) Forecast, by Application 2020 & 2033
- Table 59: India Water Soluble Fertilizer Industry Revenue (Million) Forecast, by Application 2020 & 2033
- Table 60: Japan Water Soluble Fertilizer Industry Revenue (Million) Forecast, by Application 2020 & 2033
- Table 61: South Korea Water Soluble Fertilizer Industry Revenue (Million) Forecast, by Application 2020 & 2033
- Table 62: ASEAN Water Soluble Fertilizer Industry Revenue (Million) Forecast, by Application 2020 & 2033
- Table 63: Oceania Water Soluble Fertilizer Industry Revenue (Million) Forecast, by Application 2020 & 2033
- Table 64: Rest of Asia Pacific Water Soluble Fertilizer Industry Revenue (Million) Forecast, by Application 2020 & 2033
Frequently Asked Questions
1. What is the projected Compound Annual Growth Rate (CAGR) of the Water Soluble Fertilizer Industry?
The projected CAGR is approximately 3.80%.
2. Which companies are prominent players in the Water Soluble Fertilizer Industry?
Key companies in the market include Coromandel International Ltd, Haifa Group, Indian Farmers Fertiliser Cooperative Limited, Grupa Azoty S A (Compo Expert), K+S Aktiengesellschaft, Yara International AS, ICL Group Ltd, BMS Micro-Nutrients NV, Sociedad Quimica y Minera de Chile SA.
3. What are the main segments of the Water Soluble Fertilizer Industry?
The market segments include Production Analysis, Consumption Analysis, Import Market Analysis (Value & Volume), Export Market Analysis (Value & Volume), Price Trend Analysis.
4. Can you provide details about the market size?
The market size is estimated to be USD XX Million as of 2022.
5. What are some drivers contributing to market growth?
Adoption of Organic and Eco-friendly Farming Practices; Declining Area of Arable Land and Rising Food Security Concerns.
6. What are the notable trends driving market growth?
OTHER KEY INDUSTRY TRENDS COVERED IN THE REPORT.
7. Are there any restraints impacting market growth?
High Demand for Conventional and Synthetic Products; Lack of Awareness and Other Factors Limiting the Adoption of Agricultural Inoculants.
8. Can you provide examples of recent developments in the market?
April 2023: K+S acquired a 75% share of the fertilizer business of South African trading company Industrial Commodities Holdings (Pty) Ltd (ICH). In addition to expanding the core business, K+S is strengthening its operations in southern and eastern Africa as a result of this acquisition. The newly acquired fertilizer business in the future to be operated in a joint venture, under the name of FertivPty Ltd.May 2022: ICL launched three new NPK formulations of Solinure, a product with increased trace elements to optimize yields.May 2022: ICL signed an agreement with customers in India and China to supply 600,000 and 700,000 metric tons of potash, respectively, in 2022 at USD 590 per ton.
9. What pricing options are available for accessing the report?
Pricing options include single-user, multi-user, and enterprise licenses priced at USD 3800, USD 4500, and USD 5800 respectively.
10. Is the market size provided in terms of value or volume?
The market size is provided in terms of value, measured in Million.
11. Are there any specific market keywords associated with the report?
Yes, the market keyword associated with the report is "Water Soluble Fertilizer Industry," which aids in identifying and referencing the specific market segment covered.
12. How do I determine which pricing option suits my needs best?
The pricing options vary based on user requirements and access needs. Individual users may opt for single-user licenses, while businesses requiring broader access may choose multi-user or enterprise licenses for cost-effective access to the report.
13. Are there any additional resources or data provided in the Water Soluble Fertilizer Industry report?
While the report offers comprehensive insights, it's advisable to review the specific contents or supplementary materials provided to ascertain if additional resources or data are available.
14. How can I stay updated on further developments or reports in the Water Soluble Fertilizer Industry?
To stay informed about further developments, trends, and reports in the Water Soluble Fertilizer Industry, consider subscribing to industry newsletters, following relevant companies and organizations, or regularly checking reputable industry news sources and publications.
Methodology
Step 1 - Identification of Relevant Samples Size from Population Database


Step 2 - Approaches for Defining Global Market Size (Value, Volume* & Price*)

Note*: In applicable scenarios
Step 3 - Data Sources
Primary Research
- Web Analytics
- Survey Reports
- Research Institute
- Latest Research Reports
- Opinion Leaders
Secondary Research
- Annual Reports
- White Paper
- Latest Press Release
- Industry Association
- Paid Database
- Investor Presentations

Step 4 - Data Triangulation
Involves using different sources of information in order to increase the validity of a study
These sources are likely to be stakeholders in a program - participants, other researchers, program staff, other community members, and so on.
Then we put all data in single framework & apply various statistical tools to find out the dynamic on the market.
During the analysis stage, feedback from the stakeholder groups would be compared to determine areas of agreement as well as areas of divergence