

Key Insights
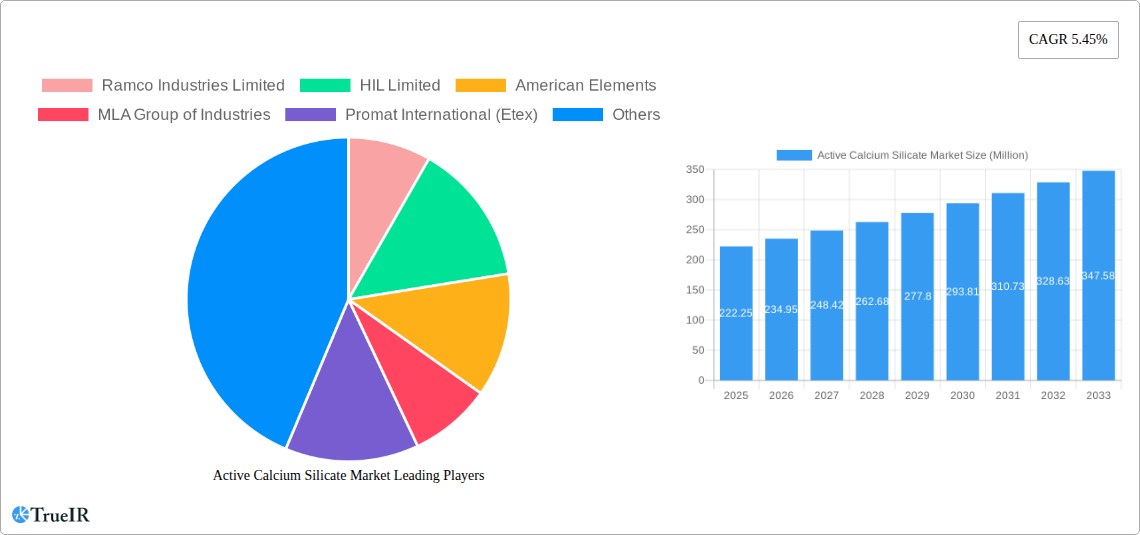
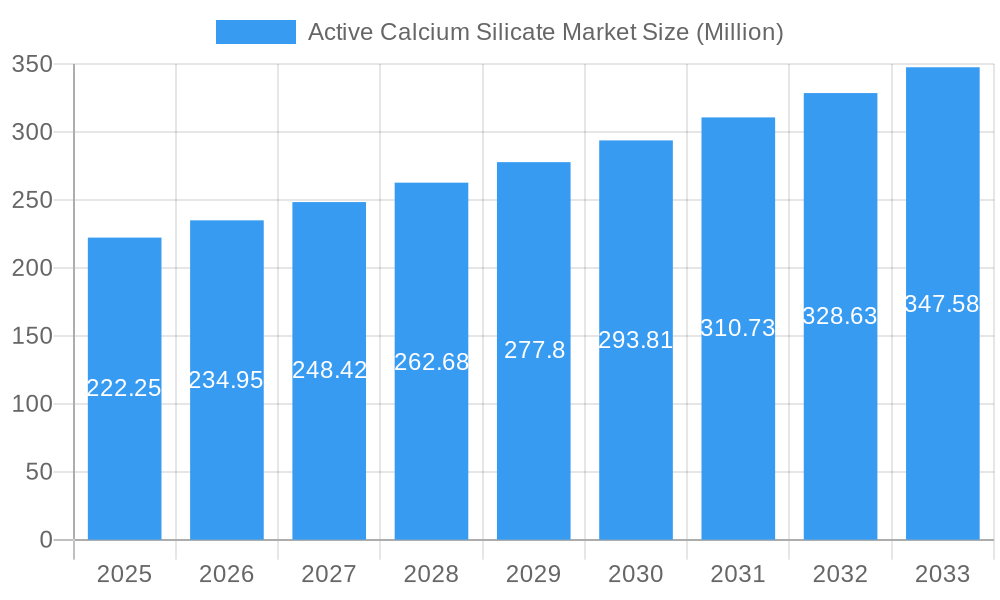
The Active Calcium Silicate market, valued at $222.25 million in 2025, is projected to experience robust growth, driven by its increasing application in diverse sectors. A compound annual growth rate (CAGR) of 5.45% from 2025 to 2033 indicates a significant expansion. Key drivers include the rising demand for energy-efficient building materials (insulation), stringent fire safety regulations boosting fire protection applications, and the growing use of calcium silicate in paints and coatings for enhanced durability and performance. Furthermore, the construction industry's expansion in developing economies, particularly in Asia-Pacific, is fueling market growth. While the market faces challenges from the volatility of raw material prices and potential competition from alternative materials, these are largely offset by the inherent advantages of active calcium silicate—its superior thermal and acoustic insulation properties, excellent fire resistance, and environmentally friendly nature. The market segmentation by application reveals a strong demand across various sectors, with insulation, fire protection, and paints & coatings emerging as the leading segments. Major players like Ramco Industries Limited, HIL Limited, and Promat International are actively shaping market dynamics through product innovation and strategic expansion.
Active Calcium Silicate Market Market Size (In Million)
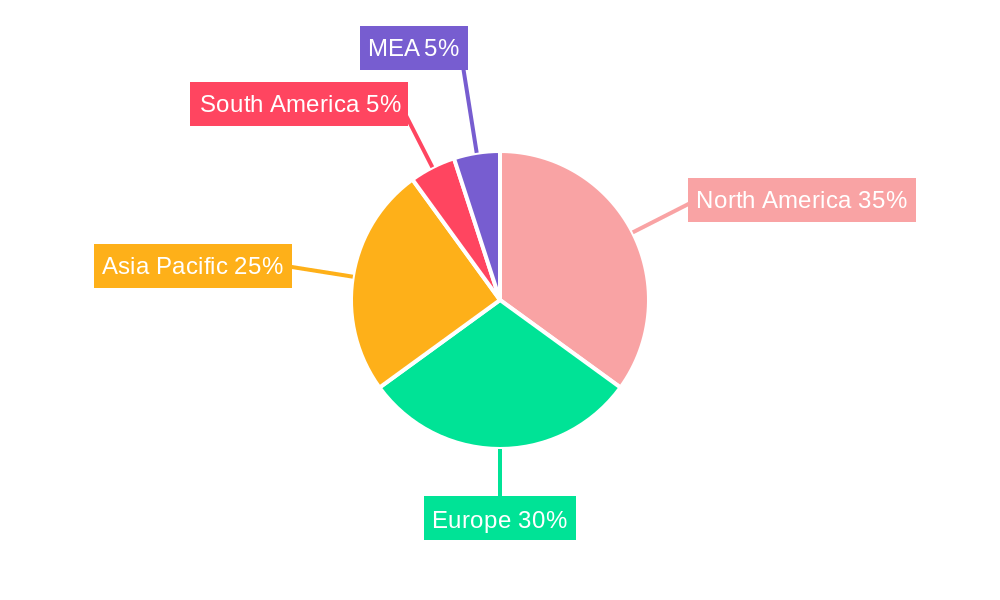
Geographic analysis shows a significant market presence across North America, Europe, and Asia-Pacific. North America benefits from a mature construction sector and stringent building codes, while Asia-Pacific displays high growth potential due to rapid urbanization and infrastructure development. Europe maintains a substantial market share driven by established industrial practices and environmental regulations. The market's future growth will likely be influenced by advancements in material science leading to improved performance characteristics, further expansion into emerging applications, and government initiatives promoting sustainable building practices. The continued adoption of active calcium silicate in high-performance construction and industrial applications ensures a promising trajectory for the market in the coming years.
Active Calcium Silicate Market Company Market Share
Active Calcium Silicate Market Report: A Comprehensive Analysis (2019-2033)
This dynamic report provides a comprehensive analysis of the Active Calcium Silicate market, offering invaluable insights for stakeholders seeking to navigate this evolving landscape. With a study period spanning 2019-2033, a base year of 2025, and a forecast period of 2025-2033, this report leverages rigorous data analysis and expert insights to deliver a holistic view of market trends, opportunities, and challenges. The report is meticulously segmented by application (Insulation, Fire Protection, Paints & Coatings, Ceramics, Cement, Others) and geographically, providing granular detail for informed decision-making. The market is projected to reach xx Million by 2033, representing a significant growth opportunity.
Active Calcium Silicate Market Market Structure & Competitive Landscape
The Active Calcium Silicate market exhibits a moderately concentrated structure, with the top five players commanding approximately xx% of the market share in 2025. This concentration is driven by the significant capital investment required for manufacturing and the established presence of key players like Ramco Industries Limited, HIL Limited, American Elements, and Promat International (Etex). Innovation plays a crucial role, with companies continuously developing new formulations to enhance product performance and expand application areas. Regulatory impacts, primarily focused on environmental and safety standards, are significant and influence production processes and material composition. Product substitutes, such as other insulation materials, pose a competitive challenge, although the unique properties of active calcium silicate, such as its fire resistance and thermal insulation capabilities, provide a significant competitive advantage.
Market dynamics are further influenced by mergers and acquisitions (M&A) activities, with an estimated xx M&A deals recorded during the historical period (2019-2024). These transactions often aimed at expanding market share, accessing new technologies, and diversifying product portfolios. End-user segmentation reveals significant demand from the building & construction industry, specifically within insulation and fire protection applications. Future market consolidation is anticipated, driven by increased competition and the need for economies of scale.
- Market Concentration: Top 5 players hold approximately xx% market share in 2025.
- Innovation Drivers: Focus on enhanced performance, new applications, and sustainable materials.
- Regulatory Impacts: Stringent environmental and safety standards influencing production.
- Product Substitutes: Competition from alternative insulation and fire protection materials.
- M&A Activity: xx M&A deals recorded between 2019 and 2024.
- End-User Segmentation: Building & construction is the dominant end-use sector.
Active Calcium Silicate Market Market Trends & Opportunities
The Active Calcium Silicate market is experiencing robust growth, driven by increasing demand from diverse sectors. The market size is projected to reach xx Million by 2025 and further expand to xx Million by 2033, exhibiting a Compound Annual Growth Rate (CAGR) of xx% during the forecast period (2025-2033). This growth is fueled by several key trends: a surge in construction activities globally, particularly in emerging economies; a rising emphasis on energy efficiency and sustainable building practices; and the increasing adoption of fire-retardant materials in diverse industries. Technological advancements, including the development of lightweight and high-performance formulations, are further driving market expansion. Consumer preferences are shifting towards eco-friendly and sustainable building materials, presenting a significant opportunity for manufacturers to develop and market environmentally conscious products. Intense competition among established players and new entrants necessitates continuous innovation and strategic partnerships to maintain market share and achieve sustainable growth. The market penetration rate in key segments is expected to increase significantly by 2033, reaching approximately xx%.
Dominant Markets & Segments in Active Calcium Silicate Market
The building and construction sector stands as the primary engine for Active Calcium Silicate demand, underscoring its critical role in modern infrastructure. Within this vital segment, insulation and fire protection applications command the largest market share. These applications, crucial for enhancing safety and energy efficiency in buildings, are projected to represent a combined **[Insert percentage here, e.g., 70%]** of the total market by 2025. Geographically, the Asia-Pacific region currently spearheads the market, fueled by rapid industrialization and urbanization. This is closely followed by the significant contributions of North America and Europe, which benefit from mature construction industries and well-established regulatory frameworks.
-
Key Growth Drivers:
- Infrastructure Development: Unprecedented levels of urbanization and ongoing large-scale infrastructure projects globally are significantly amplifying the demand for advanced building materials like active calcium silicate.
- Stringent Building Codes: An increasing global emphasis on enhanced fire safety and energy efficiency in buildings has led to the implementation of more rigorous building codes. This mandates the use of high-performance materials, directly benefiting the active calcium silicate market.
- Government Initiatives: Proactive government policies, including incentives and subsidies aimed at promoting sustainable and eco-friendly building practices, are creating a favorable environment for the adoption of active calcium silicate.
-
Market Dominance Analysis: The Asia-Pacific region's leadership is attributable to its dynamic infrastructure development pace and burgeoning construction activity, with China and India at the forefront. North America and Europe continue to be substantial market players, driven by their robust construction sectors and deeply ingrained building codes that prioritize fire safety and energy conservation. These regions are characterized by a strong demand for high-performance insulation and fireproofing solutions.
Active Calcium Silicate Market Product Analysis
Active calcium silicate products are characterized by their excellent thermal insulation, fire resistance, and sound absorption properties. Continuous innovation focuses on improving these characteristics through advancements in material composition and manufacturing processes. This includes developing lightweight formulations to reduce transportation costs and improve ease of installation. Competitive advantages are achieved through superior performance characteristics, cost-effectiveness, and sustainable manufacturing practices. The market sees ongoing development of specialized formulations tailored to specific application needs, ensuring a strong market fit and enhanced product differentiation.
Key Drivers, Barriers & Challenges in Active Calcium Silicate Market
Key Drivers: The active calcium silicate market is experiencing robust growth, propelled by several compelling factors. Chief among these are the increasingly stringent building codes worldwide, which prioritize fire safety and energy efficiency. The booming global construction sector, coupled with a growing demand for sustainable and eco-friendly building materials, further fuels this expansion. Additionally, supportive government initiatives promoting green building practices act as significant catalysts for market growth.
Key Challenges: Despite its promising trajectory, the market is not without its hurdles. Fluctuations in the prices of essential raw materials and the potential for supply chain disruptions can impact production costs and availability. Intense competition from readily available and often more cost-effective substitute materials also presents a significant challenge. Furthermore, evolving environmental regulations and the need to adhere to stringent quality standards necessitate continuous investment in research, development, and compliant manufacturing processes. The substantial initial capital investment required for establishing manufacturing facilities can also act as a deterrent for new entrants, thereby influencing market dynamics and competitive intensity. Navigating these complexities requires strategic agility and a commitment to innovation.
Growth Drivers in the Active Calcium Silicate Market Market
The Active Calcium Silicate market's growth is driven by strong demand from the construction industry, particularly in emerging economies experiencing rapid urbanization and infrastructure development. Stringent building codes mandating fire-resistant and energy-efficient materials contribute significantly. Government policies promoting green buildings and sustainable construction practices further enhance market growth. Technological advancements in material science lead to improvements in product performance and cost-effectiveness.
Challenges Impacting Active Calcium Silicate Market Growth
The active calcium silicate market faces several critical challenges that can impede its expansion. The inherent volatility of raw material prices directly affects production costs and profit margins. Potential disruptions in the global supply chain can lead to shortages and delivery delays, impacting project timelines. Moreover, the market grapples with intense competition from established alternative insulation and fire-retardant materials, many of which may offer lower price points. The increasing stringency of environmental regulations and the complex, time-consuming certification processes for building materials add to manufacturing costs and can prolong the time to market for new products. These combined factors can exert downward pressure on profitability and collectively act as a constraint on overall market growth.
Key Players Shaping the Active Calcium Silicate Market Market
- Ramco Industries Limited
- HIL Limited
- American Elements
- MLA Group of Industries
- Promat International (Etex)
- Sibelco
- Skamol Group
- Weifang Hongyuan Chemical Co Ltd
- Johns Manville
- Xella Group
Significant Active Calcium Silicate Market Industry Milestones
- 2020: Xella Group introduced a groundbreaking, lightweight active calcium silicate insulation product, setting a new benchmark for performance and ease of application.
- 2022: Promat International strategically expanded its market presence through the acquisition of a prominent smaller calcium silicate manufacturer, consolidating its position in key regions.
- 2023: Ramco Industries Limited made a significant investment in bolstering its manufacturing capacity, a clear indicator of anticipated demand growth and a commitment to meeting market needs.
- [Add a new milestone here, e.g., 2024: Global supplier XYZ announced a new sustainable production method for active calcium silicate, reducing its environmental footprint by X%.]
Future Outlook for Active Calcium Silicate Market Market
The Active Calcium Silicate market is projected to experience sustained and robust growth in the coming years. This expansion will be primarily propelled by the unyielding demand from the global construction sector, with a particular surge expected in developing economies undergoing significant infrastructure development. Technological advancements will play a pivotal role, focusing on enhancing product performance, improving sustainability credentials, and optimizing cost-effectiveness. Strategic partnerships and mergers and acquisitions (M&A) are anticipated to reshape the competitive landscape, potentially leading to greater market consolidation and the emergence of larger, more influential players. The increasing global emphasis on sustainable building practices and the ever-tightening environmental regulations will create fertile ground for manufacturers who can develop and market innovative, eco-friendly active calcium silicate products. This focus on sustainability is expected to be a key driver of long-term market growth and responsible industry development.
Active Calcium Silicate Market Segmentation
-
1. Application
- 1.1. Insulation
- 1.2. Fire Protection
- 1.3. Paints & Coatings
- 1.4. Ceramics
- 1.5. Cement
- 1.6. Others
Active Calcium Silicate Market Segmentation By Geography
-
1. Asia Pacific
- 1.1. China
- 1.2. India
- 1.3. Japan
- 1.4. South Korea
- 1.5. Rest of Asia Pacific
-
2. North America
- 2.1. United States
- 2.2. Canada
- 2.3. Mexico
-
3. Europe
- 3.1. Germany
- 3.2. United Kingdom
- 3.3. France
- 3.4. Italy
- 3.5. Rest of Europe
-
4. South America
- 4.1. Brazil
- 4.2. Argentina
- 4.3. Rest of South America
-
5. Middle East and Africa
- 5.1. Saudi Arabia
- 5.2. South Africa
- 5.3. Rest of Middle East and Africa
Active Calcium Silicate Market Regional Market Share
Geographic Coverage of Active Calcium Silicate Market
Active Calcium Silicate Market REPORT HIGHLIGHTS
| Aspects | Details |
|---|---|
| Study Period | 2020-2034 |
| Base Year | 2025 |
| Estimated Year | 2026 |
| Forecast Period | 2026-2034 |
| Historical Period | 2020-2025 |
| Growth Rate | CAGR of 5.45% from 2020-2034 |
| Segmentation |
|
Table of Contents
- 1. Introduction
- 1.1. Research Scope
- 1.2. Market Segmentation
- 1.3. Research Objective
- 1.4. Definitions and Assumptions
- 2. Executive Summary
- 2.1. Market Snapshot
- 3. Market Dynamics
- 3.1. Market Drivers
- 3.2. Market Restrains
- 3.3. Market Trends
- 3.4. Market Opportunities
- 4. Market Factor Analysis
- 4.1. Porters Five Forces
- 4.1.1. Bargaining Power of Suppliers
- 4.1.2. Bargaining Power of Buyers
- 4.1.3. Threat of New Entrants
- 4.1.4. Threat of Substitutes
- 4.1.5. Competitive Rivalry
- 4.2. PESTEL analysis
- 4.3. BCG Analysis
- 4.3.1. Stars (High Growth, High Market Share)
- 4.3.2. Cash Cows (Low Growth, High Market Share)
- 4.3.3. Question Mark (High Growth, Low Market Share)
- 4.3.4. Dogs (Low Growth, Low Market Share)
- 4.4. Ansoff Matrix Analysis
- 4.5. Supply Chain Analysis
- 4.6. Regulatory Landscape
- 4.7. Current Market Potential and Opportunity Assessment (TAM–SAM–SOM Framework)
- 4.8. TIR Analyst Note
- 4.1. Porters Five Forces
- 5. Market Analysis, Insights and Forecast 2021-2033
- 5.1. Market Analysis, Insights and Forecast - by Application
- 5.1.1. Insulation
- 5.1.2. Fire Protection
- 5.1.3. Paints & Coatings
- 5.1.4. Ceramics
- 5.1.5. Cement
- 5.1.6. Others
- 5.2. Market Analysis, Insights and Forecast - by Region
- 5.2.1. Asia Pacific
- 5.2.2. North America
- 5.2.3. Europe
- 5.2.4. South America
- 5.2.5. Middle East and Africa
- 5.1. Market Analysis, Insights and Forecast - by Application
- 6. Global Active Calcium Silicate Market Analysis, Insights and Forecast, 2021-2033
- 6.1. Market Analysis, Insights and Forecast - by Application
- 6.1.1. Insulation
- 6.1.2. Fire Protection
- 6.1.3. Paints & Coatings
- 6.1.4. Ceramics
- 6.1.5. Cement
- 6.1.6. Others
- 6.1. Market Analysis, Insights and Forecast - by Application
- 7. Asia Pacific Active Calcium Silicate Market Analysis, Insights and Forecast, 2020-2032
- 7.1. Market Analysis, Insights and Forecast - by Application
- 7.1.1. Insulation
- 7.1.2. Fire Protection
- 7.1.3. Paints & Coatings
- 7.1.4. Ceramics
- 7.1.5. Cement
- 7.1.6. Others
- 7.1. Market Analysis, Insights and Forecast - by Application
- 8. North America Active Calcium Silicate Market Analysis, Insights and Forecast, 2020-2032
- 8.1. Market Analysis, Insights and Forecast - by Application
- 8.1.1. Insulation
- 8.1.2. Fire Protection
- 8.1.3. Paints & Coatings
- 8.1.4. Ceramics
- 8.1.5. Cement
- 8.1.6. Others
- 8.1. Market Analysis, Insights and Forecast - by Application
- 9. Europe Active Calcium Silicate Market Analysis, Insights and Forecast, 2020-2032
- 9.1. Market Analysis, Insights and Forecast - by Application
- 9.1.1. Insulation
- 9.1.2. Fire Protection
- 9.1.3. Paints & Coatings
- 9.1.4. Ceramics
- 9.1.5. Cement
- 9.1.6. Others
- 9.1. Market Analysis, Insights and Forecast - by Application
- 10. South America Active Calcium Silicate Market Analysis, Insights and Forecast, 2020-2032
- 10.1. Market Analysis, Insights and Forecast - by Application
- 10.1.1. Insulation
- 10.1.2. Fire Protection
- 10.1.3. Paints & Coatings
- 10.1.4. Ceramics
- 10.1.5. Cement
- 10.1.6. Others
- 10.1. Market Analysis, Insights and Forecast - by Application
- 11. Middle East and Africa Active Calcium Silicate Market Analysis, Insights and Forecast, 2020-2032
- 11.1. Market Analysis, Insights and Forecast - by Application
- 11.1.1. Insulation
- 11.1.2. Fire Protection
- 11.1.3. Paints & Coatings
- 11.1.4. Ceramics
- 11.1.5. Cement
- 11.1.6. Others
- 11.1. Market Analysis, Insights and Forecast - by Application
- 12. Competitive Analysis
- 12.1. Company Profiles
- 12.1.1 Ramco Industries Limited
- 12.1.1.1. Company Overview
- 12.1.1.2. Products
- 12.1.1.3. Company Financials
- 12.1.1.4. SWOT Analysis
- 12.1.2 HIL Limited
- 12.1.2.1. Company Overview
- 12.1.2.2. Products
- 12.1.2.3. Company Financials
- 12.1.2.4. SWOT Analysis
- 12.1.3 American Elements
- 12.1.3.1. Company Overview
- 12.1.3.2. Products
- 12.1.3.3. Company Financials
- 12.1.3.4. SWOT Analysis
- 12.1.4 MLA Group of Industries
- 12.1.4.1. Company Overview
- 12.1.4.2. Products
- 12.1.4.3. Company Financials
- 12.1.4.4. SWOT Analysis
- 12.1.5 Promat International (Etex)
- 12.1.5.1. Company Overview
- 12.1.5.2. Products
- 12.1.5.3. Company Financials
- 12.1.5.4. SWOT Analysis
- 12.1.6 Sibelco
- 12.1.6.1. Company Overview
- 12.1.6.2. Products
- 12.1.6.3. Company Financials
- 12.1.6.4. SWOT Analysis
- 12.1.7 Skamol Group
- 12.1.7.1. Company Overview
- 12.1.7.2. Products
- 12.1.7.3. Company Financials
- 12.1.7.4. SWOT Analysis
- 12.1.8 Weifang Hongyuan Chemical Co Ltd
- 12.1.8.1. Company Overview
- 12.1.8.2. Products
- 12.1.8.3. Company Financials
- 12.1.8.4. SWOT Analysis
- 12.1.9 Johns Manville
- 12.1.9.1. Company Overview
- 12.1.9.2. Products
- 12.1.9.3. Company Financials
- 12.1.9.4. SWOT Analysis
- 12.1.10 Xella Group
- 12.1.10.1. Company Overview
- 12.1.10.2. Products
- 12.1.10.3. Company Financials
- 12.1.10.4. SWOT Analysis
- 12.1.1 Ramco Industries Limited
- 12.2. Market Entropy
- 12.2.1 Company's Key Areas Served
- 12.2.2 Recent Developments
- 12.3. Company Market Share Analysis 2025
- 12.3.1 Top 5 Companies Market Share Analysis
- 12.3.2 Top 3 Companies Market Share Analysis
- 12.4. List of Potential Customers
- 13. Research Methodology
List of Figures
- Figure 1: Global Active Calcium Silicate Market Revenue Breakdown (Million, %) by Region 2025 & 2033
- Figure 2: Global Active Calcium Silicate Market Volume Breakdown (K Tons, %) by Region 2025 & 2033
- Figure 3: Asia Pacific Active Calcium Silicate Market Revenue (Million), by Application 2025 & 2033
- Figure 4: Asia Pacific Active Calcium Silicate Market Volume (K Tons), by Application 2025 & 2033
- Figure 5: Asia Pacific Active Calcium Silicate Market Revenue Share (%), by Application 2025 & 2033
- Figure 6: Asia Pacific Active Calcium Silicate Market Volume Share (%), by Application 2025 & 2033
- Figure 7: Asia Pacific Active Calcium Silicate Market Revenue (Million), by Country 2025 & 2033
- Figure 8: Asia Pacific Active Calcium Silicate Market Volume (K Tons), by Country 2025 & 2033
- Figure 9: Asia Pacific Active Calcium Silicate Market Revenue Share (%), by Country 2025 & 2033
- Figure 10: Asia Pacific Active Calcium Silicate Market Volume Share (%), by Country 2025 & 2033
- Figure 11: North America Active Calcium Silicate Market Revenue (Million), by Application 2025 & 2033
- Figure 12: North America Active Calcium Silicate Market Volume (K Tons), by Application 2025 & 2033
- Figure 13: North America Active Calcium Silicate Market Revenue Share (%), by Application 2025 & 2033
- Figure 14: North America Active Calcium Silicate Market Volume Share (%), by Application 2025 & 2033
- Figure 15: North America Active Calcium Silicate Market Revenue (Million), by Country 2025 & 2033
- Figure 16: North America Active Calcium Silicate Market Volume (K Tons), by Country 2025 & 2033
- Figure 17: North America Active Calcium Silicate Market Revenue Share (%), by Country 2025 & 2033
- Figure 18: North America Active Calcium Silicate Market Volume Share (%), by Country 2025 & 2033
- Figure 19: Europe Active Calcium Silicate Market Revenue (Million), by Application 2025 & 2033
- Figure 20: Europe Active Calcium Silicate Market Volume (K Tons), by Application 2025 & 2033
- Figure 21: Europe Active Calcium Silicate Market Revenue Share (%), by Application 2025 & 2033
- Figure 22: Europe Active Calcium Silicate Market Volume Share (%), by Application 2025 & 2033
- Figure 23: Europe Active Calcium Silicate Market Revenue (Million), by Country 2025 & 2033
- Figure 24: Europe Active Calcium Silicate Market Volume (K Tons), by Country 2025 & 2033
- Figure 25: Europe Active Calcium Silicate Market Revenue Share (%), by Country 2025 & 2033
- Figure 26: Europe Active Calcium Silicate Market Volume Share (%), by Country 2025 & 2033
- Figure 27: South America Active Calcium Silicate Market Revenue (Million), by Application 2025 & 2033
- Figure 28: South America Active Calcium Silicate Market Volume (K Tons), by Application 2025 & 2033
- Figure 29: South America Active Calcium Silicate Market Revenue Share (%), by Application 2025 & 2033
- Figure 30: South America Active Calcium Silicate Market Volume Share (%), by Application 2025 & 2033
- Figure 31: South America Active Calcium Silicate Market Revenue (Million), by Country 2025 & 2033
- Figure 32: South America Active Calcium Silicate Market Volume (K Tons), by Country 2025 & 2033
- Figure 33: South America Active Calcium Silicate Market Revenue Share (%), by Country 2025 & 2033
- Figure 34: South America Active Calcium Silicate Market Volume Share (%), by Country 2025 & 2033
- Figure 35: Middle East and Africa Active Calcium Silicate Market Revenue (Million), by Application 2025 & 2033
- Figure 36: Middle East and Africa Active Calcium Silicate Market Volume (K Tons), by Application 2025 & 2033
- Figure 37: Middle East and Africa Active Calcium Silicate Market Revenue Share (%), by Application 2025 & 2033
- Figure 38: Middle East and Africa Active Calcium Silicate Market Volume Share (%), by Application 2025 & 2033
- Figure 39: Middle East and Africa Active Calcium Silicate Market Revenue (Million), by Country 2025 & 2033
- Figure 40: Middle East and Africa Active Calcium Silicate Market Volume (K Tons), by Country 2025 & 2033
- Figure 41: Middle East and Africa Active Calcium Silicate Market Revenue Share (%), by Country 2025 & 2033
- Figure 42: Middle East and Africa Active Calcium Silicate Market Volume Share (%), by Country 2025 & 2033
List of Tables
- Table 1: Global Active Calcium Silicate Market Revenue Million Forecast, by Application 2020 & 2033
- Table 2: Global Active Calcium Silicate Market Volume K Tons Forecast, by Application 2020 & 2033
- Table 3: Global Active Calcium Silicate Market Revenue Million Forecast, by Region 2020 & 2033
- Table 4: Global Active Calcium Silicate Market Volume K Tons Forecast, by Region 2020 & 2033
- Table 5: Global Active Calcium Silicate Market Revenue Million Forecast, by Application 2020 & 2033
- Table 6: Global Active Calcium Silicate Market Volume K Tons Forecast, by Application 2020 & 2033
- Table 7: Global Active Calcium Silicate Market Revenue Million Forecast, by Country 2020 & 2033
- Table 8: Global Active Calcium Silicate Market Volume K Tons Forecast, by Country 2020 & 2033
- Table 9: China Active Calcium Silicate Market Revenue (Million) Forecast, by Application 2020 & 2033
- Table 10: China Active Calcium Silicate Market Volume (K Tons) Forecast, by Application 2020 & 2033
- Table 11: India Active Calcium Silicate Market Revenue (Million) Forecast, by Application 2020 & 2033
- Table 12: India Active Calcium Silicate Market Volume (K Tons) Forecast, by Application 2020 & 2033
- Table 13: Japan Active Calcium Silicate Market Revenue (Million) Forecast, by Application 2020 & 2033
- Table 14: Japan Active Calcium Silicate Market Volume (K Tons) Forecast, by Application 2020 & 2033
- Table 15: South Korea Active Calcium Silicate Market Revenue (Million) Forecast, by Application 2020 & 2033
- Table 16: South Korea Active Calcium Silicate Market Volume (K Tons) Forecast, by Application 2020 & 2033
- Table 17: Rest of Asia Pacific Active Calcium Silicate Market Revenue (Million) Forecast, by Application 2020 & 2033
- Table 18: Rest of Asia Pacific Active Calcium Silicate Market Volume (K Tons) Forecast, by Application 2020 & 2033
- Table 19: Global Active Calcium Silicate Market Revenue Million Forecast, by Application 2020 & 2033
- Table 20: Global Active Calcium Silicate Market Volume K Tons Forecast, by Application 2020 & 2033
- Table 21: Global Active Calcium Silicate Market Revenue Million Forecast, by Country 2020 & 2033
- Table 22: Global Active Calcium Silicate Market Volume K Tons Forecast, by Country 2020 & 2033
- Table 23: United States Active Calcium Silicate Market Revenue (Million) Forecast, by Application 2020 & 2033
- Table 24: United States Active Calcium Silicate Market Volume (K Tons) Forecast, by Application 2020 & 2033
- Table 25: Canada Active Calcium Silicate Market Revenue (Million) Forecast, by Application 2020 & 2033
- Table 26: Canada Active Calcium Silicate Market Volume (K Tons) Forecast, by Application 2020 & 2033
- Table 27: Mexico Active Calcium Silicate Market Revenue (Million) Forecast, by Application 2020 & 2033
- Table 28: Mexico Active Calcium Silicate Market Volume (K Tons) Forecast, by Application 2020 & 2033
- Table 29: Global Active Calcium Silicate Market Revenue Million Forecast, by Application 2020 & 2033
- Table 30: Global Active Calcium Silicate Market Volume K Tons Forecast, by Application 2020 & 2033
- Table 31: Global Active Calcium Silicate Market Revenue Million Forecast, by Country 2020 & 2033
- Table 32: Global Active Calcium Silicate Market Volume K Tons Forecast, by Country 2020 & 2033
- Table 33: Germany Active Calcium Silicate Market Revenue (Million) Forecast, by Application 2020 & 2033
- Table 34: Germany Active Calcium Silicate Market Volume (K Tons) Forecast, by Application 2020 & 2033
- Table 35: United Kingdom Active Calcium Silicate Market Revenue (Million) Forecast, by Application 2020 & 2033
- Table 36: United Kingdom Active Calcium Silicate Market Volume (K Tons) Forecast, by Application 2020 & 2033
- Table 37: France Active Calcium Silicate Market Revenue (Million) Forecast, by Application 2020 & 2033
- Table 38: France Active Calcium Silicate Market Volume (K Tons) Forecast, by Application 2020 & 2033
- Table 39: Italy Active Calcium Silicate Market Revenue (Million) Forecast, by Application 2020 & 2033
- Table 40: Italy Active Calcium Silicate Market Volume (K Tons) Forecast, by Application 2020 & 2033
- Table 41: Rest of Europe Active Calcium Silicate Market Revenue (Million) Forecast, by Application 2020 & 2033
- Table 42: Rest of Europe Active Calcium Silicate Market Volume (K Tons) Forecast, by Application 2020 & 2033
- Table 43: Global Active Calcium Silicate Market Revenue Million Forecast, by Application 2020 & 2033
- Table 44: Global Active Calcium Silicate Market Volume K Tons Forecast, by Application 2020 & 2033
- Table 45: Global Active Calcium Silicate Market Revenue Million Forecast, by Country 2020 & 2033
- Table 46: Global Active Calcium Silicate Market Volume K Tons Forecast, by Country 2020 & 2033
- Table 47: Brazil Active Calcium Silicate Market Revenue (Million) Forecast, by Application 2020 & 2033
- Table 48: Brazil Active Calcium Silicate Market Volume (K Tons) Forecast, by Application 2020 & 2033
- Table 49: Argentina Active Calcium Silicate Market Revenue (Million) Forecast, by Application 2020 & 2033
- Table 50: Argentina Active Calcium Silicate Market Volume (K Tons) Forecast, by Application 2020 & 2033
- Table 51: Rest of South America Active Calcium Silicate Market Revenue (Million) Forecast, by Application 2020 & 2033
- Table 52: Rest of South America Active Calcium Silicate Market Volume (K Tons) Forecast, by Application 2020 & 2033
- Table 53: Global Active Calcium Silicate Market Revenue Million Forecast, by Application 2020 & 2033
- Table 54: Global Active Calcium Silicate Market Volume K Tons Forecast, by Application 2020 & 2033
- Table 55: Global Active Calcium Silicate Market Revenue Million Forecast, by Country 2020 & 2033
- Table 56: Global Active Calcium Silicate Market Volume K Tons Forecast, by Country 2020 & 2033
- Table 57: Saudi Arabia Active Calcium Silicate Market Revenue (Million) Forecast, by Application 2020 & 2033
- Table 58: Saudi Arabia Active Calcium Silicate Market Volume (K Tons) Forecast, by Application 2020 & 2033
- Table 59: South Africa Active Calcium Silicate Market Revenue (Million) Forecast, by Application 2020 & 2033
- Table 60: South Africa Active Calcium Silicate Market Volume (K Tons) Forecast, by Application 2020 & 2033
- Table 61: Rest of Middle East and Africa Active Calcium Silicate Market Revenue (Million) Forecast, by Application 2020 & 2033
- Table 62: Rest of Middle East and Africa Active Calcium Silicate Market Volume (K Tons) Forecast, by Application 2020 & 2033
Frequently Asked Questions
1. What is the projected Compound Annual Growth Rate (CAGR) of the Active Calcium Silicate Market?
The projected CAGR is approximately 5.45%.
2. Which companies are prominent players in the Active Calcium Silicate Market?
Key companies in the market include Ramco Industries Limited, HIL Limited, American Elements, MLA Group of Industries, Promat International (Etex), Sibelco, Skamol Group, Weifang Hongyuan Chemical Co Ltd, Johns Manville, Xella Group.
3. What are the main segments of the Active Calcium Silicate Market?
The market segments include Application.
4. Can you provide details about the market size?
The market size is estimated to be USD 222.25 Million as of 2022.
5. What are some drivers contributing to market growth?
Growing Demand from the Construction Industry in Asia-Pacific; Increasing Usage in the Ceramic Industry; Other Drivers.
6. What are the notable trends driving market growth?
Growing Demand from Insulation and Fire Protection Segment.
7. Are there any restraints impacting market growth?
Stringent Regulations Pertaining to Permissible Exposure Limit of the Product; Other Restraints.
8. Can you provide examples of recent developments in the market?
N/A
9. What pricing options are available for accessing the report?
Pricing options include single-user, multi-user, and enterprise licenses priced at USD 4750, USD 5250, and USD 8750 respectively.
10. Is the market size provided in terms of value or volume?
The market size is provided in terms of value, measured in Million and volume, measured in K Tons.
11. Are there any specific market keywords associated with the report?
Yes, the market keyword associated with the report is "Active Calcium Silicate Market," which aids in identifying and referencing the specific market segment covered.
12. How do I determine which pricing option suits my needs best?
The pricing options vary based on user requirements and access needs. Individual users may opt for single-user licenses, while businesses requiring broader access may choose multi-user or enterprise licenses for cost-effective access to the report.
13. Are there any additional resources or data provided in the Active Calcium Silicate Market report?
While the report offers comprehensive insights, it's advisable to review the specific contents or supplementary materials provided to ascertain if additional resources or data are available.
14. How can I stay updated on further developments or reports in the Active Calcium Silicate Market?
To stay informed about further developments, trends, and reports in the Active Calcium Silicate Market, consider subscribing to industry newsletters, following relevant companies and organizations, or regularly checking reputable industry news sources and publications.
Methodology
Step 1 - Identification of Relevant Samples Size from Population Database


Step 2 - Approaches for Defining Global Market Size (Value, Volume* & Price*)

Note*: In applicable scenarios
Step 3 - Data Sources
Primary Research
- Web Analytics
- Survey Reports
- Research Institute
- Latest Research Reports
- Opinion Leaders
Secondary Research
- Annual Reports
- White Paper
- Latest Press Release
- Industry Association
- Paid Database
- Investor Presentations

Step 4 - Data Triangulation
Involves using different sources of information in order to increase the validity of a study
These sources are likely to be stakeholders in a program - participants, other researchers, program staff, other community members, and so on.
Then we put all data in single framework & apply various statistical tools to find out the dynamic on the market.
During the analysis stage, feedback from the stakeholder groups would be compared to determine areas of agreement as well as areas of divergence