

Key Insights
The advanced ceramics market is experiencing robust growth, projected to maintain a Compound Annual Growth Rate (CAGR) exceeding 6% from 2025 to 2033. This expansion is driven by increasing demand across diverse sectors, including automotive, aerospace, electronics, and energy. Technological advancements leading to the development of high-performance ceramics with enhanced properties like strength, durability, and thermal resistance are key catalysts. The automotive industry's push towards lightweighting and fuel efficiency is a significant driver, with advanced ceramics finding applications in engine components, catalytic converters, and sensors. Similarly, the burgeoning electronics sector necessitates high-precision ceramics for components in smartphones, computers, and other electronic devices. The energy sector's focus on renewable energy sources and improved energy efficiency also contributes to market growth, with applications in fuel cells and solar energy systems.
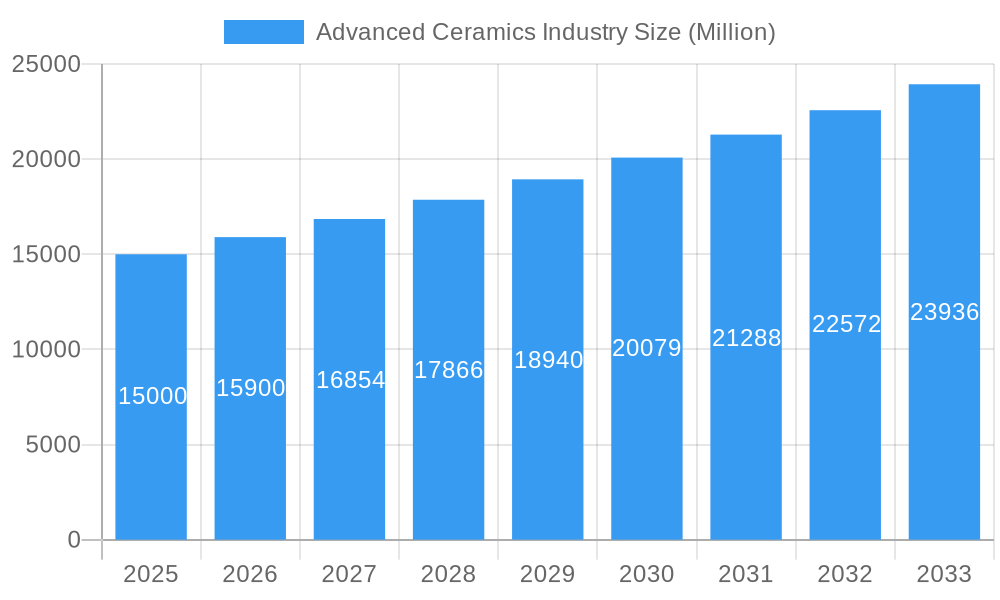
Advanced Ceramics Industry Market Size (In Billion)
Market segmentation reveals a complex landscape with various specialized ceramic types contributing to overall growth. While specific segment data is unavailable, a reasonable estimation suggests that high-performance technical ceramics (used in demanding applications) and structural ceramics (used in building and construction) likely constitute substantial portions of the market. Leading companies like 3M, AGC Inc, and Kyocera Corporation are heavily invested in research and development, further fueling innovation and market expansion. However, challenges remain, including the relatively high cost of advanced ceramic manufacturing and the potential for material limitations in specific applications. Despite these restraints, the overall outlook for the advanced ceramics industry remains positive, driven by continuous technological advancements and increasing demand from key end-use sectors. Strategic partnerships and acquisitions within the industry are also expected to shape future market dynamics.
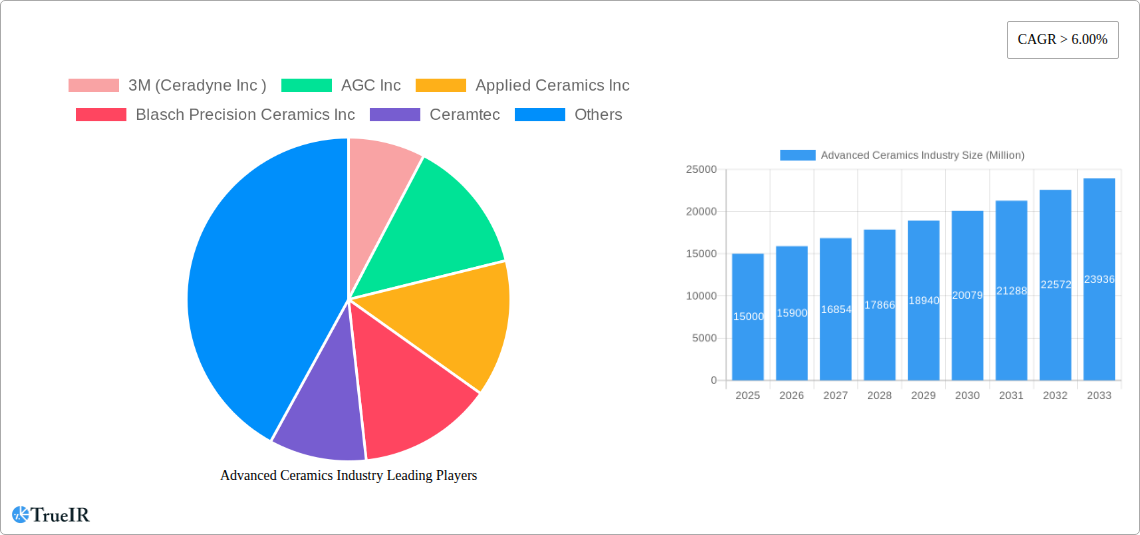
Advanced Ceramics Industry Company Market Share
Advanced Ceramics Industry Market Report: 2019-2033
This comprehensive report provides a detailed analysis of the Advanced Ceramics Industry, offering invaluable insights for stakeholders seeking to navigate this dynamic market. With a study period spanning 2019-2033, a base year of 2025, and a forecast period of 2025-2033, this report leverages historical data (2019-2024) and future projections to deliver a holistic understanding of market trends, opportunities, and challenges. The global market size is projected to reach xx Million by 2033, exhibiting a CAGR of xx% during the forecast period.
Advanced Ceramics Industry Market Structure & Competitive Landscape
The advanced ceramics market is characterized by a moderately concentrated structure, with several key players holding significant market share. While a precise concentration ratio is difficult to definitively state without internal data from all players, a conservative estimate places the top 5 players controlling approximately 35% of the global market. This concentration is influenced by high barriers to entry, including significant R&D investments and specialized manufacturing expertise.
Innovation Drivers: Continuous advancements in material science, nanotechnology, and additive manufacturing are driving innovation, enabling the development of high-performance ceramics with enhanced properties. Government funding for R&D initiatives further accelerates innovation across various applications.
Regulatory Impacts: Stringent environmental regulations and safety standards influence product development and manufacturing processes. Compliance costs and the need for sustainable materials are significant factors.
Product Substitutes: Competition arises from alternative materials like advanced polymers and composites, particularly in specific applications where cost-effectiveness is a crucial factor.
End-User Segmentation: Key end-use sectors include automotive, electronics, aerospace, energy, and healthcare. Automotive and electronics segments currently dominate, driving substantial demand.
M&A Trends: The industry witnesses periodic mergers and acquisitions, aiming to enhance market share, expand product portfolios, and access new technologies. While precise M&A volume data for the entire study period is proprietary, the historical period saw approximately xx Million in deals, highlighting consolidation trends.
Advanced Ceramics Industry Market Trends & Opportunities
The advanced ceramics market is witnessing robust growth, fueled by increasing demand across diverse sectors. Technological advancements, such as 3D printing and nano-engineered materials, are expanding application possibilities and improving product performance. Consumer preferences are shifting towards lightweight, high-strength, and energy-efficient materials, creating opportunities for advanced ceramics in sectors such as automotive and aerospace.
The market is projected to grow significantly during the forecast period, driven by the rising adoption of advanced ceramics in high-growth industries like electric vehicles, renewable energy, and 5G infrastructure. The growing need for efficient and sustainable solutions further boosts market demand. Specific market penetration rates for individual sectors vary, with penetration in electronics exceeding xx% currently and projected to reach xx% by 2033.
Dominant Markets & Segments in Advanced Ceramics Industry
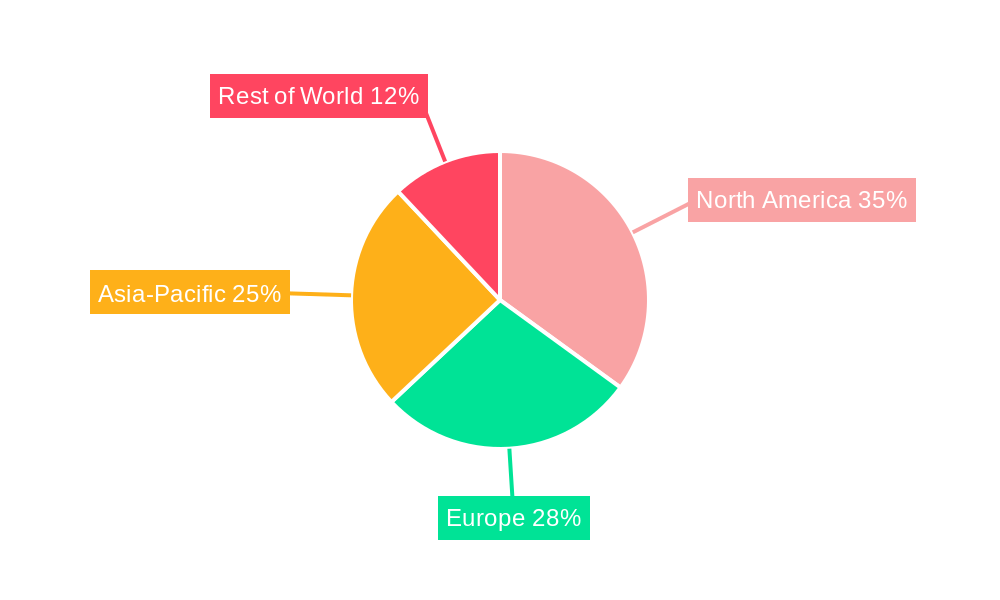
Dominant Regions/Countries: The North American and Asia-Pacific regions currently represent the largest markets for advanced ceramics, driven by substantial investments in infrastructure, technological advancements, and strong manufacturing bases. Specifically, China and the United States hold commanding market shares. Europe follows closely as a major market.
Key Growth Drivers (Bullet Points):
- Automotive Industry: Increased adoption of advanced ceramics in high-performance vehicles and electric vehicle components.
- Electronics: Growing demand for high-frequency and high-power electronics applications in mobile devices and communication systems.
- Aerospace: Lightweight and high-temperature resistant ceramics for aerospace applications.
- Government funding & incentives: Government initiatives and funding programs aimed at promoting technological advancements in advanced ceramic materials.
- Infrastructure Development: Demand for high-performance ceramics in infrastructure projects like construction and energy.
Market Dominance Analysis: The dominance of North America and Asia-Pacific regions is primarily attributed to the presence of major industry players, robust technological capabilities, and significant investments in research and development. However, the Asia-Pacific region is poised for accelerated growth, surpassing North America in market share during the forecast period, propelled by increasing industrialization and economic development.
Advanced Ceramics Industry Product Analysis
Advanced ceramics encompass a wide range of products, including alumina, zirconia, silicon carbide, and silicon nitride, each exhibiting unique properties tailored to specific applications. Recent technological advancements focus on developing high-performance materials with enhanced strength, thermal stability, and durability. These improvements are crucial for expanding the application scope of advanced ceramics in demanding environments, notably in the aerospace and automotive industries.
Key Drivers, Barriers & Challenges in Advanced Ceramics Industry
Key Drivers:
Technological advancements are a primary driver, with innovations in materials science and manufacturing techniques leading to enhanced performance and cost-effectiveness. The rising demand for high-performance materials across diverse sectors, especially in automotive and electronics, fuels market growth. Furthermore, favorable government policies and supportive regulatory frameworks in certain regions incentivize adoption.
Key Challenges & Restraints:
High manufacturing costs and complex processing techniques remain significant barriers to entry. Supply chain disruptions can impact material availability and pricing, particularly for specialized raw materials. Intense competition and the threat of substitutes from alternative materials create additional pressure. Regulatory hurdles and compliance requirements necessitate substantial investments. The estimated impact of these challenges on market growth varies by region and sector; conservatively, it is estimated to slow growth by an average of 2% annually.
Growth Drivers in the Advanced Ceramics Industry Market
Several factors propel the growth of the advanced ceramics market. Technological innovation, particularly in areas like additive manufacturing and nanotechnology, unlocks new material properties and applications. The increasing demand from high-growth sectors like electric vehicles, renewable energy, and 5G communications fuels market expansion. Government policies promoting technological advancements and investments in infrastructure also contribute to growth.
Challenges Impacting Advanced Ceramics Industry Growth
Despite the strong growth potential, several factors pose challenges. High production costs and specialized manufacturing requirements create barriers to entry for new players. Supply chain vulnerabilities, coupled with the volatility of raw material prices, can negatively impact the industry. Stiff competition from alternative materials and the need to meet stringent environmental regulations present additional hurdles.
Key Players Shaping the Advanced Ceramics Industry Market
- 3M (Ceradyne Inc) [3M]
- AGC Inc [AGC Inc]
- Applied Ceramics Inc
- Blasch Precision Ceramics Inc
- Ceramtec [Ceramtec]
- COI Ceramics Inc
- Coorstek Inc [Coorstek]
- Corning Incorporated [Corning]
- International Ceramics Inc
- Kyocera Corporation [Kyocera]
- MARUWA Co Ltd
- Materion Corporation [Materion]
- McDanel Advanced Ceramic Technologies
- Morgan Advanced Materials [Morgan Advanced Materials]
- Murata Manufacturing Co Ltd [Murata]
- Rauschert GmbH [Rauschert]
- Saint-Gobain [Saint-Gobain]
- Small Precision Tools Inc
- Vesuvius [Vesuvius]
- Wonik QnC Corporation
Significant Advanced Ceramics Industry Industry Milestones
- April 2021: CeramTec developed a ceramic power module for e-mobility drive inverters, launched in May 2021. This signifies a significant advancement in power electronics for electric vehicles.
- February 2021: Coorstek commenced construction of a new 400,000 sq. ft. engineered ceramics manufacturing facility in Rayong, Thailand. This expansion highlights the growing demand and investment in the advanced ceramics sector in Asia.
Future Outlook for Advanced Ceramics Industry Market
The advanced ceramics market is poised for continued growth, driven by technological advancements, expanding applications across various sectors, and supportive government policies. Strategic opportunities exist for companies to innovate in material science, improve manufacturing processes, and expand into emerging markets. The market's future hinges on addressing challenges related to cost reduction, supply chain resilience, and environmental sustainability. The projected market size offers significant potential for industry players.
Advanced Ceramics Industry Segmentation
-
1. Material Type
- 1.1. Alumina
- 1.2. Titanate
- 1.3. Zirconia
- 1.4. Silicon Carbide
- 1.5. Aluminum Nitride
- 1.6. Silicon Nitride
- 1.7. Magnesium Silicate
- 1.8. Pyrolytic Boron Nitride
- 1.9. Other Material Types
-
2. Class Type
- 2.1. Monolithic Ceramics
- 2.2. Ceramic Matrix Composites
- 2.3. Ceramic Coatings
-
3. End-user Industry
- 3.1. Electrical and Electronics
- 3.2. Transportation
- 3.3. Medical
- 3.4. Industrial
- 3.5. Defense and Security
- 3.6. Chemical
- 3.7. Other End-user Industries
Advanced Ceramics Industry Segmentation By Geography
-
1. Asia Pacific
- 1.1. China
- 1.2. India
- 1.3. Japan
- 1.4. South Korea
- 1.5. Rest of Asia Pacific
-
2. North America
- 2.1. United States
- 2.2. Canada
- 2.3. Mexico
-
3. Europe
- 3.1. Germany
- 3.2. United Kingdom
- 3.3. Italy
- 3.4. France
- 3.5. Rest of Europe
-
4. South America
- 4.1. Brazil
- 4.2. Argentina
- 4.3. Rest of South America
-
5. Middle East and Africa
- 5.1. Saudi Arabia
- 5.2. South Africa
- 5.3. Rest of Middle East and Africa
Advanced Ceramics Industry Regional Market Share
Geographic Coverage of Advanced Ceramics Industry
Advanced Ceramics Industry REPORT HIGHLIGHTS
| Aspects | Details |
|---|---|
| Study Period | 2020-2034 |
| Base Year | 2025 |
| Estimated Year | 2026 |
| Forecast Period | 2026-2034 |
| Historical Period | 2020-2025 |
| Growth Rate | CAGR of > 6.00% from 2020-2034 |
| Segmentation |
|
Table of Contents
- 1. Introduction
- 1.1. Research Scope
- 1.2. Market Segmentation
- 1.3. Research Objective
- 1.4. Definitions and Assumptions
- 2. Executive Summary
- 2.1. Market Snapshot
- 3. Market Dynamics
- 3.1. Market Drivers
- 3.2. Market Restrains
- 3.3. Market Trends
- 3.4. Market Opportunities
- 4. Market Factor Analysis
- 4.1. Porters Five Forces
- 4.1.1. Bargaining Power of Suppliers
- 4.1.2. Bargaining Power of Buyers
- 4.1.3. Threat of New Entrants
- 4.1.4. Threat of Substitutes
- 4.1.5. Competitive Rivalry
- 4.2. PESTEL analysis
- 4.3. BCG Analysis
- 4.3.1. Stars (High Growth, High Market Share)
- 4.3.2. Cash Cows (Low Growth, High Market Share)
- 4.3.3. Question Mark (High Growth, Low Market Share)
- 4.3.4. Dogs (Low Growth, Low Market Share)
- 4.4. Ansoff Matrix Analysis
- 4.5. Supply Chain Analysis
- 4.6. Regulatory Landscape
- 4.7. Current Market Potential and Opportunity Assessment (TAM–SAM–SOM Framework)
- 4.8. TIR Analyst Note
- 4.1. Porters Five Forces
- 5. Market Analysis, Insights and Forecast 2021-2033
- 5.1. Market Analysis, Insights and Forecast - by Material Type
- 5.1.1. Alumina
- 5.1.2. Titanate
- 5.1.3. Zirconia
- 5.1.4. Silicon Carbide
- 5.1.5. Aluminum Nitride
- 5.1.6. Silicon Nitride
- 5.1.7. Magnesium Silicate
- 5.1.8. Pyrolytic Boron Nitride
- 5.1.9. Other Material Types
- 5.2. Market Analysis, Insights and Forecast - by Class Type
- 5.2.1. Monolithic Ceramics
- 5.2.2. Ceramic Matrix Composites
- 5.2.3. Ceramic Coatings
- 5.3. Market Analysis, Insights and Forecast - by End-user Industry
- 5.3.1. Electrical and Electronics
- 5.3.2. Transportation
- 5.3.3. Medical
- 5.3.4. Industrial
- 5.3.5. Defense and Security
- 5.3.6. Chemical
- 5.3.7. Other End-user Industries
- 5.4. Market Analysis, Insights and Forecast - by Region
- 5.4.1. Asia Pacific
- 5.4.2. North America
- 5.4.3. Europe
- 5.4.4. South America
- 5.4.5. Middle East and Africa
- 5.1. Market Analysis, Insights and Forecast - by Material Type
- 6. Global Advanced Ceramics Industry Analysis, Insights and Forecast, 2021-2033
- 6.1. Market Analysis, Insights and Forecast - by Material Type
- 6.1.1. Alumina
- 6.1.2. Titanate
- 6.1.3. Zirconia
- 6.1.4. Silicon Carbide
- 6.1.5. Aluminum Nitride
- 6.1.6. Silicon Nitride
- 6.1.7. Magnesium Silicate
- 6.1.8. Pyrolytic Boron Nitride
- 6.1.9. Other Material Types
- 6.2. Market Analysis, Insights and Forecast - by Class Type
- 6.2.1. Monolithic Ceramics
- 6.2.2. Ceramic Matrix Composites
- 6.2.3. Ceramic Coatings
- 6.3. Market Analysis, Insights and Forecast - by End-user Industry
- 6.3.1. Electrical and Electronics
- 6.3.2. Transportation
- 6.3.3. Medical
- 6.3.4. Industrial
- 6.3.5. Defense and Security
- 6.3.6. Chemical
- 6.3.7. Other End-user Industries
- 6.1. Market Analysis, Insights and Forecast - by Material Type
- 7. Asia Pacific Advanced Ceramics Industry Analysis, Insights and Forecast, 2020-2032
- 7.1. Market Analysis, Insights and Forecast - by Material Type
- 7.1.1. Alumina
- 7.1.2. Titanate
- 7.1.3. Zirconia
- 7.1.4. Silicon Carbide
- 7.1.5. Aluminum Nitride
- 7.1.6. Silicon Nitride
- 7.1.7. Magnesium Silicate
- 7.1.8. Pyrolytic Boron Nitride
- 7.1.9. Other Material Types
- 7.2. Market Analysis, Insights and Forecast - by Class Type
- 7.2.1. Monolithic Ceramics
- 7.2.2. Ceramic Matrix Composites
- 7.2.3. Ceramic Coatings
- 7.3. Market Analysis, Insights and Forecast - by End-user Industry
- 7.3.1. Electrical and Electronics
- 7.3.2. Transportation
- 7.3.3. Medical
- 7.3.4. Industrial
- 7.3.5. Defense and Security
- 7.3.6. Chemical
- 7.3.7. Other End-user Industries
- 7.1. Market Analysis, Insights and Forecast - by Material Type
- 8. North America Advanced Ceramics Industry Analysis, Insights and Forecast, 2020-2032
- 8.1. Market Analysis, Insights and Forecast - by Material Type
- 8.1.1. Alumina
- 8.1.2. Titanate
- 8.1.3. Zirconia
- 8.1.4. Silicon Carbide
- 8.1.5. Aluminum Nitride
- 8.1.6. Silicon Nitride
- 8.1.7. Magnesium Silicate
- 8.1.8. Pyrolytic Boron Nitride
- 8.1.9. Other Material Types
- 8.2. Market Analysis, Insights and Forecast - by Class Type
- 8.2.1. Monolithic Ceramics
- 8.2.2. Ceramic Matrix Composites
- 8.2.3. Ceramic Coatings
- 8.3. Market Analysis, Insights and Forecast - by End-user Industry
- 8.3.1. Electrical and Electronics
- 8.3.2. Transportation
- 8.3.3. Medical
- 8.3.4. Industrial
- 8.3.5. Defense and Security
- 8.3.6. Chemical
- 8.3.7. Other End-user Industries
- 8.1. Market Analysis, Insights and Forecast - by Material Type
- 9. Europe Advanced Ceramics Industry Analysis, Insights and Forecast, 2020-2032
- 9.1. Market Analysis, Insights and Forecast - by Material Type
- 9.1.1. Alumina
- 9.1.2. Titanate
- 9.1.3. Zirconia
- 9.1.4. Silicon Carbide
- 9.1.5. Aluminum Nitride
- 9.1.6. Silicon Nitride
- 9.1.7. Magnesium Silicate
- 9.1.8. Pyrolytic Boron Nitride
- 9.1.9. Other Material Types
- 9.2. Market Analysis, Insights and Forecast - by Class Type
- 9.2.1. Monolithic Ceramics
- 9.2.2. Ceramic Matrix Composites
- 9.2.3. Ceramic Coatings
- 9.3. Market Analysis, Insights and Forecast - by End-user Industry
- 9.3.1. Electrical and Electronics
- 9.3.2. Transportation
- 9.3.3. Medical
- 9.3.4. Industrial
- 9.3.5. Defense and Security
- 9.3.6. Chemical
- 9.3.7. Other End-user Industries
- 9.1. Market Analysis, Insights and Forecast - by Material Type
- 10. South America Advanced Ceramics Industry Analysis, Insights and Forecast, 2020-2032
- 10.1. Market Analysis, Insights and Forecast - by Material Type
- 10.1.1. Alumina
- 10.1.2. Titanate
- 10.1.3. Zirconia
- 10.1.4. Silicon Carbide
- 10.1.5. Aluminum Nitride
- 10.1.6. Silicon Nitride
- 10.1.7. Magnesium Silicate
- 10.1.8. Pyrolytic Boron Nitride
- 10.1.9. Other Material Types
- 10.2. Market Analysis, Insights and Forecast - by Class Type
- 10.2.1. Monolithic Ceramics
- 10.2.2. Ceramic Matrix Composites
- 10.2.3. Ceramic Coatings
- 10.3. Market Analysis, Insights and Forecast - by End-user Industry
- 10.3.1. Electrical and Electronics
- 10.3.2. Transportation
- 10.3.3. Medical
- 10.3.4. Industrial
- 10.3.5. Defense and Security
- 10.3.6. Chemical
- 10.3.7. Other End-user Industries
- 10.1. Market Analysis, Insights and Forecast - by Material Type
- 11. Middle East and Africa Advanced Ceramics Industry Analysis, Insights and Forecast, 2020-2032
- 11.1. Market Analysis, Insights and Forecast - by Material Type
- 11.1.1. Alumina
- 11.1.2. Titanate
- 11.1.3. Zirconia
- 11.1.4. Silicon Carbide
- 11.1.5. Aluminum Nitride
- 11.1.6. Silicon Nitride
- 11.1.7. Magnesium Silicate
- 11.1.8. Pyrolytic Boron Nitride
- 11.1.9. Other Material Types
- 11.2. Market Analysis, Insights and Forecast - by Class Type
- 11.2.1. Monolithic Ceramics
- 11.2.2. Ceramic Matrix Composites
- 11.2.3. Ceramic Coatings
- 11.3. Market Analysis, Insights and Forecast - by End-user Industry
- 11.3.1. Electrical and Electronics
- 11.3.2. Transportation
- 11.3.3. Medical
- 11.3.4. Industrial
- 11.3.5. Defense and Security
- 11.3.6. Chemical
- 11.3.7. Other End-user Industries
- 11.1. Market Analysis, Insights and Forecast - by Material Type
- 12. Competitive Analysis
- 12.1. Company Profiles
- 12.1.1 3M (Ceradyne Inc )
- 12.1.1.1. Company Overview
- 12.1.1.2. Products
- 12.1.1.3. Company Financials
- 12.1.1.4. SWOT Analysis
- 12.1.2 AGC Inc
- 12.1.2.1. Company Overview
- 12.1.2.2. Products
- 12.1.2.3. Company Financials
- 12.1.2.4. SWOT Analysis
- 12.1.3 Applied Ceramics Inc
- 12.1.3.1. Company Overview
- 12.1.3.2. Products
- 12.1.3.3. Company Financials
- 12.1.3.4. SWOT Analysis
- 12.1.4 Blasch Precision Ceramics Inc
- 12.1.4.1. Company Overview
- 12.1.4.2. Products
- 12.1.4.3. Company Financials
- 12.1.4.4. SWOT Analysis
- 12.1.5 Ceramtec
- 12.1.5.1. Company Overview
- 12.1.5.2. Products
- 12.1.5.3. Company Financials
- 12.1.5.4. SWOT Analysis
- 12.1.6 COI Ceramics Inc
- 12.1.6.1. Company Overview
- 12.1.6.2. Products
- 12.1.6.3. Company Financials
- 12.1.6.4. SWOT Analysis
- 12.1.7 Coorstek Inc
- 12.1.7.1. Company Overview
- 12.1.7.2. Products
- 12.1.7.3. Company Financials
- 12.1.7.4. SWOT Analysis
- 12.1.8 Corning Incorporated
- 12.1.8.1. Company Overview
- 12.1.8.2. Products
- 12.1.8.3. Company Financials
- 12.1.8.4. SWOT Analysis
- 12.1.9 International Ceramics Inc
- 12.1.9.1. Company Overview
- 12.1.9.2. Products
- 12.1.9.3. Company Financials
- 12.1.9.4. SWOT Analysis
- 12.1.10 Kyocera Corporation
- 12.1.10.1. Company Overview
- 12.1.10.2. Products
- 12.1.10.3. Company Financials
- 12.1.10.4. SWOT Analysis
- 12.1.11 MARUWA Co Ltd
- 12.1.11.1. Company Overview
- 12.1.11.2. Products
- 12.1.11.3. Company Financials
- 12.1.11.4. SWOT Analysis
- 12.1.12 Materion Corporation
- 12.1.12.1. Company Overview
- 12.1.12.2. Products
- 12.1.12.3. Company Financials
- 12.1.12.4. SWOT Analysis
- 12.1.13 McDanel Advanced Ceramic Technologies
- 12.1.13.1. Company Overview
- 12.1.13.2. Products
- 12.1.13.3. Company Financials
- 12.1.13.4. SWOT Analysis
- 12.1.14 Morgan Advanced Materials
- 12.1.14.1. Company Overview
- 12.1.14.2. Products
- 12.1.14.3. Company Financials
- 12.1.14.4. SWOT Analysis
- 12.1.15 Murata Manufacturing Co Ltd
- 12.1.15.1. Company Overview
- 12.1.15.2. Products
- 12.1.15.3. Company Financials
- 12.1.15.4. SWOT Analysis
- 12.1.16 Rauschert GmbH
- 12.1.16.1. Company Overview
- 12.1.16.2. Products
- 12.1.16.3. Company Financials
- 12.1.16.4. SWOT Analysis
- 12.1.17 Saint-Gobain
- 12.1.17.1. Company Overview
- 12.1.17.2. Products
- 12.1.17.3. Company Financials
- 12.1.17.4. SWOT Analysis
- 12.1.18 Small Precision Tools Inc
- 12.1.18.1. Company Overview
- 12.1.18.2. Products
- 12.1.18.3. Company Financials
- 12.1.18.4. SWOT Analysis
- 12.1.19 Vesuvius
- 12.1.19.1. Company Overview
- 12.1.19.2. Products
- 12.1.19.3. Company Financials
- 12.1.19.4. SWOT Analysis
- 12.1.20 Wonik QnC Corporation*List Not Exhaustive
- 12.1.20.1. Company Overview
- 12.1.20.2. Products
- 12.1.20.3. Company Financials
- 12.1.20.4. SWOT Analysis
- 12.1.1 3M (Ceradyne Inc )
- 12.2. Market Entropy
- 12.2.1 Company's Key Areas Served
- 12.2.2 Recent Developments
- 12.3. Company Market Share Analysis 2025
- 12.3.1 Top 5 Companies Market Share Analysis
- 12.3.2 Top 3 Companies Market Share Analysis
- 12.4. List of Potential Customers
- 13. Research Methodology
List of Figures
- Figure 1: Global Advanced Ceramics Industry Revenue Breakdown (Million, %) by Region 2025 & 2033
- Figure 2: Asia Pacific Advanced Ceramics Industry Revenue (Million), by Material Type 2025 & 2033
- Figure 3: Asia Pacific Advanced Ceramics Industry Revenue Share (%), by Material Type 2025 & 2033
- Figure 4: Asia Pacific Advanced Ceramics Industry Revenue (Million), by Class Type 2025 & 2033
- Figure 5: Asia Pacific Advanced Ceramics Industry Revenue Share (%), by Class Type 2025 & 2033
- Figure 6: Asia Pacific Advanced Ceramics Industry Revenue (Million), by End-user Industry 2025 & 2033
- Figure 7: Asia Pacific Advanced Ceramics Industry Revenue Share (%), by End-user Industry 2025 & 2033
- Figure 8: Asia Pacific Advanced Ceramics Industry Revenue (Million), by Country 2025 & 2033
- Figure 9: Asia Pacific Advanced Ceramics Industry Revenue Share (%), by Country 2025 & 2033
- Figure 10: North America Advanced Ceramics Industry Revenue (Million), by Material Type 2025 & 2033
- Figure 11: North America Advanced Ceramics Industry Revenue Share (%), by Material Type 2025 & 2033
- Figure 12: North America Advanced Ceramics Industry Revenue (Million), by Class Type 2025 & 2033
- Figure 13: North America Advanced Ceramics Industry Revenue Share (%), by Class Type 2025 & 2033
- Figure 14: North America Advanced Ceramics Industry Revenue (Million), by End-user Industry 2025 & 2033
- Figure 15: North America Advanced Ceramics Industry Revenue Share (%), by End-user Industry 2025 & 2033
- Figure 16: North America Advanced Ceramics Industry Revenue (Million), by Country 2025 & 2033
- Figure 17: North America Advanced Ceramics Industry Revenue Share (%), by Country 2025 & 2033
- Figure 18: Europe Advanced Ceramics Industry Revenue (Million), by Material Type 2025 & 2033
- Figure 19: Europe Advanced Ceramics Industry Revenue Share (%), by Material Type 2025 & 2033
- Figure 20: Europe Advanced Ceramics Industry Revenue (Million), by Class Type 2025 & 2033
- Figure 21: Europe Advanced Ceramics Industry Revenue Share (%), by Class Type 2025 & 2033
- Figure 22: Europe Advanced Ceramics Industry Revenue (Million), by End-user Industry 2025 & 2033
- Figure 23: Europe Advanced Ceramics Industry Revenue Share (%), by End-user Industry 2025 & 2033
- Figure 24: Europe Advanced Ceramics Industry Revenue (Million), by Country 2025 & 2033
- Figure 25: Europe Advanced Ceramics Industry Revenue Share (%), by Country 2025 & 2033
- Figure 26: South America Advanced Ceramics Industry Revenue (Million), by Material Type 2025 & 2033
- Figure 27: South America Advanced Ceramics Industry Revenue Share (%), by Material Type 2025 & 2033
- Figure 28: South America Advanced Ceramics Industry Revenue (Million), by Class Type 2025 & 2033
- Figure 29: South America Advanced Ceramics Industry Revenue Share (%), by Class Type 2025 & 2033
- Figure 30: South America Advanced Ceramics Industry Revenue (Million), by End-user Industry 2025 & 2033
- Figure 31: South America Advanced Ceramics Industry Revenue Share (%), by End-user Industry 2025 & 2033
- Figure 32: South America Advanced Ceramics Industry Revenue (Million), by Country 2025 & 2033
- Figure 33: South America Advanced Ceramics Industry Revenue Share (%), by Country 2025 & 2033
- Figure 34: Middle East and Africa Advanced Ceramics Industry Revenue (Million), by Material Type 2025 & 2033
- Figure 35: Middle East and Africa Advanced Ceramics Industry Revenue Share (%), by Material Type 2025 & 2033
- Figure 36: Middle East and Africa Advanced Ceramics Industry Revenue (Million), by Class Type 2025 & 2033
- Figure 37: Middle East and Africa Advanced Ceramics Industry Revenue Share (%), by Class Type 2025 & 2033
- Figure 38: Middle East and Africa Advanced Ceramics Industry Revenue (Million), by End-user Industry 2025 & 2033
- Figure 39: Middle East and Africa Advanced Ceramics Industry Revenue Share (%), by End-user Industry 2025 & 2033
- Figure 40: Middle East and Africa Advanced Ceramics Industry Revenue (Million), by Country 2025 & 2033
- Figure 41: Middle East and Africa Advanced Ceramics Industry Revenue Share (%), by Country 2025 & 2033
List of Tables
- Table 1: Global Advanced Ceramics Industry Revenue Million Forecast, by Material Type 2020 & 2033
- Table 2: Global Advanced Ceramics Industry Revenue Million Forecast, by Class Type 2020 & 2033
- Table 3: Global Advanced Ceramics Industry Revenue Million Forecast, by End-user Industry 2020 & 2033
- Table 4: Global Advanced Ceramics Industry Revenue Million Forecast, by Region 2020 & 2033
- Table 5: Global Advanced Ceramics Industry Revenue Million Forecast, by Material Type 2020 & 2033
- Table 6: Global Advanced Ceramics Industry Revenue Million Forecast, by Class Type 2020 & 2033
- Table 7: Global Advanced Ceramics Industry Revenue Million Forecast, by End-user Industry 2020 & 2033
- Table 8: Global Advanced Ceramics Industry Revenue Million Forecast, by Country 2020 & 2033
- Table 9: China Advanced Ceramics Industry Revenue (Million) Forecast, by Application 2020 & 2033
- Table 10: India Advanced Ceramics Industry Revenue (Million) Forecast, by Application 2020 & 2033
- Table 11: Japan Advanced Ceramics Industry Revenue (Million) Forecast, by Application 2020 & 2033
- Table 12: South Korea Advanced Ceramics Industry Revenue (Million) Forecast, by Application 2020 & 2033
- Table 13: Rest of Asia Pacific Advanced Ceramics Industry Revenue (Million) Forecast, by Application 2020 & 2033
- Table 14: Global Advanced Ceramics Industry Revenue Million Forecast, by Material Type 2020 & 2033
- Table 15: Global Advanced Ceramics Industry Revenue Million Forecast, by Class Type 2020 & 2033
- Table 16: Global Advanced Ceramics Industry Revenue Million Forecast, by End-user Industry 2020 & 2033
- Table 17: Global Advanced Ceramics Industry Revenue Million Forecast, by Country 2020 & 2033
- Table 18: United States Advanced Ceramics Industry Revenue (Million) Forecast, by Application 2020 & 2033
- Table 19: Canada Advanced Ceramics Industry Revenue (Million) Forecast, by Application 2020 & 2033
- Table 20: Mexico Advanced Ceramics Industry Revenue (Million) Forecast, by Application 2020 & 2033
- Table 21: Global Advanced Ceramics Industry Revenue Million Forecast, by Material Type 2020 & 2033
- Table 22: Global Advanced Ceramics Industry Revenue Million Forecast, by Class Type 2020 & 2033
- Table 23: Global Advanced Ceramics Industry Revenue Million Forecast, by End-user Industry 2020 & 2033
- Table 24: Global Advanced Ceramics Industry Revenue Million Forecast, by Country 2020 & 2033
- Table 25: Germany Advanced Ceramics Industry Revenue (Million) Forecast, by Application 2020 & 2033
- Table 26: United Kingdom Advanced Ceramics Industry Revenue (Million) Forecast, by Application 2020 & 2033
- Table 27: Italy Advanced Ceramics Industry Revenue (Million) Forecast, by Application 2020 & 2033
- Table 28: France Advanced Ceramics Industry Revenue (Million) Forecast, by Application 2020 & 2033
- Table 29: Rest of Europe Advanced Ceramics Industry Revenue (Million) Forecast, by Application 2020 & 2033
- Table 30: Global Advanced Ceramics Industry Revenue Million Forecast, by Material Type 2020 & 2033
- Table 31: Global Advanced Ceramics Industry Revenue Million Forecast, by Class Type 2020 & 2033
- Table 32: Global Advanced Ceramics Industry Revenue Million Forecast, by End-user Industry 2020 & 2033
- Table 33: Global Advanced Ceramics Industry Revenue Million Forecast, by Country 2020 & 2033
- Table 34: Brazil Advanced Ceramics Industry Revenue (Million) Forecast, by Application 2020 & 2033
- Table 35: Argentina Advanced Ceramics Industry Revenue (Million) Forecast, by Application 2020 & 2033
- Table 36: Rest of South America Advanced Ceramics Industry Revenue (Million) Forecast, by Application 2020 & 2033
- Table 37: Global Advanced Ceramics Industry Revenue Million Forecast, by Material Type 2020 & 2033
- Table 38: Global Advanced Ceramics Industry Revenue Million Forecast, by Class Type 2020 & 2033
- Table 39: Global Advanced Ceramics Industry Revenue Million Forecast, by End-user Industry 2020 & 2033
- Table 40: Global Advanced Ceramics Industry Revenue Million Forecast, by Country 2020 & 2033
- Table 41: Saudi Arabia Advanced Ceramics Industry Revenue (Million) Forecast, by Application 2020 & 2033
- Table 42: South Africa Advanced Ceramics Industry Revenue (Million) Forecast, by Application 2020 & 2033
- Table 43: Rest of Middle East and Africa Advanced Ceramics Industry Revenue (Million) Forecast, by Application 2020 & 2033
Frequently Asked Questions
1. What is the projected Compound Annual Growth Rate (CAGR) of the Advanced Ceramics Industry?
The projected CAGR is approximately > 6.00%.
2. Which companies are prominent players in the Advanced Ceramics Industry?
Key companies in the market include 3M (Ceradyne Inc ), AGC Inc, Applied Ceramics Inc, Blasch Precision Ceramics Inc, Ceramtec, COI Ceramics Inc, Coorstek Inc, Corning Incorporated, International Ceramics Inc, Kyocera Corporation, MARUWA Co Ltd, Materion Corporation, McDanel Advanced Ceramic Technologies, Morgan Advanced Materials, Murata Manufacturing Co Ltd, Rauschert GmbH, Saint-Gobain, Small Precision Tools Inc, Vesuvius, Wonik QnC Corporation*List Not Exhaustive.
3. What are the main segments of the Advanced Ceramics Industry?
The market segments include Material Type, Class Type, End-user Industry.
4. Can you provide details about the market size?
The market size is estimated to be USD XX Million as of 2022.
5. What are some drivers contributing to market growth?
Rise in Use as Alternative to Metals and Plastics; Growing Demand in the Medical Industry; Eco-friendliness and Reliability of Use.
6. What are the notable trends driving market growth?
The Electronics and Electrical Industry is Expected to Dominate the Market.
7. Are there any restraints impacting market growth?
Rise in Use as Alternative to Metals and Plastics; Growing Demand in the Medical Industry; Eco-friendliness and Reliability of Use.
8. Can you provide examples of recent developments in the market?
In April 2021, CeramTec developed a ceramic power module for drive inverters for e-mobility solutions. CeramTec and the Fraunhofer Institute for Integrated Systems and Device Technology collaborated to develop cooling solutions for power electronics in e-mobility drive trains. The launch date announced for this new product was May 2021.
9. What pricing options are available for accessing the report?
Pricing options include single-user, multi-user, and enterprise licenses priced at USD 4750, USD 5250, and USD 8750 respectively.
10. Is the market size provided in terms of value or volume?
The market size is provided in terms of value, measured in Million.
11. Are there any specific market keywords associated with the report?
Yes, the market keyword associated with the report is "Advanced Ceramics Industry," which aids in identifying and referencing the specific market segment covered.
12. How do I determine which pricing option suits my needs best?
The pricing options vary based on user requirements and access needs. Individual users may opt for single-user licenses, while businesses requiring broader access may choose multi-user or enterprise licenses for cost-effective access to the report.
13. Are there any additional resources or data provided in the Advanced Ceramics Industry report?
While the report offers comprehensive insights, it's advisable to review the specific contents or supplementary materials provided to ascertain if additional resources or data are available.
14. How can I stay updated on further developments or reports in the Advanced Ceramics Industry?
To stay informed about further developments, trends, and reports in the Advanced Ceramics Industry, consider subscribing to industry newsletters, following relevant companies and organizations, or regularly checking reputable industry news sources and publications.
Methodology
Step 1 - Identification of Relevant Samples Size from Population Database


Step 2 - Approaches for Defining Global Market Size (Value, Volume* & Price*)

Note*: In applicable scenarios
Step 3 - Data Sources
Primary Research
- Web Analytics
- Survey Reports
- Research Institute
- Latest Research Reports
- Opinion Leaders
Secondary Research
- Annual Reports
- White Paper
- Latest Press Release
- Industry Association
- Paid Database
- Investor Presentations

Step 4 - Data Triangulation
Involves using different sources of information in order to increase the validity of a study
These sources are likely to be stakeholders in a program - participants, other researchers, program staff, other community members, and so on.
Then we put all data in single framework & apply various statistical tools to find out the dynamic on the market.
During the analysis stage, feedback from the stakeholder groups would be compared to determine areas of agreement as well as areas of divergence